calgary transit safety, security and cleanliness survey
calgary transit safety, security and cleanliness survey
calgary transit safety, security and cleanliness survey

You also want an ePaper? Increase the reach of your titles
YUMPU automatically turns print PDFs into web optimized ePapers that Google loves.
Calgary Transit<br />
Safety, Security <strong>and</strong> Cleanliness Survey 2009<br />
results in a greater comfort while using the particular type of Transit service that<br />
the <strong>safety</strong> measure supports. 9<br />
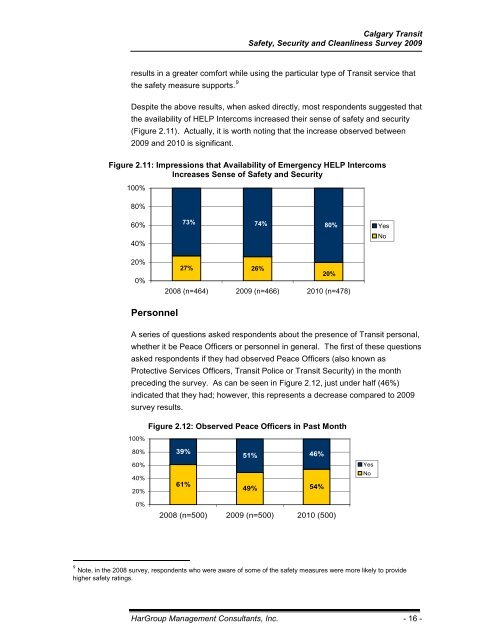
Despite the above results, when asked directly, most respondents suggested that<br />
the availability of HELP Intercoms increased their sense of <strong>safety</strong> <strong>and</strong> <strong>security</strong><br />
(Figure 2.11). Actually, it is worth noting that the increase observed between<br />
2009 <strong>and</strong> 2010 is significant.<br />
Figure 2.11: Impressions that Availability of Emergency HELP Intercoms<br />
Increases Sense of Safety <strong>and</strong> Security<br />
100%<br />
80%<br />
60%<br />
40%<br />
73% 74%<br />
80%<br />
Yes<br />
No<br />
20%<br />
27% 26%<br />
20%<br />
0%<br />
2008 (n=464) 2009 (n=466) 2010 (n=478)<br />
Personnel<br />
.<br />
A series of questions asked respondents about the presence of Transit personal,<br />
whether it be Peace Officers or personnel in general. The first of these questions<br />
asked respondents if they had observed Peace Officers (also known as<br />
Protective Services Officers, Transit Police or Transit Security) in the month<br />
preceding the <strong>survey</strong>. As can be seen in Figure 2.12, just under half (46%)<br />
indicated that they had; however, this represents a decrease compared to 2009<br />
<strong>survey</strong> results.<br />
Figure 2.12: Observed Peace Officers in Past Month<br />
100%<br />
80% 39%<br />
51% 46%<br />
60%<br />
40%<br />
61%<br />
20%<br />
49% 54%<br />
Yes<br />
No<br />
0%<br />
2008 (n=500) 2009 (n=500) 2010 (500)<br />
.<br />
9 Note, in the 2008 <strong>survey</strong>, respondents who were aware of some of the <strong>safety</strong> measures were more likely to provide<br />
higher <strong>safety</strong> ratings.<br />
HarGroup Management Consultants, Inc. - 16 -