calgary transit safety, security and cleanliness survey
calgary transit safety, security and cleanliness survey
calgary transit safety, security and cleanliness survey

You also want an ePaper? Increase the reach of your titles
YUMPU automatically turns print PDFs into web optimized ePapers that Google loves.
Calgary Transit<br />
Safety, Security <strong>and</strong> Cleanliness Survey 2009<br />
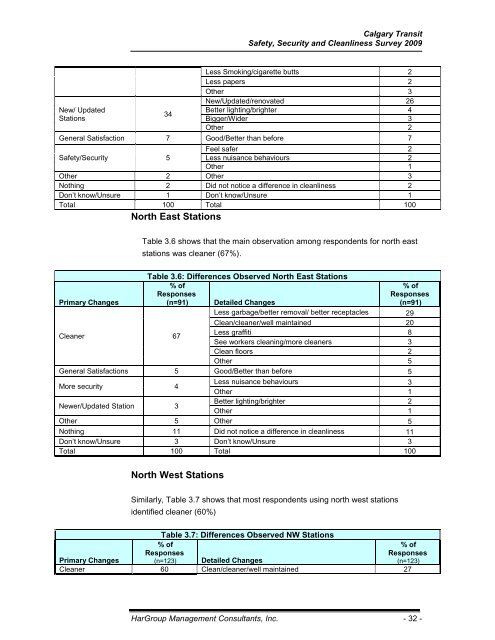
New/ Updated<br />
Stations<br />
34<br />
Less Smoking/cigarette butts 2<br />
Less papers 2<br />
Other 3<br />
New/Updated/renovated 26<br />
Better lighting/brighter 4<br />
Bigger/Wider 3<br />
Other 2<br />
General Satisfaction 7 Good/Better than before 7<br />
Feel safer 2<br />
Safety/Security 5 Less nuisance behaviours 2<br />
Other 1<br />
Other 2 Other 3<br />
Nothing 2 Did not notice a difference in <strong>cleanliness</strong> 2<br />
Don’t know/Unsure 1 Don’t know/Unsure 1<br />
Total 100 Total 100<br />
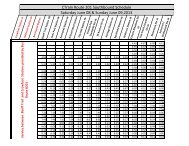
North East Stations<br />
Table 3.6 shows that the main observation among respondents for north east<br />
stations was cleaner (67%).<br />
Primary Changes<br />
Table 3.6: Differences Observed North East Stations<br />
% of<br />
Responses<br />
(n=91) Detailed Changes<br />
% of<br />
Responses<br />
(n=91)<br />
Less garbage/better removal/ better receptacles 29<br />
Clean/cleaner/well maintained 20<br />
Cleaner 67<br />
Less graffiti 8<br />
See workers cleaning/more cleaners 3<br />
Clean floors 2<br />
Other 5<br />
General Satisfactions 5 Good/Better than before 5<br />
More <strong>security</strong> 4<br />
Less nuisance behaviours 3<br />
Other 1<br />
Newer/Updated Station 3<br />
Better lighting/brighter 2<br />
Other 1<br />
Other 5 Other 5<br />
Nothing 11 Did not notice a difference in <strong>cleanliness</strong> 11<br />
Don’t know/Unsure 3 Don’t know/Unsure 3<br />
Total 100 Total 100<br />
North West Stations<br />
Similarly, Table 3.7 shows that most respondents using north west stations<br />
identified cleaner (60%)<br />
Table 3.7: Differences Observed NW Stations<br />
Primary Changes<br />
% of<br />
Responses<br />
(n=123) Detailed Changes<br />
% of<br />
Responses<br />
(n=123)<br />
Cleaner 60 Clean/cleaner/well maintained 27<br />
HarGroup Management Consultants, Inc. - 32 -