calgary transit safety, security and cleanliness survey
calgary transit safety, security and cleanliness survey
calgary transit safety, security and cleanliness survey

You also want an ePaper? Increase the reach of your titles
YUMPU automatically turns print PDFs into web optimized ePapers that Google loves.
Calgary Transit<br />
Safety, Security <strong>and</strong> Cleanliness Survey 2009<br />
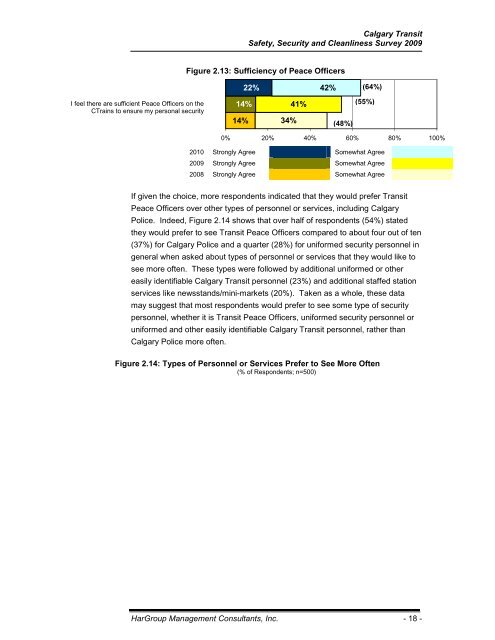
Figure 2.13: Sufficiency of Peace Officers<br />
22%<br />
42%<br />
(64%)<br />
I feel there are sufficient Peace Officers on the<br />
CTrains to ensure my personal <strong>security</strong><br />
14%<br />
14%<br />
34%<br />
41%<br />
(55%)<br />
(48%)<br />
0% 20% 40% 60% 80% 100%<br />
2010 Strongly Agree Somewhat Agree<br />
2009 Strongly Agree Somewhat Agree<br />
2008 Strongly Agree Somewhat Agree<br />
If given the choice, more respondents indicated that they would prefer Transit<br />
Peace Officers over other types of personnel or services, including Calgary<br />
Police. Indeed, Figure 2.14 shows that over half of respondents (54%) stated<br />
they would prefer to see Transit Peace Officers compared to about four out of ten<br />
(37%) for Calgary Police <strong>and</strong> a quarter (28%) for uniformed <strong>security</strong> personnel in<br />
general when asked about types of personnel or services that they would like to<br />
see more often. These types were followed by additional uniformed or other<br />
easily identifiable Calgary Transit personnel (23%) <strong>and</strong> additional staffed station<br />
services like newsst<strong>and</strong>s/mini-markets (20%). Taken as a whole, these data<br />
may suggest that most respondents would prefer to see some type of <strong>security</strong><br />
personnel, whether it is Transit Peace Officers, uniformed <strong>security</strong> personnel or<br />
uniformed <strong>and</strong> other easily identifiable Calgary Transit personnel, rather than<br />
Calgary Police more often.<br />
Figure 2.14: Types of Personnel or Services Prefer to See More Often<br />
(% of Respondents; n=500)<br />
HarGroup Management Consultants, Inc. - 18 -