estonian agriculture, rural economy and food industry
estonian agriculture, rural economy and food industry
estonian agriculture, rural economy and food industry

Create successful ePaper yourself
Turn your PDF publications into a flip-book with our unique Google optimized e-Paper software.
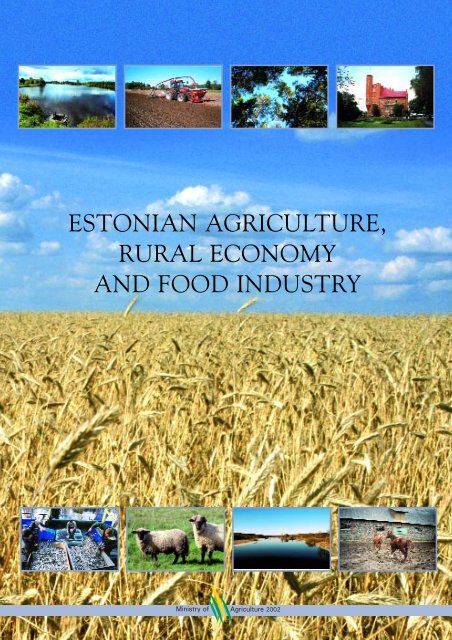
ESTONIAN AGRICULTURE,<br />
RURAL ECONOMY<br />
AND FOOD INDUSTRY
STRUCTURE OF THE MINISTRY OF AGRICULTURE<br />
AND ITS AREA OF ADMINISTRATION<br />
Advisers to the Ministry<br />
Minister<br />
Advisers to the Minister<br />
Secretary General<br />
Deputy Secretary General<br />
for Agriculture <strong>and</strong> Rural<br />
Development<br />
Deputy Secretary General<br />
for Agro-Food <strong>and</strong> Trade<br />
Department<br />
of Rural<br />
Development<br />
Department<br />
of Agriculture<br />
Veterinary <strong>and</strong><br />
Food<br />
Department<br />
Department of Agro-<br />
Food <strong>and</strong> Trade<br />
Department<br />
of Legal<br />
Services<br />
Department of<br />
Public <strong>and</strong><br />
Foreign Affairs<br />
Administrative<br />
Department<br />
Department<br />
of Internal<br />
Audit<br />
Department of<br />
Fisheries<br />
Economics<br />
Government agencies <strong>and</strong> their local offices<br />
Plant Production<br />
Inspectorate<br />
+<br />
15 regional offices<br />
Border Service of<br />
Plant Production<br />
Inspectorate<br />
+ 8 border<br />
inspection points<br />
Animal Breeding<br />
Inspectorate<br />
Agricultural Registers <strong>and</strong><br />
Information Board<br />
+<br />
15 regional offices<br />
Veterinary <strong>and</strong><br />
Food Board<br />
+<br />
15 regional offices<br />
Border Service of<br />
Veterinary <strong>and</strong><br />
Food Board<br />
+13 border inspection<br />
points<br />
Centres <strong>and</strong> laboratories<br />
Jäneda Training<br />
<strong>and</strong> Advisory<br />
Centre<br />
Animal Recording<br />
Centre<br />
Control Centre of<br />
Plant Production<br />
Veterinary <strong>and</strong> Food<br />
Laboratory<br />
+6 regional<br />
laboratories<br />
Research establishments<br />
Estonian Research<br />
Institute of<br />
Agriculture<br />
Jõgeva Institute of<br />
Plant Breeding
Contents<br />
1. What Estonia is like 3<br />
Territory, population, climate, mineral resources, soils<br />
2. Reforms have changed Estonian <strong>agriculture</strong> 7<br />
Changes in <strong>agriculture</strong> after Estonia re-gained independence<br />
Grain <strong>and</strong> dairy farms are most common<br />
3. Trade is largest with European Union 11<br />
<strong>and</strong> Baltic states<br />
Russia is relatively modest trade partner to Estonia<br />
Estonian consumers prefer domestic goods<br />
4. Economic results of <strong>agriculture</strong> 13<br />
Large agricultural enterprises are<br />
efficient cereal growers<br />
Number of animals <strong>and</strong> livestock production have<br />
significantly decreased in ten years<br />
5. Young people are interested in 19<br />
agricultural higher education<br />
The number of students in <strong>rural</strong> <strong>economy</strong> vocational educational<br />
institutions could be greater<br />
Agricultural producers are in need of advice<br />
1
6. Forests are an important natural resource in Estonia 23<br />
Age structure of forests is uneven; many spruce<br />
forests are ready for cutting<br />
Estonian timber <strong>industry</strong> is developing rapidly<br />
7. Fishing is an important <strong>industry</strong> for Estonia 25<br />
Estonia has 40 fishing ports<br />
Export <strong>and</strong> import of fish <strong>and</strong> fish products<br />
8. Food <strong>industry</strong> yields a quarter of the total industrial output 27<br />
Dairy <strong>industry</strong> is the largest<br />
Meat processing concentrates in large-scale enterprises<br />
9. Measures taken to assure <strong>food</strong> safety 31<br />
10. Rural enterprise is developing 33<br />
Dairy associations are popular<br />
Examples of enterprise<br />
11. Different l<strong>and</strong>scape types have been preserved in Estonia 37<br />
Estonia endeavours to protect natural diversity<br />
Editors: Ülo Kalm, Ants Laansalu<br />
Front cover picture: Arne Ader<br />
Photos: Ove Maidla, Kaido Haagen, Archives of the Ministry of Agriculture<br />
Translator: Kadri Kivistik<br />
Printed by KO Ofset<br />
Väike Vanker 2002<br />
2
1.<br />
What Estonia is like<br />
Estonia is a small country that borders on the Baltic Sea in the west <strong>and</strong> has<br />
a number of small isl<strong>and</strong>s along its coastline. For thous<strong>and</strong>s of years, the sea has<br />
shaped the country’s climate <strong>and</strong> therefore the temperament <strong>and</strong> way of life of its<br />
inhabitants, thus nurturing their diligence <strong>and</strong> composure.<br />
3
1.<br />
Facts about<br />
Estonia<br />
Territory<br />
• Estonia’s territory is 45,227 km.<br />
• Estonia has 14,421 Baltic Sea isl<strong>and</strong>s with a<br />
total area of 4,130 km 2 .<br />
• Estonia has 1,150 lakes with a total area of<br />
2,015 km 2 .<br />
• Estonia has 14,331 km 2 of agricultural l<strong>and</strong><br />
<strong>and</strong> 20,155 km 2 of forest.<br />
• Estonia has four national parks <strong>and</strong> 217<br />
conservation areas occupying 12% of the<br />
country’s entire territory.<br />
Population<br />
• The population of Estonia is 1.45 million.<br />
Estonia has 47 towns <strong>and</strong> 207 parishes, <strong>and</strong><br />
is divided into 15 counties.<br />
• The largest towns are Tallinn (440,000 inhabitants),<br />
Tartu, Narva, Kohtla-Järve, <strong>and</strong><br />
Pärnu. More than one-half of the population<br />
(1.01m) lives in towns.<br />
• 31% of the population lives in <strong>rural</strong> areas.<br />
4
1.<br />
Climate<br />
• Estonia’s climate is influenced by its close<br />
proximity to the Baltic Sea <strong>and</strong> the intensive<br />
cyclonical processes of the Atlantic Ocean.<br />
Moderately cold winters, cool springs,<br />
moderately warm <strong>and</strong> variably dry-to-rainy<br />
summers <strong>and</strong> long autumns are typical.<br />
• The annual average temperature is +5 °C.<br />
July is the warmest month with an average<br />
temperature of +16 °C to +17.5 °C, while<br />
February is the coldest with an average temperature<br />
of –3.5 °C in the western parts of<br />
Estonia <strong>and</strong> its isl<strong>and</strong>s <strong>and</strong> –7.5 °C in the<br />
eastern part of Estonia.<br />
• There are 1600–1870 sunny hours a year;<br />
the annual radiation balance for the territory<br />
encompassing Estonia is 3500 MJ/m.<br />
• The vegetation period (daily average temperature<br />
above +5 °C) lasts from the<br />
beginning of May until the end of<br />
September, the duration of which is approximately<br />
175 days.<br />
• The annual average rainfall is 550–720 mm.<br />
Rainfall exceeds humidity loss due to<br />
evaporation.<br />
• The average relative humidity in Estonia is<br />
80%.<br />
Mineral resources<br />
• The most important mineral resources of<br />
Estonia are oil shale, phosphorite, <strong>and</strong> peat.<br />
• Estonian oil shale is regarded as being of the<br />
world’s finest quality. Estonia’s oil shale<br />
resource coverage areas are in the northeast<br />
of the country, totaling approximately<br />
6,000 km 2 . The largest single Estonian deposit<br />
contains nearly 8 billion tonnes of oil<br />
shale. Oil shale is primarily used as a fuel for<br />
power stations (80%) <strong>and</strong> as raw material<br />
for the oil shale chemical <strong>industry</strong> (20%).<br />
• Phosphorite resources, which are located in<br />
Under<br />
water<br />
6%<br />
L<strong>and</strong> use 01.01.2001<br />
Other l<strong>and</strong> 17%<br />
Forest l<strong>and</strong> 45%<br />
Arable<br />
l<strong>and</strong> 25%<br />
Natural<br />
grassl<strong>and</strong> 7%<br />
5
1.<br />
the Rakvere deposit, were discovered in the<br />
1970s. The estimated stock of the useful<br />
component (diphosphorus pentoxide) is ca<br />
700 million tonnes. To date, phosphorite<br />
has only been excavated from the Maardu<br />
deposit <strong>and</strong> is used for making single<br />
superphosphate <strong>and</strong> phosphorite powder.<br />
• Limestone <strong>and</strong> dolomite deposits are mainly<br />
located <strong>and</strong> on its isl<strong>and</strong>s <strong>and</strong> in the<br />
northern portions of Estonia. Limestone is<br />
used as raw material for cement, lime burning,<br />
construction stone <strong>and</strong> broken stone.<br />
Dolomite is mainly used as a decorative<br />
construction stone.<br />
• Mineral sea mud <strong>and</strong> organic-rich lake mud<br />
are used for therapeutic mud treatment.<br />
The main sea mud deposits are in the<br />
Haapsalu <strong>and</strong> Riga Bays.<br />
• Mineral water is obtained from boreholes<br />
in Värska near Lake Peipsi, <strong>and</strong> is sold as<br />
bottled drinking water under the br<strong>and</strong><br />
name Värska.<br />
• Next to Finl<strong>and</strong>, Estonia is one the richest<br />
countries in bogs; bogs occupy 24% of<br />
Estonia’s l<strong>and</strong> territory.<br />
• Bog areas are rich in peat: peat deposits<br />
cover 901,500 ha. The estimated peat stock<br />
is 2.37 billion tonnes. The annual maximum<br />
rate of peat use is 2.37 million tonnes<br />
as established by a Government resolution.<br />
Forty per cent of the extracted peat is<br />
exported; the remainder is used as horticultural<br />
fertiliser <strong>and</strong> as fuel for heating residential<br />
buildings.<br />
Soils<br />
• Soil quality is assessed on a point basis that<br />
is dependant on its fertility <strong>and</strong> technological<br />
conditions. The average soil rating of<br />
the total arable l<strong>and</strong> in Estonia is 41 points.<br />
• Soils above 50 points are regarded as good;<br />
Estonia’s coverage of this soil type is<br />
134,000 ha (12% of arable l<strong>and</strong>). Soils of<br />
average fertility (30–50 points) cover<br />
837,000 ha (74.6% of arable l<strong>and</strong>). Soils of<br />
low fertility (less than 30 points) cover<br />
151,000 ha (13.4% of arable l<strong>and</strong>).<br />
• The most fertile soils can be found in Järva,<br />
Jõgeva, Lääne-Viru, <strong>and</strong> Tartu counties.<br />
6
2.<br />
Reforms have changed<br />
Estonian <strong>agriculture</strong><br />
Agriculture has been an important sphere of activity <strong>and</strong> a source of income for<br />
Estonians all throughout its history. Three major reforms having conflicting objectives<br />
have affected Estonia’s agricultural activity within the 20 th century.<br />
7
2.<br />
Changes in <strong>agriculture</strong> after Estonia<br />
re-gained independence<br />
During the 20 th century, Estonia experienced<br />
three significant political transformations, the<br />
conflicting objectives of which had dramatic<br />
impact on its agricultural activity:<br />
In the 1920s, former manor l<strong>and</strong>s were sold to<br />
farmers as Estonia became independent for the first<br />
time in history. Estonian <strong>agriculture</strong> began to<br />
develop rapidly <strong>and</strong> Estonia became a considerable<br />
agricultural producer in Europe.<br />
At the end of the 1940s, forced collectivisation<br />
was carried out in Estonia under the conditions of<br />
Soviet occupation; l<strong>and</strong> was expropriated from its<br />
owners <strong>and</strong> made public, <strong>and</strong> farmers were forced<br />
to work on collective farms.<br />
At the end of the 1980s, as Estonia re-gains independence,<br />
l<strong>and</strong> that was unlawfully expropriated<br />
during the Soviet occupation is returned to the lawful<br />
owners. Farms are restored <strong>and</strong> larger agricultural<br />
enterprises emerge as the result of the buying <strong>and</strong><br />
leasing of the privatised property of collective farms.<br />
In 1988, even before Estonia regained its independence,<br />
the Estonian SSR government adopted an<br />
unprecedented decision to permit the re-establishment<br />
of farms <strong>and</strong> enable the selling of machinery,<br />
equipment, <strong>and</strong> vehicles to farmers.<br />
The Farm Act was adopted in 1989 to provide<br />
legal guarantees for the establishment <strong>and</strong> development<br />
of farms.<br />
The L<strong>and</strong> Reform Act was adopted in 1991.<br />
Under this Act, l<strong>and</strong> was returned to the lawful<br />
owners <strong>and</strong> it was possible to privatise l<strong>and</strong> by<br />
pre-emptive rights or on general grounds. People<br />
whose buildings were located on l<strong>and</strong> subject to<br />
privatisation were entitled to pre-emptive rights.<br />
Since 1996 the restitution <strong>and</strong> privatisation of<br />
l<strong>and</strong> has intensified. By the end of 2001, 860,000<br />
ha, or 71% of the agricultural l<strong>and</strong> stock <strong>and</strong><br />
1.5 million ha of forest l<strong>and</strong> had been entered into<br />
the l<strong>and</strong> register. L<strong>and</strong> reform is expected to be<br />
finalised by 2003.<br />
The Agricultural Reform Act was adopted in<br />
1992. This Act established the grounds for the<br />
liquidation of collective farms <strong>and</strong> the establishment<br />
of new farms <strong>and</strong> agricultural enterprises –<br />
private <strong>and</strong> public limited companies – on the basis<br />
of their assets <strong>and</strong> l<strong>and</strong>.<br />
The assets of 360 previously collective farms<br />
were used to establish 11,700 commercial farms<br />
<strong>and</strong> 709 agricultural enterprises.<br />
Relative share of <strong>agriculture</strong><br />
has decreased<br />
As a result of reforms, the relative share of <strong>agriculture</strong><br />
in the gross domestic product decreased<br />
from 15% to 3.3% during 1991–2000, while<br />
employment in <strong>agriculture</strong> decreased from 15% to<br />
5.2%. Due to structural changes, the employment of<br />
TABLE 1.<br />
Agriculture in the national <strong>economy</strong><br />
1992 1993 1996 1997 1998 1999 2000<br />
Share of <strong>agriculture</strong> <strong>and</strong> hunting<br />
in GDP (millions of kroons,<br />
current prices)<br />
1665,9*<br />
2123,1*<br />
2722,6<br />
2779,5<br />
2810,0<br />
2584,2<br />
2784,1<br />
Relative share in GDP (%)<br />
11,7<br />
9,3<br />
5,2<br />
4,3<br />
4,3<br />
3,7<br />
3,6<br />
Employment in <strong>agriculture</strong> <strong>and</strong><br />
hunting (‘000)<br />
114,6<br />
91,9<br />
52,1<br />
44,8<br />
43,5<br />
38,2<br />
31,5<br />
Employment %<br />
15,0<br />
13,0<br />
8,1<br />
6,9<br />
6,8<br />
6,2<br />
5,2<br />
Export of agricultural products<br />
(millions of kroons)<br />
973,5<br />
2498,6<br />
3227,6<br />
3391,3<br />
3476,9<br />
2589,9<br />
3093,6<br />
Relative share of export of<br />
agricultural products (%)<br />
17,5<br />
23,5<br />
15,2<br />
11,5<br />
9,9<br />
7,5<br />
5,8<br />
* including forestry<br />
(Source: Estonian Statistical Office (ESO))<br />
8
2.<br />
<strong>rural</strong> inhabitants in <strong>agriculture</strong> <strong>and</strong> fishing has decreased<br />
by 50%. However, employment in the third<br />
sector, the services sector, has significantly increased.<br />
Agriculture accounts for a small<br />
share in GDP <strong>and</strong> export<br />
As shown in Table 1, the relative share of <strong>agriculture</strong><br />
in the gross domestic product (GDP) had decreased<br />
3.5 times since 1992 <strong>and</strong> the export of agricultural<br />
products decreased threefold.<br />
Rural employment is lower<br />
In 1992, 51% of the <strong>rural</strong> working population was<br />
employed in <strong>agriculture</strong>; the respective figure for the<br />
year 2000 was 18% (Tables 2 <strong>and</strong> 3).<br />
TABLE 2.<br />
Number of employees<br />
250000<br />
200000<br />
150000<br />
100000<br />
50000<br />
0<br />
Employment in <strong>rural</strong> areas <strong>and</strong> in<br />
<strong>agriculture</strong> during 1991–2000<br />
Total <strong>rural</strong> employment<br />
Agriculture<br />
1991<br />
1992<br />
1993<br />
1994<br />
1995<br />
1996<br />
1997<br />
1998<br />
1999<br />
2000<br />
Year<br />
TABLE 3.<br />
Rural employment during 1991–2000*<br />
(annual average, ‘000)<br />
Year<br />
1991<br />
1992<br />
1993<br />
1994<br />
1995<br />
1996<br />
1997<br />
1998<br />
1999<br />
2000<br />
Total <strong>rural</strong><br />
employment<br />
237 300<br />
226 300<br />
207 500<br />
201 100<br />
177 500<br />
176 200<br />
177 100<br />
183 500<br />
181 000<br />
177 400<br />
Including <strong>agriculture</strong><br />
<strong>and</strong> hunting<br />
128 900<br />
114 600<br />
91 900<br />
75 900<br />
55 500<br />
52 100<br />
44 800<br />
43 500<br />
38 200<br />
31 500<br />
* 1991–1996: persons aged 15–69; 1997–2000: persons aged 15–74<br />
Sources: ESO publications “Labour Force 1998, 1999 <strong>and</strong> 2000”<br />
9
2.<br />
TABLE 4.<br />
Number of agricultural enterprises as of 1 January 2001<br />
Associations <strong>and</strong> state-owned enterprises<br />
1994 1995 1996 1997 1998 1999 2000<br />
1 013 983 873 854 803 734 680<br />
2001<br />
709<br />
Agricultural ancillary enterprises<br />
95<br />
87<br />
52<br />
44<br />
31<br />
33<br />
25<br />
68<br />
Farms<br />
10 153<br />
13 513<br />
19 767<br />
22 722<br />
34 671<br />
41 446<br />
51 081<br />
60 895<br />
Average farm size<br />
24,8<br />
23,1<br />
20,8<br />
22,0<br />
21,7<br />
21,2<br />
20,8<br />
20,7<br />
(Source: ESO annual publication “Agriculture 2000”)<br />
TABLE 5.<br />
Types of production<br />
2000 Percentage of<br />
total output<br />
Total crop production<br />
Grains<br />
Oil crops<br />
Legumes<br />
Potatoes<br />
Vegetables <strong>and</strong><br />
fruits, berries,<br />
<strong>and</strong> others<br />
100%<br />
36,7%<br />
1,4%<br />
1,7%<br />
25,3%<br />
16,1%<br />
18,8%<br />
38%<br />
TABLE 6.<br />
Many small farms have emerged<br />
The number of associations <strong>and</strong> state-owned<br />
enterprises has decreased in the post-reform years.<br />
The last state-owned enterprise was privatised in<br />
2001. The number of agricultural ancillary<br />
enterprises has also decreased. The number of<br />
farms has grown, but farm size has decreased<br />
(Table 4).<br />
Grain <strong>and</strong> dairy farms are<br />
most common<br />
Agricultural holdings specialise in three types of<br />
production: 45% of the farms engage in crop production,<br />
21% in dairy farming, <strong>and</strong> 31% in mixed<br />
production (crop <strong>and</strong> livestock production).<br />
The most common crop type is grain, the output<br />
of which accounts for 36.7% of total crop production.<br />
Dairy farming is the most common area of<br />
livestock farming, where milk products constitute<br />
45.9% of the total livestock production.<br />
Livestock<br />
production<br />
Bovines<br />
Pigs<br />
Sheep<br />
Milk<br />
Other<br />
100%<br />
10,1%<br />
22,1%<br />
0,2%<br />
45,9%<br />
21,8%<br />
(Source: Ministry of Agriculture, using EUROSTAT methods)<br />
62%<br />
10
3.<br />
Trade is largest with European<br />
Union <strong>and</strong> Baltic states<br />
Estonia’s trade policy has been liberal during the last ten years. Purchasing of agricultural produce by<br />
the state stopped in 1991 <strong>and</strong> pricing was deregulated.<br />
The open <strong>economy</strong> has implied greater opportunities as well as greater risks to the developing state:<br />
Estonian domestic market prices are directly affected by price changes on the world market.<br />
The purchasing prices of the main agricultural products increased after the country regained independence.<br />
Although experiencing a downturn in 1997, higher prices returned again in 1999. Dem<strong>and</strong><br />
increased on the domestic as well as the foreign market in 2000. In part, this was due to the favourable<br />
world market situation, which also triggered a rise in producer prices. The purchasing prices grew by<br />
44.9% for milk, 35.7% for pork, 9.4% for beef, 18.2% for wheat, <strong>and</strong> 11.6% for rye.<br />
11
3.<br />
Mark of<br />
origin <strong>and</strong><br />
quality<br />
Quality<br />
Mark<br />
3,00<br />
2,50<br />
2,00<br />
1,50<br />
1,00<br />
0,50<br />
0,00<br />
30<br />
25<br />
20<br />
15<br />
10<br />
5<br />
0<br />
Russia is relatively modest trade<br />
partner to Estonia<br />
While exports to Russia accounted for 44% of<br />
Estonia’s foreign trade in 1994, it consisted of only<br />
4% by the year 2000. This decrease is due to higher<br />
basic import tariffs on Estonian products entering<br />
Russia, which are set twice as high as those established<br />
for its most favoured trade partners.<br />
Exports to Estonia’s neighbouring countries,<br />
Lithuania <strong>and</strong> Latvia have grown rapidly. While the<br />
share of Estonian agricultural products exported to<br />
these countries in 1994 was 15.6%, by the year 2000<br />
it had increased to 39.4%.<br />
The relative share of Estonian agricultural products<br />
exported to European Union countries has continually<br />
grown. Export to the EU accounted for<br />
23.2% of the total agricultural exports in 1994, <strong>and</strong><br />
39.4% in 2000.<br />
In July 1994 a free trade agreement was signed between<br />
Estonia <strong>and</strong> Europe, which entered into force on<br />
1 January 1995. The agreement enabled the marketing<br />
of Estonian products in European markets with the favourable<br />
conditions of 60% lower custom’s tariff rates.<br />
The Europe Agreement signed in 1995 gave Estonia<br />
the status of an associated country of the European<br />
Union, resulting in wider access to EU markets. The<br />
agreement also helped make Estonia more attractive<br />
to foreign investors.<br />
Fish <strong>and</strong> milk products are the major articles of<br />
agricultural export, accounting for 39.4% <strong>and</strong> 24.7%<br />
of exports in 2000.<br />
The export of meat products also increased in<br />
2000 when 99% of its pork was exported to Latvia<br />
<strong>and</strong> Lithuania.<br />
The import of agricultural <strong>and</strong> <strong>food</strong> products to<br />
Estonia has also significantly grown. In 2000, the<br />
amount of imported milk products was 44,000<br />
tonnes, which accounted for 10% of the domestic<br />
market consumption. Import of meat products in the<br />
same year was 40,600 tonnes, which accounted for<br />
46% of the domestic market consumption.<br />
Import of grains <strong>and</strong> grain products amounted to<br />
Milk purchasing price in 1994–2000 (EEK/kg)<br />
1994 1995 1996 1997 1998 1999 2000<br />
Dynamics of beef <strong>and</strong> pork purchasing prices (EEK/kg)<br />
pork<br />
beef<br />
1993 1994 1995 1996 1997 1998 1999 2000<br />
222,000 tonnes, consisting of one-third of the domestic<br />
market consumption.<br />
From 1 January 2000, customs duties were imposed<br />
on agricultural <strong>and</strong> <strong>food</strong> products imported from<br />
countries with which Estonia has no free trade agreement.<br />
This was the first step toward changing the previously<br />
liberal trade policy. However, as the relative<br />
share of the countries affected by the new customs duties<br />
is rather insignificant in total imports, the economic<br />
effect of the customs duties was modest as expected.<br />
Overall figures indicated the foreign trade balance<br />
in 2000 as negative: imports substantially exceeded<br />
exports.<br />
Estonian consumers prefer domestic goods<br />
The Estonian consumer prefers domestic products<br />
over imports for three main reasons: price, traditional<br />
tastes, <strong>and</strong> naturally cleaner raw materials.<br />
Since 1994, in order to assess the position of<br />
domestic products in the domestic market <strong>and</strong> consumer<br />
preferences depending on product origin, the<br />
Estonian Institute of Economic Research has conducted<br />
surveys <strong>and</strong> performed research studies for the<br />
Ministry of Agriculture. Results indicate that the<br />
assortment of domestic goods available to consumers<br />
has continually grown. The market shares of domestic<br />
goods that have increased the most are of ice cream,<br />
yoghurt, curds, boiled sausage <strong>and</strong> frankfurters,<br />
smoked sausage, smoked meat, bread, <strong>and</strong> biscuits.<br />
Competition between producers is tough in several<br />
product groups, corresponding to more <strong>and</strong> more new<br />
products being brought to the market.<br />
In certain product groups (pasta, margarine, vegetable<br />
oil, poultry meat), the local market has been<br />
occupied by importers. Following the launch of vegetable<br />
oil production in Estonia, many consumers<br />
started to prefer domestic vegetable oil.<br />
The Estonian <strong>food</strong> <strong>industry</strong> considers it necessary<br />
to value domestic raw material, which is why the<br />
Estonian Chamber of Agriculture <strong>and</strong> Commerce<br />
developed the mark “Approved Estonian Taste” in<br />
2000. The mark of origin is given to products of<br />
100% Estonian origin which have successfully passed<br />
laboratory <strong>and</strong> quality assessment. The requirement of<br />
domestic raw material cannot be applied to all <strong>food</strong>s<br />
(such as confectionery products), which is why the former<br />
quality mark is also still in use.<br />
179,5<br />
130,8<br />
Export of agricultural products in 2000,<br />
in millions of kroons<br />
64,1<br />
275,5<br />
249,3<br />
942,4<br />
1252<br />
European<br />
Union<br />
Baltic States<br />
Russia<br />
Ukraine<br />
EFTA<br />
CEEC<br />
Others<br />
12
4.<br />
Economic results of <strong>agriculture</strong><br />
Favourable conditions for field crop production <strong>and</strong> organic farming.<br />
L<strong>and</strong> cultivation became the main activity <strong>and</strong> source of income for Estonians during the<br />
Bronze Age, 1700–500 BC. Permanent fields <strong>and</strong> households engaging in l<strong>and</strong> cultivation<br />
emerged in the present territory of Estonia during the 5th century.<br />
Grain export was an important part of the <strong>economy</strong> in the 17 th <strong>and</strong> 18 th centuries. In the<br />
first half of the 20 th century there was an increase in the dem<strong>and</strong> for meat; where after<br />
cattle <strong>and</strong> dairy farming became the dominant. Today, there are 1.12 million hectares of<br />
arable l<strong>and</strong>, which is nearly one-quarter of the total l<strong>and</strong> stock.<br />
13
4.<br />
TABLE 1.<br />
1990<br />
1991<br />
1992<br />
1993<br />
1994<br />
1995<br />
1996<br />
1997<br />
1998<br />
1999<br />
2000<br />
(Source: ESO)<br />
TABLE 2.<br />
1990<br />
1991<br />
1992<br />
1993<br />
1994<br />
1995<br />
1996<br />
1997<br />
1998<br />
1999<br />
2000<br />
Cereals<br />
397000<br />
418113<br />
423104<br />
375100<br />
319505<br />
304342<br />
288780<br />
326641<br />
354057<br />
321029<br />
329347<br />
Cereals<br />
957,3<br />
939,2<br />
598,1<br />
810,7<br />
510,4<br />
513,5<br />
629,2<br />
650,5<br />
576,2<br />
401,6<br />
696,6<br />
hanges in total crop area<br />
When compared to 1990, the present total crop<br />
area st<strong>and</strong>s at a decrease of 27%. The relative area<br />
used for cereals <strong>and</strong> feed crops has decreased,<br />
while areas used for oil crops <strong>and</strong> legumes have<br />
increased. The proportion of unused <strong>and</strong> uncultivated<br />
l<strong>and</strong> has also increased. Crop fields have<br />
decreased due to the slow pace of l<strong>and</strong> <strong>and</strong> agricultural<br />
reform <strong>and</strong> also the economic difficulties<br />
encountered by farms <strong>and</strong> agricultural enterprises<br />
as a result of low market prices for agricultural<br />
products. Many agricultural producers are not able<br />
to acquire the needed new machinery due to the<br />
lack of funds (Tables 1 <strong>and</strong> 2).<br />
Increasing the cereals production<br />
is on the agenda<br />
Over the last ten years cereal production in Estonia<br />
has decreased by 20%. This is chiefly thought to be<br />
for two reasons. First, the domestic market price of<br />
cereals has decreased as a result of cheap import<br />
cereals, on which the importing countries have<br />
paid direct or indirect export subsidies. The second<br />
reason for Estonia’s decreased production is its<br />
relatively small use of fertilisers <strong>and</strong> herbicides.<br />
Legumes<br />
100<br />
100<br />
400<br />
400<br />
700<br />
3700<br />
5800<br />
8700<br />
6367<br />
2922<br />
3892<br />
Total crop area (ha)<br />
Oil<br />
crops<br />
2600<br />
2328<br />
3808<br />
1592<br />
2840<br />
6185<br />
8739<br />
8223<br />
17584<br />
24262<br />
28 821<br />
Vegetables<br />
5200<br />
5700<br />
5100<br />
4600<br />
4400<br />
4600<br />
4200<br />
3900<br />
4200<br />
3871<br />
3 789<br />
Total crop yield ('000 t)<br />
Legumes<br />
0,2<br />
0,2<br />
0,4<br />
0,7<br />
1,1<br />
6,3<br />
13,8<br />
17,0<br />
8,3<br />
3,1<br />
6,6<br />
Oil crops<br />
1,1<br />
0,8<br />
1,5<br />
0,8<br />
2,2<br />
7,0<br />
10,0<br />
9,6<br />
17,9<br />
29,8<br />
38,7<br />
Potatoes<br />
45500<br />
52200<br />
46300<br />
42600<br />
39900<br />
36900<br />
35300<br />
35200<br />
32600<br />
31124<br />
30 865<br />
Vegetables<br />
105,0<br />
120,5<br />
78,4<br />
70,0<br />
78,0<br />
56,8<br />
54,7<br />
52,3<br />
50,2<br />
44,7<br />
53,3<br />
Feed<br />
crops<br />
665300<br />
635200<br />
627000<br />
632200<br />
566900<br />
493900<br />
515500<br />
480800<br />
446033<br />
435191<br />
412 797<br />
Potatoes<br />
618,1<br />
592,1<br />
669,1<br />
538,6<br />
563,0<br />
537,4<br />
500,2<br />
437,5<br />
316,7<br />
403,7<br />
471,7<br />
Additionally, weather conditions in Estonia in<br />
1998 <strong>and</strong> 1999 were unfavourable toward cereal<br />
production.<br />
Of cereals, the crop area for rye production has<br />
decreased the most (60%). During the same time,<br />
however, buckwheat production has begun in<br />
Estonia, of which the total area is constantly<br />
increasing. Buckwheat is a good honey plant <strong>and</strong> is<br />
therefore preferred by beekeepers. Diet-<strong>food</strong> producers<br />
have also started to value buckwheat. (Table<br />
3, Figure 1).<br />
According to expert assessment, Estonia’s<br />
domestic market need for grains is 700,000 tonnes.<br />
This value is inclusive of 152,000 tonnes of cereals<br />
needed to feed 1.4 million people: 60,000 tonnes<br />
of rye <strong>and</strong> 92,000 tonnes of wheat. In addition to<br />
baking flour, 28,000 tonnes of cereals are needed<br />
for groats <strong>and</strong> flakes. The feed crop dem<strong>and</strong>, in<br />
consideration of the existing number of animals is<br />
450,000 tonnes.<br />
Production of rye <strong>and</strong> wheat, the main cereals,<br />
has become considerably smaller than is needed for<br />
self sufficiency; importation of bread cereals has<br />
therefore become necessary.<br />
In 2000, Estonia joined the International<br />
Convention for the Protection of New Varieties of<br />
Plants (UPOV); as of 24 September 2000 Estonia is<br />
the 46th member of UPOV.<br />
In 2000, nine certificates for protected varieties<br />
were issued to the Jõgeva Plant Breeding Institute.<br />
There are currently a total of 36 protected varieties<br />
in Estonia. Overall, 108 new varieties were added<br />
to the Variety List in 2000.<br />
Large agricultural enterprises are<br />
efficient cereal growers<br />
Grain production is the main activity in large farms<br />
<strong>and</strong> agricultural enterprises. As can be seen from<br />
Figure 1, large agricultural enterprises with more<br />
than 100 ha of l<strong>and</strong> produce 59% of all grains.<br />
Small farms, where l<strong>and</strong> used for cereal crops is up<br />
to 10 ha, grow only 8% of Estonia’s grains.<br />
The results of 108 test holdings primarily<br />
engaged in plant production were analysed by the<br />
Jäneda Training <strong>and</strong> Advisory Centre of the<br />
Ministry of Agriculture in 1999. The average size<br />
of the test holdings was 125 ha of arable l<strong>and</strong>, of<br />
which 75 ha were currently producing grains. The<br />
average number of employees was 2.4 per farm;<br />
the average area of l<strong>and</strong> per employee was 51.8 ha<br />
of arable l<strong>and</strong> <strong>and</strong> 31.1 ha of crop. Labour use was<br />
the most efficient in enterprises of 100-400 ha:<br />
91.5 <strong>and</strong> 54.6 ha per labour unit.<br />
Average cereal yields in test holdings were<br />
1552 kg/ha in 1999 <strong>and</strong> 1924 kg/ha in 2000.<br />
Of all grains produced, an average of 96.3%<br />
was sold. In enterprises with 100-400 ha of producing<br />
crop l<strong>and</strong>s, 98% of the grains were sold; in<br />
14
4.<br />
smaller enterprises (up to 40 ha), 93.1% of grains<br />
were sold <strong>and</strong> the remainders were used for the<br />
farms' own needs. The marketing opportunities are<br />
better for large enterprises, as the production quantities<br />
are larger. The average price paid to producers<br />
for grains was 1.42 EEK/kg.<br />
Analysis carried out by researchers of the<br />
Estonian Research Institute of Agriculture shows<br />
that grain production in Estonia is profitable at the<br />
average producer prices (1500-1700 EEK/t) if the<br />
yield is at least 4000 kg/ha. On smaller farms, production<br />
costs can be cut by cooperating in machine<br />
use or purchasing second-h<strong>and</strong> machinery.<br />
Estonia covers its <strong>food</strong> potato dem<strong>and</strong><br />
Potatoes are grown in Estonia mainly on small<br />
farms <strong>and</strong> private residences, <strong>and</strong> to a lesser extent,<br />
in larger agricultural enterprises (Table 4).<br />
The area used for potato production has<br />
decreased in recent years. Total area for potato production<br />
in the year 2000 was 30,900 ha. The total<br />
yield was 471,661 tonnes with an average yield of<br />
15.6 t/ha. In the year 2001, the total area for potato<br />
production decreased with a yield of 345,230<br />
tonnes; the average yield was 16.1 t/ha.<br />
The <strong>food</strong> potato dem<strong>and</strong> (120,000 – 140,000<br />
tonnes) is fully met. The seed dem<strong>and</strong> for 30,000<br />
ha is approximately 140,000 tonnes; industrial<br />
potato dem<strong>and</strong> is 10,000 tonnes, <strong>and</strong> 100,000<br />
tonnes of potatoes is needed for starch production.<br />
Oil crop <strong>and</strong> flax production<br />
are developing<br />
The crop area used for oil crops in 1990 was 1000<br />
ha; in 1999 it was at 24,100 ha. A vegetable oil<br />
plant was commissioned in Estonia in 1999, which<br />
improved the marketing opportunities of rapeseed<br />
<strong>and</strong> turnip rapeseed. A portion of both oil seeds<br />
was exported to Finl<strong>and</strong> <strong>and</strong> Denmark.<br />
While in 1990 flax was grown mostly for fibre<br />
production, more recently the focus has been<br />
toward oil flax production. Fibre flax production in<br />
Estonia is almost non-existent, which is primarily<br />
because Estonian flax cannot compete on the market<br />
with state subsidised flax from other European<br />
countries, Latvia, <strong>and</strong> Lithuania.<br />
Flax was sown in 2000 on 325 ha, of which 275<br />
ha was oil flax, <strong>and</strong> only 50 ha was fibre flax.<br />
Domestic horticultural products<br />
are preferred in Estonia<br />
The development of Estonian horticulture has been<br />
influenced by the population's preference for<br />
domestic quality fruits, vegetables, <strong>and</strong> berries.<br />
Interest from foreign countries in Estonian<br />
products has also increased.<br />
Almost one-half of all horticultural products<br />
produced in Estonia are grown in small gardens.<br />
FIGURE 1.<br />
12%<br />
TABLE 3.<br />
1990<br />
1991<br />
1992<br />
1993<br />
1994<br />
1995<br />
1996<br />
1997<br />
1998<br />
1999<br />
2000<br />
Area under cereals (%) in size groups of<br />
agricultural enterprises in 2000 (ha)<br />
25%<br />
(Source: ESO)<br />
Rye<br />
65 900<br />
58 500<br />
59 200<br />
61 900<br />
21 700<br />
32 000<br />
31 600<br />
34 300<br />
38 800<br />
24 258<br />
28 937<br />
22%<br />
8%<br />
Winter<br />
wheat<br />
21 200<br />
17 200<br />
26 800<br />
32 700<br />
15 400<br />
13 400<br />
17 200<br />
17 800<br />
19 400<br />
13 052<br />
21 736<br />
10%<br />
23%<br />
Up to 10 ha<br />
10,1–50<br />
50,1–100<br />
100,1–300<br />
300,1–500<br />
Over 500 ha<br />
Source: Review<br />
2000/2001<br />
Agriculture <strong>and</strong><br />
<strong>rural</strong> life<br />
Areas under grains (ha)<br />
Summer<br />
wheat<br />
4 800<br />
7 000<br />
16 700<br />
17 600<br />
18 800<br />
25 200<br />
28 700<br />
33 100<br />
47 400<br />
53 062<br />
47 233<br />
Barley<br />
263 700<br />
284 800<br />
268 200<br />
218 100<br />
217 900<br />
186 500<br />
148 000<br />
165 700<br />
166 800<br />
153 955<br />
165 672<br />
Oats<br />
33 400<br />
42 300<br />
41 700<br />
35 700<br />
36 100<br />
38 500<br />
49 000<br />
54 400<br />
61 000<br />
60 976<br />
53 345<br />
Buckw<br />
heat<br />
0<br />
13<br />
4<br />
0<br />
5<br />
42<br />
80<br />
41<br />
57<br />
63<br />
493<br />
Mixed<br />
crops<br />
8 000<br />
8 300<br />
10 500<br />
9 100<br />
9 600<br />
8 700<br />
14 200<br />
21 300<br />
20 600<br />
15 663<br />
12 531<br />
15
4.<br />
TABLE 4.<br />
Total yield ('000 t)<br />
800<br />
700<br />
600<br />
500<br />
400<br />
300<br />
200<br />
100<br />
0<br />
(Source: ESA)<br />
Suitable soils, relatively favourable climate, <strong>and</strong><br />
cheap labour enable the production of quality<br />
horticultural products. Fruit <strong>and</strong> vegetable production,<br />
as well as berry production, give small producers<br />
(with less than 20 ha of arable l<strong>and</strong>) a good<br />
opportunity to develop enterprise in areas where<br />
natural peculiarities are not suitable for large-scale<br />
production (south-east <strong>and</strong> southern Estonia, areas<br />
near Lake Peipsi, <strong>and</strong> the isl<strong>and</strong>s).<br />
Large-scale horticultural <strong>and</strong> vegetable production<br />
is still in the developing stage. Large investments<br />
are needed in modern technologies, post-harvest<br />
processing, <strong>and</strong> storage. Presently, only single<br />
large producers are able to make such investments.<br />
Total area for open field vegetables in the year<br />
2000 was 3,900 ha with a total yield of 50,000<br />
tonnes. Total yield included 1,300 ha of cabbage<br />
(22,000 t), 700 ha of carrots (12,000 t), 600 ha of<br />
<strong>food</strong> beet (6000 t), <strong>and</strong> 1,300 ha of other open<br />
field vegetables (10,000 t).<br />
Relating to the adjustment of production to<br />
market needs <strong>and</strong> consumer preferences, research<br />
was carried out to identify the available vegetable<br />
varieties that had not yet spread to Estonia, their<br />
suitability for local conditions, <strong>and</strong> the market<br />
dem<strong>and</strong> for these in Estonia. The results revealed a<br />
dem<strong>and</strong> for curled parsley, broccoli, <strong>and</strong> stalk<br />
celery. The problem, however, is the high production<br />
cost of these vegetables; their production<br />
involves a large amount of manual work for which<br />
the current the low market price does not cover.<br />
According to expert assessment, the total area<br />
for cold-frame vegetables in 2000 was 120 ha <strong>and</strong><br />
the total yield was 8,000 tonnes. The total area<br />
included 52.7 ha for cucumber (4,000 t), 56.5 ha for<br />
tomatoes (2,500 t) <strong>and</strong> 10.8 ha for other vegetables.<br />
The total area of fruit trees <strong>and</strong> berry plantations<br />
in 2000 was 11,900 ha according to expert<br />
assessment. The total estimated yield was 28,000<br />
tonnes, of which fruits accounted for 21,300<br />
tonnes (8,450 ha) <strong>and</strong> berries accounted for 6,700<br />
tonnes (3,450 ha).<br />
Total yield <strong>and</strong> average yield of potatoes<br />
1990 1991 1992 1993 1994 1995 1996 1997 1998 1999<br />
Total yield<br />
Average yield<br />
20<br />
15<br />
10<br />
50<br />
0<br />
Average yield (t/ha)<br />
In the year 2000, low-growth rootstock was<br />
purchased from foreign countries for testing to<br />
check their suitability for Estonia’s climate conditions.<br />
Nurseries have started to grow rootstock to<br />
propagate varieties suitable for fruit production. The<br />
first apple plantations based on low-growth rootstock<br />
were established in different regions in 2001.<br />
Apple yields have been plentiful during recent<br />
years <strong>and</strong> the market price for apples has been low.<br />
Dem<strong>and</strong> for drupes (plums, cherries) has been<br />
stable <strong>and</strong> the yields have been satisfactory.<br />
Dem<strong>and</strong> for wild berries (cranberries, cowberries,<br />
bilberries, brambles) has increased. Their<br />
growing as crops has become a new branch of production<br />
in the recent years. Exhausted peat<br />
deposits, covering an area of ca 3000 ha in Estonia,<br />
are suitable for cranberry production.<br />
The production of sea buckthorn has begun to<br />
spread in Estonia. The yields have been satisfactory.<br />
The yield in Rõhu experimental station was 5 t/ha.<br />
Extensive l<strong>and</strong> improvement has<br />
been undertaken in Estonia<br />
A total of 730,000 ha of l<strong>and</strong> have been drained in<br />
Estonia; 649,000 ha by drainage systems <strong>and</strong><br />
81,000 ha by ditch systems. Polders have been built<br />
on 7,900 ha <strong>and</strong> 10,500 km of roads have been<br />
built in the course of l<strong>and</strong> improvement work.<br />
L<strong>and</strong> improvement systems require regular<br />
maintenance in order to assure the drained areas do<br />
not become too moist <strong>and</strong> eventually fall out of agricultural<br />
use. The Ministry of Agriculture considers it<br />
necessary to maintain 550,000 ha of drained l<strong>and</strong><br />
when Estonia joins the European Union.<br />
The maintenance of drainage systems is expensive;<br />
Estonia has been aided in performing this<br />
work by the World Bank <strong>and</strong> by organisations of<br />
many different countries. During the last three<br />
years, the World Bank loan has been used to<br />
reconstruct the drainage mains <strong>and</strong> receiving water<br />
bodies of drainage systems on more than<br />
75,000 ha. The World Bank loan has not been used<br />
to renew field drainage systems.<br />
Since 1998, a l<strong>and</strong> improvement <strong>and</strong> l<strong>and</strong><br />
management pilot project has been implemented in<br />
Estonia with support from Senter, an organisation of<br />
the Ministry of Economic Affairs of the<br />
Netherl<strong>and</strong>s, <strong>and</strong> the Ministry of Agriculture,<br />
Nature Conservation <strong>and</strong> Fisheries of the Netherl<strong>and</strong>s.<br />
The idea was generated in 1996 when the<br />
World Bank loan project was launched. The project<br />
provided for the reconstruction of l<strong>and</strong> improvement<br />
objects as well as the formation of l<strong>and</strong> <strong>and</strong><br />
water associations.<br />
The Dutch specialists recommended an<br />
approach to the l<strong>and</strong> use issues in a comprehensive<br />
manner; use l<strong>and</strong> re-allotment in conjunction with<br />
maintenance of the improved l<strong>and</strong>. Due to changes<br />
16
4.<br />
in ownership relations, a situation has emerged in<br />
Estonia where one owner can own 2 to 15 or even<br />
more separate parcels of l<strong>and</strong>; however, it is very<br />
difficult to make economic use of the l<strong>and</strong>.<br />
In 2000, reconstruction projects for 185 ha of<br />
polders <strong>and</strong> 118 ha of sprinkled areas were prepared<br />
in cooperation between the Estonian company<br />
PB Maa ja Vesi <strong>and</strong> the Finnish company<br />
Salaojakeskus Ry.<br />
Until 1995, l<strong>and</strong> improvement systems were<br />
included in the balance sheets of the local l<strong>and</strong><br />
amelioration bureaux. In the course of l<strong>and</strong> restitution,<br />
l<strong>and</strong> improvement systems that were located<br />
on the l<strong>and</strong>s of owners, were granted to the<br />
owners free of charge. Twenty-two per cent of the<br />
drainage systems had been transferred to l<strong>and</strong><br />
owners by the end of 2000.<br />
It is more benificial for l<strong>and</strong> owners to manage<br />
the l<strong>and</strong> improvement systems collectively as a<br />
single system can cover the l<strong>and</strong>s of several owners.<br />
The first l<strong>and</strong> <strong>and</strong> water association (LWA) was<br />
founded in 1993. Since 1995, the state has supported<br />
the foundation <strong>and</strong> activities of LWAs. One<br />
hundred LWAs had been registered by the end of<br />
2000. For improved efficiency, local unions <strong>and</strong> a<br />
Federation of L<strong>and</strong> <strong>and</strong> Water Association have<br />
been established.<br />
Another problem of Estonian <strong>agriculture</strong> is the<br />
acidity of soils. The estimated area of soils in need<br />
of liming is 200,000–300,000 ha. Acidic soils need<br />
to be limed every five years. In the prices of 2000,<br />
the liming of one hectare cost 800–2,500 kroons.<br />
The state supports liming of soils in an average<br />
amount of 14–17 million EEK a year.<br />
Transition to a market <strong>economy</strong><br />
changed the structure of livestock<br />
farming<br />
The reduction in the total livestock production in<br />
1993–1999 was greater than the reduction in total<br />
plant production. Due to transitioning to new market<br />
conditions, the relative share of <strong>agriculture</strong> decreased<br />
<strong>and</strong> brought about structural changes in livestock<br />
production. The changes are also reflected in domestic<br />
<strong>and</strong> foreign dem<strong>and</strong> for <strong>food</strong>stuff (Table 5).<br />
The number of sheep <strong>and</strong> goats <strong>and</strong> the number<br />
of bovine animals have decreased the most<br />
over the last ten years: 78% <strong>and</strong> 65% respectively.<br />
The negative effect is also apparent in l<strong>and</strong><br />
use: Pastures <strong>and</strong> grassl<strong>and</strong>s have fallen out of<br />
use; they are covered with weeds <strong>and</strong> will<br />
eventually overgrow with bushes.<br />
Dairy farming is the main source<br />
of income for agricultural holdings<br />
Dairy farming is the main source of income for<br />
agricultural holdings despite the fact that the total<br />
yield of milk has decreased 1.6 times in the last ten<br />
years. The total milk yield in the year 2000 was<br />
629,000 t (1,093,000 t in 1991) (Figure 2).<br />
The total milk yield has decreased due to the<br />
decrease in the number of bovine animals;<br />
however, yields per cow have increased since 1994<br />
<strong>and</strong> continue to grow.<br />
Yields per cow are improving partly due to the<br />
remaining herds consisting of the best performing<br />
cattle <strong>and</strong> milk producers having started paying<br />
more attention to balanced feed rations <strong>and</strong> to the<br />
quality of feedstuff, particularly silage production.<br />
TABLE 5.<br />
1991<br />
1992<br />
1993<br />
1994<br />
1995<br />
1996<br />
1997<br />
1998<br />
1999<br />
2000<br />
(Source: ESO)<br />
FIGURE 2.<br />
'000 tonnes<br />
Bovines<br />
708,3<br />
614,6<br />
463,2<br />
419,5<br />
370,4<br />
343,0<br />
325,6<br />
307,5<br />
267,3<br />
252,8<br />
Number of animals as of 31 December ('000)<br />
Pigs<br />
798,6<br />
541,1<br />
424,3<br />
459,8<br />
448,8<br />
298,4<br />
306,3<br />
326,4<br />
285,7<br />
300,2<br />
1400<br />
1200<br />
1000<br />
800<br />
600<br />
400<br />
200<br />
0<br />
1990 1991 1992 1993 1994 1995 1996 1997 1998 1999 2000<br />
Milk ('000 t)<br />
Sheep <strong>and</strong> goats<br />
142,8<br />
124,2<br />
83,3<br />
61,5<br />
49,8<br />
39,2<br />
35,6<br />
30,8<br />
30,9<br />
32,2<br />
Horses<br />
7,8<br />
6,6<br />
5,2<br />
5,0<br />
4,6<br />
4,2<br />
4,2<br />
3,9<br />
3,9<br />
4,2<br />
Yield per cow (kg/year)<br />
Poultry<br />
5 538,3<br />
3 418,1<br />
3 226,1<br />
3 129,7<br />
2 911,3<br />
2 324,9<br />
2 602,0<br />
2 635,7<br />
2 461,8<br />
2366,4<br />
5250<br />
4500<br />
3750<br />
3000<br />
2250<br />
1500<br />
750<br />
0<br />
kg/year<br />
17
4.<br />
Size groups<br />
… - 4<br />
5 - 10<br />
11 - 50<br />
51 - 100<br />
101 - 300<br />
300 - 900<br />
900 - …<br />
TOTAL<br />
Source: ARIB<br />
1991<br />
1992<br />
1993<br />
1994<br />
1995<br />
1996<br />
1997<br />
1998<br />
1999<br />
2000<br />
There are still many small herds<br />
The owners of small herds (4–10 cows) constitute<br />
the majority of livestock producers (67.9%). Only<br />
7.7% of livestock farmers own large dairy farms,<br />
but the bulk of dairy cattle (nearly 70%) are kept<br />
on large farms of over 100 cows (Table 6).<br />
The number of small herd owners is constantly<br />
decreasing due to the increasingly stricter requirements<br />
that are imposed on farms <strong>and</strong> milk quality.<br />
Small herd owners cannot comply with the<br />
increased regulation as it requires large investments<br />
in barn reconstruction <strong>and</strong> the acquisition of<br />
modern milk production machinery.<br />
Research carried out by the Estonian Agricultural<br />
University <strong>and</strong> the Jäneda Training <strong>and</strong><br />
Advisory Centre in 1999 indicated that the three<br />
major cost articles of milk producers are feedstuff,<br />
labour <strong>and</strong> social tax, <strong>and</strong> fuel, which account for<br />
70% of all production costs. The share of feedstuff<br />
costs is larger in small herds (11–50 cows) <strong>and</strong><br />
smaller in herds of 100 cows. The same holds true<br />
for fuel costs. Larger herds provide the opportunity<br />
for more cost effective production of milk.<br />
Pork is the main meat<br />
produced in Estonia<br />
TABLE 6.<br />
Number of cows subjected to performance testing <strong>and</strong> herd size<br />
TABLE 7.<br />
Source: ESO<br />
Meat<br />
production<br />
151,8<br />
107,9<br />
83,7<br />
69,4<br />
67,7<br />
58,6<br />
53,4<br />
60,0<br />
61,1<br />
52,7<br />
Number of herds<br />
1 246<br />
934<br />
691<br />
94<br />
169<br />
70<br />
7<br />
3 211<br />
%<br />
38,8<br />
29,1<br />
21,5<br />
2,9<br />
5,3<br />
2,2<br />
0,2<br />
100,0<br />
2 859<br />
6 573<br />
13 853<br />
6 923<br />
29 755<br />
32 249<br />
10 181<br />
102 393<br />
Meat production ('000 t)<br />
Beef<br />
52,0<br />
45,4<br />
42,6<br />
31,0<br />
25,8<br />
22,1<br />
19,0<br />
19,3<br />
21,7<br />
15,4<br />
Pork<br />
75,2<br />
50,1<br />
34,7<br />
30,5<br />
35,4<br />
31,7<br />
29,5<br />
32,4<br />
31,3<br />
30,3<br />
Number of cows<br />
Sheep <strong>and</strong><br />
goat meat<br />
2,2<br />
1,8<br />
1,2<br />
1,3<br />
0,8<br />
0,5<br />
0,5<br />
0,4<br />
0,4<br />
0,4<br />
%<br />
2,8<br />
6,4<br />
13,5<br />
6,8<br />
29,1<br />
31,5<br />
9,9<br />
100,0<br />
Poultry<br />
meat<br />
22,1<br />
10,3<br />
5,1<br />
6,5<br />
5,6<br />
4,3<br />
4,4<br />
7,9<br />
7,7<br />
…<br />
The main meat produced in Estonia is pork, which<br />
accounted for 55% of the total meat production in<br />
2000. Beef takes the second position with 28%, followed<br />
by poultry meat, 16%, <strong>and</strong> sheep <strong>and</strong> goat<br />
meat, 1%. The total meat production in Estonia<br />
was 182,000 tonnes in 1990 <strong>and</strong> 51,000 tonnes in<br />
2000; a reduction of 72%. One of the major reasons<br />
for the decreased production was the substantially<br />
decreased dem<strong>and</strong> on the eastern market, as<br />
well as the low purchasing prices on the domestic<br />
market (Table 7).<br />
Pork production fell sharply in 1993 <strong>and</strong> has<br />
since remained relatively stable. The number of<br />
pigs has remained around 300,000. The majority of<br />
pigs, 85%, are kept in large agricultural enterprises.<br />
Of pigs entered in the register of farm animals,<br />
the majority are purebred Yorkshire pigs (42%) <strong>and</strong><br />
l<strong>and</strong>race pigs (24%), which are equal for their meat<br />
qualities. Thirty-three per cent of the pigs are<br />
cross-bred <strong>and</strong> their number is increasing. The<br />
quality of pork has improved. According to performance<br />
testing data, the lean meat content in the<br />
pigs subjected to testing was 58% (the recommended<br />
rate is 59-60%).<br />
As from 1 July 2000 the European Union<br />
adopted the decision to abolish pork export subsidies<br />
<strong>and</strong> granted Estonia a customs-fee export<br />
quota. Latvia also abolished its export restrictions.<br />
These steps should stimulate pork export.<br />
The low purchasing prices of beef have not<br />
stimulated producers to fatten bovines for sale <strong>and</strong><br />
the majority of bull calves are killed at an age<br />
younger than one month. Since the second half of<br />
2000, the purchasing prices of beef increased, but<br />
did not result in growing beef sales. However, the<br />
interest of livestock farmers in beef cattle has<br />
increased <strong>and</strong> production can be expected to grow<br />
slowly.<br />
The production of sheep meat has remained at<br />
a level of 400 tonnes. The interest of processors<br />
<strong>and</strong> traders in purchasing sheep meat is great,<br />
because the export price of sheep meat is up to 92<br />
EEK/kg.<br />
The increased meat price has also stimulated<br />
interest in sheep keeping, <strong>and</strong> the number of sheep<br />
increased to 31,400 by the end of 2000.<br />
Sheep farming in Estonia was also stimulated by<br />
the ewe support that was introduced in 1999. As a<br />
result, the marking <strong>and</strong> registration of sheep has<br />
begun in order to assure the receipt of support for<br />
sheep farming.<br />
Poultry meat production in 2000 amounted to<br />
8,100 tonnes, of which 75% came from Estonia's<br />
largest poultry meat producer AS Tallegg.<br />
Dem<strong>and</strong> for poultry meat has increased in<br />
Estonia. Although the poultry meat production of<br />
Tallegg increased 13% in 2000, there is still ample<br />
room for development before producers for the<br />
domestic market can fully meet the dem<strong>and</strong>s <strong>and</strong><br />
the need for importing this type of meat reduced.<br />
18
5.<br />
Young people are interested<br />
in agricultural higher education<br />
Jäneda Training <strong>and</strong> Advisory Centre<br />
19
5.<br />
There is competition for entrance<br />
into the Agricultural University<br />
The Estonian Agricultural University admitted 863<br />
students in the year 2000. Competition was one of<br />
the toughest among universities. Four to five c<strong>and</strong>idates<br />
competed for each state-sponsored place in<br />
the traditional agricultural areas of specialisation:<br />
agronomy, animal husb<strong>and</strong>ry, agricultural, <strong>and</strong><br />
enterprise engineering. Up to 15–16 c<strong>and</strong>idates<br />
competed for each state-sponsored place in the<br />
utilisation <strong>and</strong> protection of natural resources <strong>and</strong><br />
l<strong>and</strong>scape protection <strong>and</strong> maintenance.<br />
The strategic development plans of the Agricultural<br />
University (EAU) were formulated in<br />
2000. The development plan also provides for the<br />
preparation of specialists with higher education in<br />
areas of specialisation such as l<strong>and</strong>scape design,<br />
environmental protection, sustainable use of<br />
renewable natural resources, <strong>food</strong> quality <strong>and</strong> safety,<br />
tourism, <strong>and</strong> socio-economic development of<br />
<strong>rural</strong> areas, in addition to the traditional areas of<br />
specialisation. A new structure of the university is<br />
being built based on the development plan.<br />
All curricula of the EAU have been accredited,<br />
some of them conditionally (agricultural engineering<br />
at all levels of study, master's study in agricultural<br />
energetics, <strong>and</strong> doctorate study in water<br />
management <strong>and</strong> <strong>rural</strong> engineering).<br />
In order to modernise the study opportunities,<br />
new subjects are added each year in the existing<br />
areas of specialisation <strong>and</strong> new areas of specialisation<br />
are also added. Since 1997, higher education<br />
can also be obtained through distant learning, but<br />
the students have to pay their own tuition fees.<br />
In the year 2000, admission to master's <strong>and</strong><br />
doctoral studies also increased at EAU: 132 students<br />
were admitted to master's study <strong>and</strong> 44 to<br />
doctorate study. Research institutions, the advisory<br />
From 2001, all areas of specialisation<br />
required for <strong>rural</strong><br />
<strong>economy</strong> can be studied at Türi<br />
Engineering <strong>and</strong> Rural<br />
Economy School, including the<br />
profession of a horse breeder.<br />
system, agricultural schools, as well as state<br />
agencies need specialists with a higher education.<br />
The number of students in <strong>rural</strong><br />
<strong>economy</strong> vocational educational<br />
institutions could be greater<br />
School reform continues<br />
Areas of specialisation directly related to agricultural<br />
production are taught in nine vocational<br />
educational institutions.<br />
In 1997, the Estonian Chamber of Commerce<br />
<strong>and</strong> Industry in cooperation with different associations<br />
of employers/ employees, professional associations,<br />
<strong>and</strong> ministries prepared a concept aimed<br />
at developing the preparation of a competitive labour<br />
force. The professional st<strong>and</strong>ard establishing<br />
requirements for professional, social, <strong>and</strong> personality<br />
qualification was approved in 2000.<br />
The development <strong>and</strong> regular improvement of<br />
the higher education curricula <strong>and</strong> different levels<br />
of study on the basis of professional st<strong>and</strong>ards is<br />
essential for bringing the content <strong>and</strong> quality of<br />
teaching into compliance with the dem<strong>and</strong>s of the<br />
labour market <strong>and</strong> the opportunities of the enterprise<br />
environment. The basic requirements for<br />
curricula have been established.<br />
School farms are still present in four schools,<br />
but insufficient state funding does not allow for<br />
their modernisation. Considering the number of<br />
students who desire to study <strong>agriculture</strong>, it is<br />
reasonable to develop one or two practical training<br />
centres in Estonia that specialise in plant <strong>and</strong> livestock<br />
production.<br />
Educational institutions teaching <strong>rural</strong> <strong>economy</strong><br />
professions admitted 123 students in 2000;<br />
agricultural vocational educational establishments<br />
admitted 161 students in the 2000/01 academic<br />
year (the planned number was 331): 89 students in<br />
home <strong>and</strong> farm economics, 72 in <strong>agriculture</strong>, 119<br />
in horticulture, 106 in forest management, 122 in<br />
fisheries <strong>and</strong> shipping, 49 in home <strong>and</strong> cleaning<br />
services (including home economics). As a portion<br />
of the graduates from vocational educational establishments<br />
do not work in their area of specialisation,<br />
vocational education covers less than onefifth<br />
of the dem<strong>and</strong>. It is estimated that 700–750<br />
agricultural workers should<br />
be prepared to enter the job<br />
market on an annual basis. A<br />
survey carried out among<br />
agricultural producers favored<br />
the approach that practical<br />
skills should be acquired<br />
in school before entering the<br />
job market. For example,<br />
areas of specialisation relating<br />
to horticulture, fishing,<br />
20
5.<br />
forestry, <strong>and</strong> processing of agricultural products<br />
are only taught in 1 or 2 specialised educational<br />
establishments, which have practical training facilities<br />
offering sufficient preparation for work in the<br />
production sector.<br />
Complementary <strong>and</strong> conversion training form<br />
a part of vocational education in <strong>rural</strong> <strong>economy</strong>.<br />
Training is provided by vocational educational<br />
establishments, farm unions, <strong>and</strong> other interest<br />
groups. A complementary training system <strong>and</strong> a<br />
related database have been developed in the area of<br />
<strong>rural</strong> <strong>economy</strong>.<br />
Agricultural producers are in<br />
need of advice<br />
The agricultural producers' advisory system was<br />
shaped in 1996 <strong>and</strong> its development continues.<br />
In 2000, 2,021 producers used the advisory<br />
service <strong>and</strong> concluded 2,357 contracts with consultants.<br />
Seminars were held for 185 groups with a<br />
total of 5,208 participants. A total of 183 agricultural<br />
advisors have been attested since 1997.<br />
The aim of the advisory service is to assist agricultural<br />
producers by providing quality information<br />
<strong>and</strong> for communicating state information <strong>and</strong><br />
information regarding the EU.<br />
The state's role is to facilitate <strong>and</strong> finance the<br />
advisory service. The developmental goals of the<br />
advisory service are:<br />
to develop <strong>and</strong> apply measures that are beneficial<br />
for the whole society;<br />
to prepare advisors with the necessary skills.<br />
A centre coordinating the dissemination of agricultural<br />
<strong>and</strong> <strong>rural</strong> <strong>economy</strong> information (PIKK) was<br />
established in 2001 by the Ministry of Agriculture.<br />
The centre will collect <strong>and</strong> process information that<br />
is intended for <strong>rural</strong> inhabitants (including state<br />
information). Applied researchers, trainers, advisory<br />
services, a market information system, etc. will be<br />
involved in the dissemination of information. The<br />
ultimate goal of the center is that it be a useful link<br />
between the state <strong>and</strong> the <strong>rural</strong> population.<br />
From advisor to producer, from producer to<br />
advisor. The advisory service is a link between scientific<br />
research, state information, <strong>and</strong> active farmers<br />
by which the needed information reaches the farmers<br />
through advisors. Through the same capacity, the<br />
problems of farmers <strong>and</strong> <strong>rural</strong> living reach state agencies,<br />
as well as those responsible for education.<br />
Farmers have Talutark. The Estonian Farmers'<br />
Federation developed its own electronic computerbased<br />
advisory system called Talutark. Talutark<br />
regards a farm as a complete economic entity, in<br />
which natural, technical, <strong>and</strong> financial resources<br />
are used for production. The economic <strong>and</strong> natural<br />
opportunities, in consideration of the limitations of<br />
a farm can be taken into account in planning each<br />
activity. Results can be measured <strong>and</strong> economic<br />
efficiency can be assessed. Nearly one hundred<br />
farmers <strong>and</strong> other agricultural producers have<br />
begun to use Talutark programmes.<br />
Different forms of advice<br />
There are three forms of advising:<br />
Individual advising; An agricultural producer<br />
addresses an advisor directly. The state compensates<br />
for a part of the cost of advice in the form of<br />
advisory support. The sum of support as well as the<br />
producer’s share in paying the price has increased<br />
over the years. The price of advisory support per<br />
farmer was 1,980 EEK in 1996, of which the producer<br />
paid 10%. In 2000, the sum of support was<br />
5,550 EEK <strong>and</strong> the farmer's contribution depended<br />
on the cost of the advisory service: an advisory service<br />
valued at up to 3,000 EEK is a 15% cost to the<br />
farmer; an advisory service valued up to 6,000<br />
EEK is a 50% cost to the farmer. Individual advice<br />
is particularly useful to small producers; advisors<br />
have become 'family advisors' for many of them.<br />
Group advising; Group advising means special<br />
training (in plant production, livestock production,<br />
accounting, etc.) for certain groups of producers.<br />
Information days introducing one or many successful<br />
farms, in which a farmer shares his or her experience<br />
<strong>and</strong> answers questions, are popular among<br />
producers. Local farm unions are the most active<br />
organisers of group advice.<br />
Mass advising; This advisory activity is targeted<br />
at a larger interest group <strong>and</strong> advice is disseminated<br />
through typical media channels (radio, press, etc).<br />
According to a survey carried out by the Institute<br />
of Economic Research, the greatest source of information<br />
about <strong>rural</strong> life <strong>and</strong> <strong>agriculture</strong> is the newspaper<br />
Maaleht. Its web site contains an informational<br />
feature, where a visitor can obtain well-formed information<br />
regarding <strong>rural</strong> <strong>economy</strong> <strong>and</strong> related areas.<br />
The Estonian Farmers' Federation publishes the<br />
Dairy<br />
specialists<br />
graduate<br />
from Õisu<br />
Technical<br />
School<br />
21
5.<br />
administers the European Union SAPARD programme<br />
subsidies. The board is also responsible for maintaining<br />
state agricultural registers <strong>and</strong> databases <strong>and</strong><br />
for processing <strong>and</strong> analysing the register data.<br />
Rural <strong>economy</strong> specialists of county governments.<br />
They organise group advising <strong>and</strong> the<br />
financing of advisory projects <strong>and</strong> cooperate with<br />
the Ministry of Agriculture.<br />
Estonian Agricultural University<br />
farming paper Hüva Nõu, providing practical<br />
advice on animal nutrition, fertilisation of fields,<br />
production of feedstuff, etc.<br />
To assess the efficiency of advisory activities,<br />
advice surveys are carried out among agricultural<br />
producers. The advisory service is improved on the<br />
basis of the survey results. Surveys indicate that in<br />
comparison to other ways of gaining advice, the<br />
advice received by an advisor is valued the most<br />
<strong>and</strong> its price is seen as corresponding to the<br />
information received.<br />
Organisations relating to<br />
advisory activities<br />
Professional agricultural advisors have united in<br />
the Estonian Association of Agricultural Advisors.<br />
Farm unions. Professional advisors are<br />
employed by each county’s farm union. They provide<br />
advice to farmers who have received advisory<br />
support, as well as to small producers who have<br />
not received support. Advice contracts are concluded<br />
<strong>and</strong> training days are held in farm unions.<br />
Estonian Farmers' Federation. The federation<br />
provides complementary training to the chairmen<br />
of the county farm unions.<br />
Associations of agricultural producers. County<br />
associations organise training for their members,<br />
large-scale agricultural producers (private <strong>and</strong><br />
public limited companies).<br />
Jäneda Training <strong>and</strong> Advisory Centre. The<br />
centre holds courses <strong>and</strong> training days, in which<br />
nearly a thous<strong>and</strong> agricultural producers, advisors,<br />
teachers of agricultural schools, etc. participate<br />
every year. The advisory centre compiles <strong>and</strong> publishes<br />
printed materials, advisory publications, etc.<br />
Agricultural Registers <strong>and</strong> Information Board.<br />
The board provides group advising in the area of<br />
government of the Ministry of Agriculture, organises<br />
the payment of agricultural <strong>and</strong> <strong>rural</strong> support, <strong>and</strong><br />
Research concentrates in the university<br />
Transformations have also taken place on the<br />
research directions during the last ten years. The<br />
state research <strong>and</strong> development policy is implemented<br />
<strong>and</strong> organised by the Ministry of Education.<br />
The Ministry of Economic Affairs plays the<br />
main role in innovation policy. Each ministry is<br />
responsible for organising the necessary research<br />
<strong>and</strong> development <strong>and</strong> the necessary financing in<br />
their own area of government, as well as for<br />
preparing national R&D programmes.<br />
The central research institution in agricultural<br />
sciences is the Estonian Agricultural University,<br />
which a number of minor, formerly independent<br />
agricultural research institutions have joined. The<br />
Agricultural University has six faculties <strong>and</strong> seven<br />
independent institutes. The university employs 311<br />
researchers; research institutions administered by<br />
the Ministry of Agriculture employ 76 researchers<br />
(with an average age of 54 years).<br />
The research institutions in the area of<br />
administration of the Ministry of Agriculture are:<br />
Estonian Research Institute of Agriculture<br />
Teaduse 4, 75501 Saku, Estonia<br />
http://www.eria.ee/<br />
The institute studies the cultivation of agricultural<br />
crops, plant diseases, the processing <strong>and</strong> storage<br />
of crops, development <strong>and</strong> innovation, <strong>and</strong><br />
tests agricultural machines. The Agricultural<br />
Mechanisation Institute merged with the Research<br />
Institute of Agriculture in 2001.<br />
Jõgeva Plant Breeding Institute<br />
48309 Jõgeva, Estonia<br />
http://www.jpbi.ee/<br />
The institute engages in plant breeding of the<br />
main crops grown in Estonia (cereals <strong>and</strong> legumes,<br />
hay plants, potatoes, vegetables), maintenance breeding<br />
of registered varieties, the production of breeders'<br />
seed, <strong>and</strong> the preservation of genetic resources.<br />
Control Centre of Plant Production<br />
Teaduse 6, 75501 Saku, Estonia<br />
http://tmkk.ee/<br />
The Control Centre of Plant Production also<br />
participates in research <strong>and</strong> development <strong>and</strong><br />
monitoring. The centre engages in research <strong>and</strong><br />
development in the area of good agricultural practice,<br />
innovation, monitoring of the agricultural<br />
environment, administration of the network of<br />
experimental stations <strong>and</strong> laboratories.<br />
22
6.<br />
Forests are an important natural<br />
resource in Estonia<br />
Forests have been intensively used in Estonia for ages. As a result of cultivating<br />
forest l<strong>and</strong> <strong>and</strong> cutting timber, the forest area decreased to 59% in Livonia <strong>and</strong><br />
35% in Estonia by the year 1700. A more purposeful management of the forests<br />
in Estonia began in the 18 th century. The oldest preserved forest management<br />
plan dates back to 1795.<br />
23
6.<br />
27,4<br />
8,2<br />
At the beginning of the 20th century, the area of<br />
forests in Estonia was approximately one million ha, of<br />
which state forest accounted for 100,000 ha <strong>and</strong> private<br />
forest for 900,000 ha. Private forests were divided<br />
according to whether it belonged to a large owner<br />
(manors, 900,000 ha) or a small owner (farmers).<br />
When l<strong>and</strong> reform was launched at the beginning<br />
of Estonia's independence in 1920, the former manor<br />
l<strong>and</strong>s chiefly remained property of the state: the area<br />
of state forests was 900,000 ha <strong>and</strong> that of private<br />
forests was 100,000 ha. A change in ownership<br />
brought about a change in l<strong>and</strong> use. By 1940 the area<br />
of forest l<strong>and</strong> had increased to 1.4 million ha on<br />
account of farm l<strong>and</strong>s. The area of forests continued<br />
to grow during the Soviet occupation, <strong>and</strong> by the<br />
beginning of the 1990s, the area of forests amounted<br />
to 2.2 million ha. About 200,000 ha of the new forests<br />
have been planted, the rest have grown naturally.<br />
State forests have been managed for over a hundred<br />
years; private forests have only been managed in<br />
part. Despite this, both types of forests are dominated<br />
by coniferous trees, whose share is 66.9% in state<br />
forests <strong>and</strong> 53.1% in private forests.<br />
Age structure of forests is uneven; many<br />
spruce forests are ready for cutting<br />
The presently existing natural forests began to grow<br />
70–80 years ago, which is reflected in the uneven age<br />
structure of the forests. More than 60% of private<br />
Division of forest<br />
stock in private<br />
forests<br />
3,2 0,7<br />
1,8 27,7<br />
31<br />
Division of forest<br />
stockin state<br />
forests<br />
3,1 0,4<br />
28,1 47,3<br />
0,3<br />
1,4<br />
19,2<br />
pine<br />
spruce<br />
black alder<br />
grey alder<br />
birch<br />
aspen<br />
others<br />
spruce forests are older than 60 years; the area of<br />
mature spruce forests may be up to 170,000 ha. Of<br />
these, 100,000 ha with a total stock of 35 million m 3<br />
urgently need cutting.<br />
A national forestry development plan has been<br />
prepared. Estonia joined forest protection programmes<br />
in the 1990s. The Pan-European forest protection<br />
programme is the most important one for Estonia.<br />
Pursuant to the Estonian Forest Act, forestry is<br />
directed by the state through the forestry development<br />
plan. The development plan is prepared every<br />
10 years <strong>and</strong> is subject to the approval of the<br />
Riigikogu.<br />
The state trains its forestry specialists. The provision<br />
of higher education in the area of forestry<br />
began in Tartu in 1920. Forest management, forest<br />
<strong>industry</strong>, the use <strong>and</strong> protection of natural<br />
resources can be studied at the Estonian<br />
Agricultural University.<br />
Vocational education in forestry has been provided<br />
by the Luua Forestry School since 1948 <strong>and</strong> by<br />
Tihemetsa Technical School since 1995.<br />
Estonian timber <strong>industry</strong> is<br />
developing rapidly<br />
The scope of forest cutting has multiplied over the<br />
last ten years, <strong>and</strong> timber <strong>industry</strong> has developed<br />
together with it. The development of the forestry<br />
<strong>and</strong> timber <strong>industry</strong> has been facilitated by the<br />
availability of forests; an opportunity to earn from<br />
the export of raw material, large investments, a<br />
favourable customs regime, the development of<br />
enterprise, <strong>and</strong> the development of experience.<br />
Forest cutting has transferred to machine cutting; its<br />
relative share is 25–33%.<br />
Mechanical value-adding processing of timber<br />
presently dominates, but chemical value-adding<br />
would be more purposeful. Mechanical value-adding<br />
processing consists of cutting, drying of sawn timber,<br />
planing, <strong>and</strong> the manufacture of semi-finished<br />
products <strong>and</strong> various timber boards.<br />
The domestic cellulose production should be<br />
developed. Presently, the Kehra paper factory is the<br />
only paper manufacturing plant in Estonia, <strong>and</strong> uses<br />
only 5% of the suitable raw material.<br />
A significant part of timber <strong>and</strong> timber products<br />
are exported. Export of timber <strong>and</strong> timber products<br />
has increased every year <strong>and</strong> accounted for 15% of<br />
the total exports in 1997. Estonian furniture manufacturers<br />
have certain competitive advantages, owing<br />
to cheap timber, cheap labour, <strong>and</strong> the small need for<br />
capital investments due to the <strong>industry</strong> being largely<br />
based on manual labour.<br />
Furniture making accounts for 7% of the<br />
country's industrial output, <strong>and</strong> the majority of furniture<br />
made in Estonia (70%) is exported. Timber processing<br />
yields 8% <strong>and</strong> cellulose <strong>and</strong> paper production<br />
accounts for 1% of Estonia's industrial output.<br />
24
7.<br />
Fishing is an important<br />
<strong>industry</strong> for Estonia<br />
Since ancient times, fishing has been a vitally important activity for Estonians.<br />
Fisheries began to develop more rapidly in the 18 th century when dem<strong>and</strong> for<br />
Tallinn sprats increased on the Russian market. There were about 40 sprat<br />
processing enterprises in Estonia prior to WWI; their total output was 7 million<br />
cans of sprats per year.<br />
25
7.<br />
Estonia has 40 fishing ports<br />
In 1999, 83,000 tonnes of fish were caught in the<br />
Baltic Sea <strong>and</strong> 3,900 tonnes were caught in inl<strong>and</strong><br />
water bodies, in addition to this, 37,400 tonnes<br />
were caught in deep sea fishing. Estonia has 40<br />
fishing ports; the fishing fleet consists of 258 ships,<br />
including 23 in deep sea fishing. According to the<br />
data of the Veterinary <strong>and</strong> Food Board, 107 enterprises<br />
operate in Estonia in the field of fish processing<br />
<strong>and</strong> production of fish meat products.<br />
Twenty-seven enterprises <strong>and</strong> 13 cold-storage ships<br />
have been approved by the European Union.<br />
The fish <strong>industry</strong> employed 4,200 persons in<br />
2001, which accounted for 5% of all people working<br />
in the processing <strong>industry</strong>.<br />
Of the fish caught <strong>and</strong> fish products made,<br />
90% is exported, including 34% to European<br />
Union countries.<br />
The main products are canned fish <strong>and</strong> fish preserves.<br />
In the first half of 2001, companies<br />
belonging to the Estonian Fishing Association produced<br />
33,063.4 tonnes of fish <strong>food</strong> products.<br />
Canned fish <strong>and</strong> fish preserves accounted for the<br />
majority of these. Smoked sprats in oil <strong>and</strong> fish in<br />
tomato sauce were the most common canned fish<br />
products (Figure 1).<br />
Export <strong>and</strong> import of fish <strong>and</strong><br />
fish products<br />
In terms of quantity, the greatest export article is<br />
frozen fish, but in monetary terms, canned fish<br />
takes first place. Cans are exported mainly to the<br />
eastern market <strong>and</strong> CEEC markets. Filleted fish is<br />
exported to the western markets (Table 1).<br />
There are 25 operating fish farms. At present,<br />
25 professional fish farms whose main income is<br />
derived from fish operate in Estonia. Rainbow<br />
FIGURE 1.<br />
Cans <strong>and</strong> preserves 63%<br />
Other products 24%<br />
TABLE 2.<br />
Production of fish products in 2001 (%)<br />
297<br />
43<br />
340<br />
Fish farming production (t)<br />
Species 1993 1994 1995 1996 1997 1998 1999 2000<br />
Salmon<br />
trout<br />
Carp<br />
Total<br />
278<br />
136<br />
414<br />
278<br />
30<br />
308<br />
194<br />
61<br />
355<br />
227<br />
trout farms take the fist place (12 farms), followed<br />
by carp farms, <strong>and</strong> a few farms produce population<br />
material for the restoration of fish resources. Three<br />
or four crayfish farms being established, <strong>and</strong> there<br />
is one eel farm.<br />
Besides these numbers, there is a large number<br />
(approximately 100) small fish farmers, each of<br />
which produces a few hundred kilograms of fish a<br />
year.<br />
Seven species of fish (salmon, salmon trout,<br />
brown trout, whitefish, pike, pike perch, tench)<br />
<strong>and</strong> crayfish were bred for the restoration of fish<br />
resources, which activity is financed from sums<br />
received for the sale of fishing rights (Table 2).<br />
28<br />
255<br />
Filleted fish 5%<br />
285<br />
23<br />
312<br />
Breaded<br />
products<br />
4%<br />
Surimi<br />
products<br />
4%<br />
147<br />
30<br />
177<br />
* Data of Fisheries Department of the Ministry of the Environment<br />
313<br />
47<br />
360<br />
TABLE 1.<br />
HS<br />
code<br />
0301<br />
0302<br />
0303<br />
0304<br />
0305<br />
0306<br />
0307<br />
1604<br />
1605<br />
Export of fish <strong>and</strong> fish products, exclusive of customs warehouses, <strong>and</strong><br />
import for free circulation on the domestic market in January–June 2001<br />
export<br />
import<br />
Product group<br />
Live fish<br />
Cooled fish<br />
Frozen fish<br />
Fish fillets<br />
Dried,<br />
salted, <strong>and</strong><br />
smoked<br />
fish<br />
Crustaceans<br />
Molluscs<br />
Canned fish<br />
Canned<br />
crustaceans<br />
Unit<br />
T<br />
T<br />
T<br />
T<br />
T<br />
T<br />
T<br />
T<br />
T<br />
Quantity<br />
0,1<br />
806,9<br />
37117,9<br />
2651,4<br />
19786,4<br />
186,4<br />
5,4<br />
23306,9<br />
56,0<br />
Amount<br />
(EEK '000)<br />
17,2<br />
41387,2<br />
122331,8<br />
247906,1<br />
100174,3<br />
5760,8<br />
128,7<br />
492472,0<br />
7726,2<br />
Unit price<br />
(EEK '000)<br />
118587<br />
51289<br />
3296<br />
93501<br />
5063<br />
30905<br />
24020<br />
21130<br />
137861<br />
Quantity<br />
6,6<br />
10154,2<br />
10377,0<br />
2010,9<br />
104,2<br />
255,7<br />
10,7<br />
1066,2<br />
34,0<br />
Amount<br />
(EEK '000)<br />
1541,5<br />
74701,2<br />
68298,5<br />
59899,5<br />
4349,1<br />
12273,1<br />
698,3<br />
24127,1<br />
2713,0<br />
Unit price<br />
(EEK '000)<br />
232835<br />
7357<br />
6582<br />
29787<br />
41722<br />
47996<br />
65423<br />
22629<br />
79608<br />
Trade Bureau of the Ministry of Agriculture<br />
26
8.<br />
Food <strong>industry</strong> yields a quarter<br />
of the total industrial output<br />
The <strong>food</strong> <strong>industry</strong> yields 25% of Estonian industrial output <strong>and</strong> employs nearly<br />
20% of all people working in the processing <strong>industry</strong>. Food <strong>industry</strong> accounts for<br />
about 3% of the gross domestic product <strong>and</strong> 5% of total export.<br />
27
8.<br />
Dairy <strong>industry</strong> is the largest<br />
Dairy <strong>industry</strong> accounted for 28%, the meat<br />
<strong>industry</strong> 15.8%, the fish <strong>industry</strong> 15.3%, the<br />
beverage <strong>industry</strong> 21.5%, flour <strong>and</strong> cereals production<br />
0.7% <strong>and</strong> bread <strong>and</strong> baker's wares 8.7% of<br />
the total <strong>food</strong> <strong>industry</strong> in 2000.<br />
Investments<br />
The <strong>food</strong> <strong>industry</strong> has made substantial investments<br />
in the improvement of processing conditions <strong>and</strong><br />
production efficiency in the recent years. Great<br />
attention is now being paid to the health of the consumer<br />
<strong>and</strong> the related improvement of <strong>food</strong> safety.<br />
About 300 million EEK was invested in the<br />
non-current assets of the <strong>food</strong> <strong>industry</strong> in 2000. As<br />
from 1 January 2003 the Food Act will enter into<br />
force in full <strong>and</strong> this implies that <strong>food</strong> h<strong>and</strong>lers<br />
continue to be required to make great investments<br />
in <strong>food</strong> safety assurances. Enterprises have to invest<br />
mainly in order to comply with the general <strong>and</strong><br />
special requirements of <strong>food</strong> safety. General<br />
requirements include requirements for production<br />
buildings, facilities, walls, ceilings, floors, <strong>and</strong> the<br />
dressing rooms of employees. Special regulations<br />
cover the requirements for equipment <strong>and</strong> means<br />
of h<strong>and</strong>ling.<br />
Investments made in compliance with special<br />
requirements so far show that enterprises do pay<br />
the necessary attention to product safety as well as<br />
product quality.<br />
When compared to other areas of agricultural<br />
production, relatively greater foreign investments<br />
have been made in the <strong>food</strong> <strong>industry</strong>. The main<br />
investments in 2000 were made in the dairy<br />
<strong>industry</strong>. Foreign investments in beer, meat, <strong>and</strong><br />
bread production have already been made in<br />
previous years. The fish <strong>industry</strong> has proved to be<br />
less attractive for foreign investors.<br />
TABLE 1.<br />
Millions of kroons, % 1994 1995 1996 1997 1998 1999 2000<br />
Total <strong>food</strong> <strong>industry</strong> output<br />
(millions of kroons)<br />
6 513 7 554 8 534 10 903 10 802 8 433 8727<br />
Meat <strong>and</strong> meat products<br />
Fish <strong>and</strong> fish products<br />
Milk products<br />
Flour <strong>and</strong> cereals<br />
Ready-made feedstuff<br />
Baker's wares<br />
Beverages<br />
1 382<br />
627<br />
1 195<br />
51<br />
363<br />
507<br />
890<br />
1 221<br />
1 156<br />
1 368<br />
62<br />
361<br />
606<br />
1 091<br />
1 241<br />
1 039<br />
1 883<br />
79<br />
292<br />
756<br />
1 54<br />
1 237<br />
1 492<br />
2 260<br />
91<br />
246<br />
929<br />
1 566<br />
1 454<br />
2 055<br />
2 983<br />
87<br />
351<br />
984<br />
1 806<br />
1 533<br />
1 938<br />
3 022<br />
103<br />
412<br />
995<br />
1 721<br />
1380<br />
1349<br />
2435<br />
58<br />
299<br />
759<br />
1874<br />
Employment in the <strong>food</strong> <strong>industry</strong> (% of total<br />
employment in the processing <strong>industry</strong>)<br />
23.8<br />
24.6<br />
23.7<br />
24.4<br />
24.5<br />
21.5<br />
19,9<br />
Export of <strong>food</strong> <strong>industry</strong> (millions of kroons)<br />
Relative share in total export (%)<br />
2 028<br />
12.3<br />
1 496<br />
7.1<br />
1 977<br />
7.9<br />
3 543<br />
8.7<br />
3 735<br />
8.2<br />
2 417<br />
5.6<br />
2392<br />
4.4<br />
28
8.<br />
Concentration<br />
The concentration of enterprises varies across<br />
branches of the <strong>food</strong> <strong>industry</strong>. The most concentrated<br />
is the beer <strong>industry</strong>, where the four major<br />
breweries account for 97% of total sales. The meat<br />
<strong>industry</strong> is also fairly concentrated: the four major<br />
industries yield 80% of total sales. The milk<br />
<strong>industry</strong> is so far less concentrated: four major<br />
enterprises only account for 40% of the total sales<br />
of this branch of <strong>industry</strong>.<br />
Concentration can be expected to increase in<br />
the fish, meat, <strong>and</strong> milk industries in the forthcoming<br />
years. One of the reasons for this is the<br />
stricter <strong>food</strong> safety requirements: smaller industries<br />
are not able to make the necessary investments to<br />
comply with these requirements. On the other<br />
h<strong>and</strong>, competition between enterprises toughens<br />
both in regard to finding markets <strong>and</strong> market<br />
penetration. As major enterprises prove to be<br />
stronger in competition, smaller industries should<br />
merge with large-scale industries.<br />
Best Estonian Food competition<br />
The Best Estonian Food competition has been held<br />
annually since 1994, its initiator <strong>and</strong> organiser is<br />
the Estonian Association of Food Industries. The<br />
goal of the competition is to encourage entrepreneurs<br />
to develop new products <strong>and</strong> improve product<br />
quality. The competition is also a channel for<br />
introducing products to consumers <strong>and</strong> trade enterprises<br />
<strong>and</strong> to shape a positive attitude <strong>and</strong> trust<br />
toward domestic <strong>food</strong> <strong>and</strong> the <strong>food</strong> <strong>industry</strong>.<br />
A total of 627 products from 91 enterprises<br />
have participated in the seven competitions held so<br />
far. Since 1999, export potential has been assessed<br />
alongside the novelty <strong>and</strong> healthiness of the competing<br />
products. Eighty-seven products from 24<br />
enterprises participated in the competition in 2000;<br />
27 products were assessed as being suitable for<br />
export.<br />
The packages of products that have won the<br />
competition bear a special label, which has been<br />
granted to 97 products so far. Milk products have<br />
won the Best Estonian Food competition the greatest<br />
number of times. According to the data of the<br />
Estonian Institute of Economic Research, 55% of<br />
buyers are familiar with the Best Estonian Food<br />
mark.<br />
Meat processing concentrates in<br />
large-scale enterprises<br />
There are presently many small meat processing<br />
enterprises in Estonia. As it is difficult for small<br />
enterprises to comply with <strong>food</strong> safety requirements,<br />
the meat <strong>industry</strong> is concentrating <strong>and</strong><br />
undergoing structural changes. As a result of this<br />
process, up to 30% of the presently more than two<br />
FIGURE 1.<br />
40%<br />
30%<br />
20%<br />
10%<br />
0%<br />
FIGURE 2.<br />
30%<br />
25%<br />
20%<br />
15%<br />
10%<br />
5%<br />
0%<br />
Share of <strong>food</strong> <strong>industry</strong> in industrial output<br />
37,7%<br />
31,6% 32,8%<br />
28,9%<br />
27,2% 26,9%33,4%<br />
27,8%<br />
25,1%<br />
1992 1993 1994 1995 1996 1997 1998 1999 2000<br />
Milk<br />
Structure of <strong>food</strong> <strong>industry</strong> sectors in<br />
the <strong>food</strong> <strong>industry</strong> total output<br />
Beverages<br />
Meat<br />
Fish<br />
Bread <strong>and</strong><br />
baker’s wares<br />
1999<br />
2000<br />
Other<br />
29
8.<br />
hundred meat enterprises are likely to survive.<br />
In 2001, there were no meat processing enterprises<br />
in Estonia fully complying with <strong>food</strong> safety<br />
requirements, but the four major enterprises had<br />
already complied with 90% of the requirements<br />
applicable in the European Union. According to<br />
the assessments of entrepreneurs themselves,<br />
investment needs are the greatest for taking the<br />
slaughter <strong>industry</strong> into compliance with <strong>food</strong><br />
safety requirements. Investments will significantly<br />
decrease as the meat <strong>industry</strong> concentrates <strong>and</strong><br />
specialises.<br />
Large-scale enterprises already<br />
dominate in the milk <strong>industry</strong><br />
There are presently 48 milk enterprises in Estonia,<br />
including 21 high-capacity <strong>and</strong> 17 low-capacity<br />
enterprises. Eleven of them have been approved by<br />
the European Union as fully conforming to the EU<br />
requirements.<br />
Milk industries bought 408,700 tonnes of<br />
milk in 2000, which is 3.5% more than in 1999.<br />
The bulk of it, 82%, was purchased by 8 enterprises.<br />
Of the milk purchased from producers in 2000,<br />
83% was elite or high grade milk, fully conforming<br />
to <strong>food</strong> safety requirements. First grade milk<br />
accounted for 15%. The average fat content of<br />
milk was 3.9%. The quality of raw milk has<br />
consistently improved.<br />
The portion of milk not sold to the <strong>industry</strong> is<br />
used by dairy farmers as animal feed or for selling<br />
on the market (Figure 3).<br />
Export to the European Union<br />
As of 2001, the following milk enterprises were<br />
certified as conforming to <strong>food</strong> safety requirements<br />
<strong>and</strong> acquired the right to export their products to<br />
the European Union: AS Tapila Laeva Meierei, AS<br />
Põlva Piim, AS Rapla Dairy, TÜ E-Piim Põltsamaa<br />
<strong>and</strong> Järva-Jaani dairies, AS Võru Juust, AS Rakvere<br />
Piim Annikvere Department, AS Saaremaa Liha- ja<br />
Piimatööstus, Tori-Selja Piimaühistu, Tallinn<br />
Piimatööstuse AS, <strong>and</strong> Tallinna Külmhoone AS Ice<br />
Cream Factory.<br />
Considering the investments made, the utilisation<br />
of processing capacities, <strong>and</strong> the division of the<br />
raw milk market between enterprises, the majority<br />
of the needed investments have been made. Investments<br />
will continue in improving production efficiency,<br />
modernising by-processes, <strong>and</strong> complying<br />
with environmental requirements (Figure 4).<br />
FIGURE 3.<br />
FIGURE 4.<br />
Raw milk quality<br />
Distribution of raw milk between milk products<br />
100%<br />
90%<br />
80%<br />
70%<br />
60%<br />
50%<br />
40%<br />
30%<br />
20%<br />
10%<br />
0%<br />
43%<br />
41%<br />
1995<br />
Elite or high grade First grade<br />
17% 14%<br />
27% 23%<br />
32%<br />
79% 83%<br />
67% 71%<br />
58%<br />
1996 1997 1998 1999 2000<br />
Full milk products<br />
31%<br />
Pasteurised<br />
milk<br />
9%<br />
Other (powders, ice<br />
cream, canned milk)<br />
10%<br />
Butter 36%<br />
Cheese<br />
14%<br />
30
9.<br />
Measures taken to<br />
assure <strong>food</strong> safety<br />
The harmonisation of the Estonian Food Act <strong>and</strong> the <strong>food</strong> safety requirements<br />
that are applicable in the European Union, <strong>and</strong> its subsequent passing by the<br />
Riigikogu resulted in the reorganisation of the work of supervisory agencies dealing<br />
with <strong>food</strong> safety, <strong>and</strong> the adoption of new regulations <strong>and</strong> acts.<br />
31
9.<br />
According to the plan for<br />
the reorganisation of the<br />
supervisory agencies that<br />
was prepared by the committee<br />
set up at the Ministry<br />
of Agriculture, the Veterinary<br />
<strong>and</strong> Food Board supervises<br />
1,340 <strong>food</strong> h<strong>and</strong>ling<br />
enterprises, including<br />
826 enterprises h<strong>and</strong>ling<br />
non-<strong>food</strong> products, which<br />
have been transferred from<br />
the area of supervision of<br />
the Health Protection<br />
Inspectorate.<br />
Control samples taken in the course of supervision<br />
are analysed in laboratories authorised for<br />
that purpose.<br />
Seventeen laboratories hold the rights of authorised<br />
laboratories, which perform all the necessary<br />
control analyses of <strong>food</strong>stuffs: from determining<br />
<strong>food</strong> ingredients <strong>and</strong> nutritional value to testing for<br />
the presence of pathogenic micro-organisms.<br />
The authorising of laboratories ensures the<br />
objectivity of supervision <strong>and</strong> that analysis results<br />
can be compared with the respective indicators of<br />
other countries.<br />
The Estonian phytosanitary supervisory organisation<br />
was restructured in 1998 <strong>and</strong> two independent<br />
institutions were established: the Plant<br />
Protection Inspectorate (PPI) <strong>and</strong> the Control<br />
Centre of Plant Production (CCPP).<br />
The laboratories of the CCPP are supplied with<br />
modern equipment <strong>and</strong> testing methods conforming<br />
to the European Union requirements. Training of<br />
the personnel continues.<br />
The CCPP is comprised of the following units:<br />
Seed control laboratory, accredited by the Seed<br />
Testing Association at the end of 2000 <strong>and</strong><br />
conforming to the EU requirements;<br />
Cereals <strong>and</strong> plant production laboratory,<br />
analysing the quality of concentrated fodder, raw<br />
material of feedstuffs, cereals, cereal products, oil<br />
crops, vegetables, <strong>and</strong> potatoes;<br />
Contaminants <strong>and</strong> residues laboratory, analysing<br />
pesticide agents, pesticide residues, mycotoxins,<br />
trace elements <strong>and</strong> toxic elements in plant products;<br />
the laboratory participates in pesticide residues <strong>and</strong><br />
mycotoxins monitoring programmes;<br />
Agrochemistry laboratory, performing chemical<br />
<strong>and</strong> technical analyses of mineral <strong>and</strong> organic<br />
fertilisers, growth substrates <strong>and</strong> field soils;<br />
Plant health control laboratory, performing<br />
analyses for identifying plant diseases <strong>and</strong> pests<br />
subject to quarantine;<br />
Vilj<strong>and</strong>i Variety Protection Centre with experimental<br />
stations in Saku, Võru, <strong>and</strong> Tori. The<br />
Variety Protection Centre acts in compliance with<br />
OECD <strong>and</strong> UPOV requirements.<br />
Estonia was free from dangerous animal diseases<br />
in 2000.<br />
Estonia was free from infectious animal diseases<br />
designated as especially dangerous – the A-list<br />
diseases.<br />
Bovine herds were free from foot <strong>and</strong> mouth<br />
disease, BSE, tuberculosis <strong>and</strong> brucellosis. There<br />
were single cases of enzootic bovine leucosis, which<br />
did not affect the general leucosis-free status of<br />
herds. The national disease prevention programme<br />
for ensuring the disease-free status of bovines in<br />
artificial insemination continued.<br />
Pig herds were free from foot <strong>and</strong> mouth<br />
disease, classical swine fever, brucellosis <strong>and</strong> other<br />
dangerous diseases.<br />
Sheep <strong>and</strong> goat herds were free from brucellosis<br />
<strong>and</strong> other dangerous diseases. Maedi-Visna antibodies<br />
were detected in 277 sheep (of the 1,288 sheep<br />
studied). The disease was not clinically diagnosed.<br />
Poultry flocks were free from fowl plague <strong>and</strong><br />
Newcastle disease.<br />
Rabies was detected in 130 animals, chiefly wild<br />
animals (the number of domestic <strong>and</strong> farm animals<br />
was 36).<br />
Due to the disease-free status, no damages<br />
occurred <strong>and</strong> no restrictions were imposed on trade<br />
in animals due to diseases.<br />
A framework of disease prevention measures<br />
was established by the Infectious Animal Disease<br />
Control Act <strong>and</strong> the necessary infectious animal<br />
disease legislation was entered into force in 2000.<br />
In 2000, the Border Service of the Veterinary<br />
<strong>and</strong> Food Service detained 744 shipments of goods<br />
at border inspection posts in the course of supervision.<br />
The main reason for detention was the noncompliance<br />
of the accompanying documents of the<br />
goods to the applicable requirements. Meat <strong>and</strong><br />
meat products <strong>and</strong> fish <strong>and</strong> fish products were the<br />
main products being detained; 4,077 tonnes of<br />
goods were returned to the country of origin due to<br />
non-compliance of the goods or the accompanying<br />
documents to requirements, as well as non-compliance<br />
with transportation requirements. In terms of<br />
volume, more than a half of the returned goods<br />
originated in Russia.<br />
32
10.<br />
Rural enterprise is developing<br />
Many small producers of grains or livestock products are not able to modernise<br />
production, are therefore not competitive, <strong>and</strong> will be forced to close down<br />
production operations <strong>and</strong> seek other forms of <strong>rural</strong> enterprise.<br />
33
10.<br />
TABLE 1.<br />
Form of enterprise<br />
Agricultural, hunting, <strong>and</strong> forestry undertakings by legal<br />
form in 1996–2001 (as of 1 July)<br />
1996 1997 1998 1999 2000<br />
2001<br />
Private enterprises<br />
State-owned enterprises<br />
Municipal enterprises<br />
Co-operative associations<br />
General <strong>and</strong> limited partnerships<br />
Private limited companies<br />
Public limited companies<br />
Commercial associations<br />
Sole proprietors<br />
52<br />
15<br />
3<br />
664<br />
34<br />
418<br />
1 344<br />
-<br />
-<br />
42<br />
15<br />
2<br />
579<br />
29<br />
301<br />
1 158<br />
-<br />
-<br />
34<br />
10<br />
2<br />
439<br />
17<br />
169<br />
755<br />
-<br />
-<br />
-<br />
-<br />
-<br />
-<br />
25<br />
1 674<br />
292<br />
225<br />
6 497<br />
-<br />
-<br />
-<br />
-<br />
24<br />
1 796<br />
265<br />
234<br />
9 391<br />
-<br />
-<br />
-<br />
-<br />
28<br />
1776<br />
240<br />
232<br />
10259<br />
Other enterprises<br />
TOTAL<br />
56<br />
2 586<br />
43<br />
2 169<br />
20<br />
1 446<br />
1<br />
8 714<br />
1<br />
11 711<br />
1<br />
12536<br />
Source: enterprise register <strong>and</strong> commercial register data<br />
According to the data of the central commercial<br />
register, 12,536 registered undertakings operated<br />
in the area of <strong>agriculture</strong>, hunting, <strong>and</strong> forestry in<br />
Estonia in 2001. The bulk of them were sole<br />
proprietors (10,259), private limited companies<br />
(1,776), <strong>and</strong> public limited companies <strong>and</strong> commercial<br />
associations (472). The number of operators<br />
in <strong>agriculture</strong> is decreasing, while the number<br />
of those engaging in non-agricultural activities is<br />
increasing (Tables 1 <strong>and</strong> 2).<br />
On the order of the Ministry of Agriculture, the<br />
Institute for Rural Development conducted a<br />
survey of non-agricultural enterprise in Tartu <strong>and</strong><br />
Jõgeva counties in 2000. Wholesale <strong>and</strong> intermediation<br />
trade turned out to be the prevailing new<br />
activities (12.5% of undertakings), followed by<br />
retail sales <strong>and</strong> repair of commodities <strong>and</strong> home<br />
appliances (11.9%), timber processing (9.3%),<br />
building (6.9%), <strong>and</strong> guest house services <strong>and</strong><br />
catering (4.9%).<br />
Despite economic difficulties, <strong>rural</strong> entrepreneurs<br />
are optimistic <strong>and</strong> eager to act. The survey<br />
showed that they expected a more favourable taxation<br />
policy, more enterprise-friendly legislation,<br />
subsidies encouraging enterprise, <strong>and</strong> favourable<br />
loan terms from the state.<br />
In November 1998 the EU pre-accession pilot<br />
project (SPP) was launched, aimed at supporting<br />
the financing of specific investment projects such as<br />
development of non-traditional <strong>agriculture</strong>, reprocessing<br />
of agricultural products by producers themselves,<br />
<strong>and</strong> the launching or development of <strong>rural</strong><br />
tourism. The greatest number of investments was<br />
made in <strong>rural</strong> tourism, production of berries, flax,<br />
aromatic <strong>and</strong> medicinal herbs, rapeseed, as well as<br />
in the agricultural processing <strong>industry</strong>.<br />
It is characteristic that in finding new activities,<br />
the <strong>rural</strong> population itself shows greater initiative<br />
than local governments do. A nation-wide network<br />
of tourism farms has been formed on farmers’ own<br />
initiative. The production of original furniture, log<br />
cabins, consumables for machinery, <strong>and</strong> forged iron<br />
products has been launched; other activities include<br />
local marble <strong>and</strong> limestone processing for building<br />
elements, pheasant, ostrich <strong>and</strong> wild animal farming<br />
in farm zoos, growing of aromatic herbs, hunting<br />
tourism, beekeeping, organising of river canoe trips,<br />
mushroom production, making of musical instru-<br />
TABLE 2.<br />
Agricultural, hunting, forestry, <strong>and</strong> fishing associations <strong>and</strong> companies<br />
in 1996–2001 (as of 1 July)<br />
Form of enterprise<br />
1996 1997 1998 1999 2000<br />
2001<br />
Cooperative associations<br />
Commercial associations<br />
Private limited companies<br />
Public limited companies<br />
General <strong>and</strong> limited partnerships<br />
TOTAL<br />
735<br />
-<br />
427<br />
1 544<br />
34<br />
2 740<br />
636<br />
-<br />
306<br />
1 310<br />
29<br />
2 281<br />
473<br />
-<br />
172<br />
857<br />
17<br />
1 519<br />
-<br />
244<br />
1 843<br />
342<br />
33<br />
2 120<br />
-<br />
253<br />
1 964<br />
313<br />
32<br />
2 562<br />
-<br />
250<br />
1914<br />
276<br />
36<br />
2476<br />
Source: enterprise register <strong>and</strong> commercial register data<br />
34
10.<br />
ments, development of alternative energy, glass<br />
making <strong>and</strong> fur animal keeping. Women have<br />
founded h<strong>and</strong>icraft societies making various<br />
h<strong>and</strong>icraft products <strong>and</strong> marketing them to tourists.<br />
Dairy associations are popular<br />
The most active associations are dairy associations,<br />
which have taken over about one-fourth of the<br />
total purchasing of raw milk <strong>and</strong> can pay their<br />
members higher prices for milk than large dairy<br />
processors can.<br />
The best-known commercial association is<br />
E-Piim, which was able to invest 20 million EEK in<br />
the Põltsamaa cheese <strong>industry</strong> in 1999 for the<br />
acquisition of modern equipment. The association<br />
received a 16 million EEK loan from the German<br />
state investment fund. E-Piim is owned by 325 milk<br />
producers.<br />
In total, there were 88 applicants for cooperative<br />
economic activity support in 2000, which represented<br />
108 projects with an aggregate budget of<br />
80.4 million EEK. Support was granted to 42 projects.<br />
Seven projects were concerned with cooperative<br />
trade, purchasing, <strong>and</strong> sales networks <strong>and</strong><br />
operative market information; six projects were<br />
related to cooperative milk processing, six concerned<br />
horticulture, apiculture <strong>and</strong> berry production,<br />
five were related to the production <strong>and</strong> primary<br />
processing of grains <strong>and</strong> potatoes, <strong>and</strong> four<br />
were concerned with machinery associations.<br />
Examples of enterprise<br />
Fur animal farming. The farming of valuable fur<br />
animals in Estonia began in 1925 when the first<br />
four pairs of silver foxes were brought from<br />
Canada. By the end of Estonia’s first period of<br />
independence, there were 60 fur animal farms in<br />
Estonia with 10,000 animals.<br />
During the Soviet period, large scale fur animal<br />
farming continued <strong>and</strong> by 1992 there were 12 major<br />
fur animal enterprises producing 38,000 silver<br />
fox pelts, 76,000 blue fox pelts, <strong>and</strong> 187,000 mink<br />
pelts a year. In addition to fox <strong>and</strong> mink, many<br />
farmers raised nutrias on their home farms <strong>and</strong> sold<br />
their pelts at the market.<br />
At the beginning of the 1990s, fur animal<br />
farming started to decrease, the trend of which has<br />
only recently begun to reverse. Other fur animal<br />
breeds raised in European countries, which yield<br />
quality fur that can be marketed on international<br />
auctions, have been introduced to Estonian fur animal<br />
farms. In 2001 there were more than 10,000 silver<br />
foxes <strong>and</strong> more than 46,000 blue foxes in<br />
Estonia’s five major fur animal farms that belong to<br />
the Fur Animal Breeders Association. Additionally,<br />
there are more than 32,000 minks on one farm.<br />
Several farms raise fur animals on a smaller scale. As<br />
fur prices have gone up in the recent years, furs have<br />
become one of the most successful agricultural<br />
export articles.<br />
A new developing trend in Estonia is chinchilla<br />
farming. The fur of this animal is highly valuable, but<br />
farming requires great care <strong>and</strong> strict compliance<br />
with requirements. Investments pay back after ¾ of<br />
35
10.<br />
a year. More than 100 chinchilla farms have emerged<br />
in Estonia <strong>and</strong> the first lots of furs have been<br />
sold through the international Copenhagen auction<br />
centre. The farmers of this fur animal breed have<br />
formed the Estonian Chinchilla Breeders Association<br />
<strong>and</strong> the Estonian Chinchilla Breeders Union.<br />
Fishing tourism<br />
Estonian fish farmers discovered a new way of selling<br />
domestic fish in the form of fishing tourism. The<br />
non-profit association Estonian Fishing Tourism<br />
that was founded more than three years ago now<br />
unites 86 fish farmers. Dem<strong>and</strong> for the service exists,<br />
as natural water bodies have lost a lot of their fish<br />
resources due to over fishing <strong>and</strong> pollution.<br />
There are three types of fishing facilities in<br />
Estonia at present: First, there are fish farms, which<br />
exclusively engage in fishing tourism of mainly<br />
trout fishing from ponds. They are usually situated<br />
in accessible areas; secondly, former Soviet fish<br />
farms, which engage in both fishing tourism as well<br />
as the breeding of young fish for sale to other<br />
tourism farms; thirdly, fishing tourism farms,<br />
which also provide accommodation services <strong>and</strong><br />
grilling or smoking of fish caught on the spot. The<br />
number of such farms is the largest in southern<br />
Estonia, where fishing tourism farms are located in<br />
naturally scenic places. Crayfish farming has also<br />
begun <strong>and</strong> crayfish catching will be available to<br />
tourists on tourism farms in the forthcoming years.<br />
Mushroom farming<br />
Mushrooms are becoming an increasingly popular<br />
<strong>food</strong>. They are not only eaten during the autumn<br />
period of mushroom picking. In countries like<br />
China, Japan, <strong>and</strong> Korea, fresh <strong>and</strong> dried mushrooms<br />
have been used since ancient times. They<br />
are also used to produce powder, tablets, <strong>and</strong> tea.<br />
The therapeutic qualities of mushrooms are well<br />
known <strong>and</strong> have been used for medicinal purposes<br />
for more than a thous<strong>and</strong> years in China.<br />
China’s mushroom output in 1988 was more than<br />
4 million tonnes.<br />
In Estonia like in other European countries, the<br />
first mushrooms that were commercially produced<br />
on farms were meadow mushrooms. During the last<br />
decade, the farming of oyster mushrooms as valuable<br />
<strong>food</strong> mushrooms has complemented meadow<br />
mushroom farming. Oyster mushrooms are popular<br />
because plant production <strong>and</strong> timber <strong>industry</strong> waste<br />
can be utilised as a growth substance. For example,<br />
two young agronomists established a mushroom<br />
farm in a livestock barn that was built in the Lääne-<br />
Viru County during the Soviet period, <strong>and</strong> use chaff<br />
as the growth substance for oyster mushrooms. The<br />
farm intends to increase its oyster mushroom output<br />
to 50 tonnes a year. The mushrooms are chiefly sold<br />
to the major <strong>food</strong> stores of Tallinn, as well as to<br />
restaurants. The young farmers Diana <strong>and</strong> Arno<br />
Pärna also founded the first association of mushroom<br />
farmers, the commercial association Eesti<br />
Seen, which other major mushroom farmers have<br />
also joined.<br />
Research is currently being conducted in order<br />
to start growing another more valuable <strong>food</strong> mushroom,<br />
shiitake, <strong>and</strong> plans have been made to start<br />
cultivating other more rare medicinal mushrooms<br />
in Estonia, thus following the example of other<br />
countries. Estonia has research staff who can advise<br />
mushroom farmers, as well as sufficient resources<br />
of growth substances <strong>and</strong> unused buildings that are<br />
suitable for mushroom growing.<br />
36
11.<br />
Different l<strong>and</strong>scape types have<br />
been preserved in Estonia<br />
As about one-half of the Estonian territory is forests, nearly a quarter is covered by bogs, there are<br />
many lakes <strong>and</strong> watercourses <strong>and</strong> arable l<strong>and</strong> forms a third of the territory, a number of different<br />
l<strong>and</strong>scape types have formed as a result. A relatively late switch to intensive l<strong>and</strong> use <strong>and</strong> the prevalence<br />
of manual labour in <strong>agriculture</strong> until the last quarter of the previous century have contributed<br />
to their preservation. Although extensive l<strong>and</strong> improvement was carried out during the Soviet period<br />
<strong>and</strong> attempts were made to drain marshes <strong>and</strong> bogs, large areas of wetl<strong>and</strong>s, wetl<strong>and</strong> woods,<br />
meadows covered with scattered trees, <strong>and</strong> other l<strong>and</strong>scape types have still survived. This is why one<br />
can find l<strong>and</strong>scape types in Estonia that no longer exist in other European countries.<br />
37
11.<br />
Rich biodiversity<br />
When compared to other regions of the same latitude,<br />
Estonia's flora <strong>and</strong> fauna are one of the<br />
world's richest in species. In Estonia there are nearly<br />
5,000 plant species <strong>and</strong> 3,500 species of mushrooms<br />
<strong>and</strong> fungi, 11,000 species of invertebrates,<br />
<strong>and</strong> 500 species of vertebrates. Besides other factors,<br />
the great biodiversity owes to the great percentage<br />
of natural l<strong>and</strong>scapes <strong>and</strong> the survival of<br />
traditional l<strong>and</strong> usage, as well as the preservation of<br />
semi-natural communities. There are often more<br />
than 50 plant species to be found within a single<br />
square metre of a meadow that is covered with<br />
scattered trees (puisniit).These areas are one of the<br />
semi-natural communities. The plant community<br />
richest in species is the Vahenurme puisniit in<br />
Pärnu County, where 74 plant species have been<br />
counted in a single square metre. Such areas are<br />
home for a large number of different insects <strong>and</strong><br />
snails <strong>and</strong> they are a stopping <strong>and</strong> resting place for<br />
migrant birds.<br />
The impact of human activities on the formation<br />
of semi-natural communities is significant. The<br />
appearance <strong>and</strong> values of such communities have<br />
come to be, <strong>and</strong> have survived, owing to the<br />
Estonians' sustainable use of nature. Other seminatural<br />
communities in Estonia include limestone<br />
terrains; coastal, valley flat, <strong>and</strong> marshy meadows;<br />
<strong>and</strong> pastures covered with scattered trees.<br />
Estonia endeavours to protect<br />
natural diversity<br />
While the diversity of Estonian l<strong>and</strong>scapes was<br />
threatened during the Soviet period by intensive<br />
l<strong>and</strong> improvement <strong>and</strong> <strong>agriculture</strong>, <strong>and</strong> the resulting<br />
pollution, now a new danger has emerged: The<br />
danger lies in the overgrowing of cultivated l<strong>and</strong>,<br />
<strong>and</strong> the disappearance of sea views <strong>and</strong> semi-open<br />
l<strong>and</strong>scape types in coastal areas <strong>and</strong> on the isl<strong>and</strong>s.<br />
Four goals have been set to preserve l<strong>and</strong>scapes<br />
<strong>and</strong> wildlife:<br />
conservation of semi-natural communities;<br />
protection <strong>and</strong> preservation of valuable species<br />
<strong>and</strong> habitats;<br />
preservation of the cultural l<strong>and</strong>scape of the<br />
region, taking into account the historical l<strong>and</strong>scape<br />
structure <strong>and</strong> the existing elements of the l<strong>and</strong>scape;<br />
protection <strong>and</strong> preservation of historical <strong>and</strong><br />
cultural heritage.<br />
L<strong>and</strong>scape <strong>and</strong> nature conservation areas have<br />
been established to preserve <strong>and</strong> protect the diverse<br />
l<strong>and</strong>scapes of Estonia, of which activities are continuing.<br />
Twelve per cent of the country's territory<br />
was covered by conservation areas in 2001. In the<br />
year 2000, the government ratified a programme<br />
for setting up a Natura 2000 network. Natura 2000<br />
is a network of European Union nature conserva-<br />
38
11.<br />
tion areas. The areas belonging to the network need<br />
not always establish a strict conservation regime or<br />
ban all human activities. In each area of Natura<br />
2000, the habitat types <strong>and</strong> habitats of species are<br />
protected for which the area has been designated.<br />
The Natura 2000 network includes nature conservation<br />
areas <strong>and</strong> bird sanctuaries. But conservation<br />
of the areas alone is not enough. Valuable agricultural<br />
l<strong>and</strong>scapes <strong>and</strong> the habitats of birds <strong>and</strong> animals<br />
are preserved when economic activities use<br />
natural resources in a sustainable manner.<br />
Support is available for l<strong>and</strong><br />
maintenance<br />
Since 1996 the farmers of Matsalu nature conservation<br />
area are paid for producing hay for grazing<br />
animals on the coastal <strong>and</strong> bottom-l<strong>and</strong> meadows.<br />
This way, the diversity of nature is preserved <strong>and</strong><br />
the <strong>rural</strong> development of the area is also supported.<br />
Another method of paying subsidies is the <strong>agriculture</strong><br />
environmental programme, which is aimed<br />
at preserving the l<strong>and</strong>scape <strong>and</strong> biological diversity<br />
of agricultural l<strong>and</strong>. Environmental subsidies are<br />
paid on the principle that an agricultural producer<br />
assumes a long-term (at least five year) obligation<br />
to shift to environmentally-friendly production.<br />
The producers are compensated for income foregone<br />
<strong>and</strong> for the additional expenses incurred due<br />
to such activities. The <strong>agriculture</strong> environmental<br />
programme has been in preparation since 1997.<br />
The programme was launched in part in 2000<br />
(including in respect of organic farming).<br />
The <strong>agriculture</strong> environmental programme<br />
consists of four action plans:<br />
environment-friendly <strong>economy</strong>;<br />
additional measures (organic farming, local<br />
endangered breeds <strong>and</strong> varieties, natural diversity,<br />
establishment of ponds <strong>and</strong> wetl<strong>and</strong>s);<br />
maintenance of discarded, overgrown agricultural<br />
l<strong>and</strong>;<br />
training <strong>and</strong> sample projects.<br />
The objectives of an environmentally-friendly<br />
<strong>economy</strong>, which is the first priority of the action<br />
plan, are:<br />
preservation of natural <strong>and</strong> semi-natural<br />
communities <strong>and</strong> valuable l<strong>and</strong>scape elements, protection<br />
of objects of historical <strong>and</strong> archaeological<br />
interest, <strong>and</strong> improvement of the visual appearance<br />
of l<strong>and</strong>scapes (articulation of fields larger than<br />
20 ha by strips of perennial plants);<br />
establishment or preservation of strips of perennial<br />
plants on the edges of fields adjacent to<br />
non-arable l<strong>and</strong>;<br />
conservation <strong>and</strong> restraint from damaging<br />
natural <strong>and</strong> semi-natural communities <strong>and</strong> valuable<br />
l<strong>and</strong>scape elements <strong>and</strong> objects of historical <strong>and</strong><br />
archaeological value;<br />
cutting grass on clear l<strong>and</strong> not in agricultural<br />
39
11.<br />
use at least once a year in order to improve the<br />
appearance of production holdings, <strong>and</strong> ensuring<br />
the maintenance of the territory of such holdings.<br />
To enhance biodiversity <strong>and</strong> the diversity of<br />
l<strong>and</strong>scapes, the establishment of ponds <strong>and</strong> wetl<strong>and</strong>s,<br />
the restoration <strong>and</strong> maintenance of stone<br />
walls, <strong>and</strong> the establishment of strips of bushes of<br />
different species are supported.<br />
In 2001, a project was launched for managing<br />
semi-natural communities nationwide <strong>and</strong> for supporting<br />
the majority of the activities under the <strong>agriculture</strong><br />
environmental programme in two pilot<br />
areas (Lüm<strong>and</strong>a <strong>and</strong> Kihelkonna parishes in<br />
Saaremaa). L<strong>and</strong> owners were paid l<strong>and</strong> maintenance<br />
support for a purposeful management of<br />
semi-natural communities in a total amount of 19<br />
million EEK from the budget of the Ministry of the<br />
Environment.<br />
The plans for 2002 under the <strong>agriculture</strong> environmental<br />
programme include the payment of support<br />
to the agricultural producers of ca 40 parishes<br />
for maintaining l<strong>and</strong>s not used in <strong>agriculture</strong> <strong>and</strong><br />
for applying good plant production principles.<br />
Preparations will be made in 2002–2003 for<br />
applying the 7 th SAPARD measure in the pilot areas<br />
<strong>and</strong> for implementing the <strong>agriculture</strong> environmental<br />
programme nationwide.<br />
In organising the studying, protection,<br />
maintenance, <strong>and</strong> restoration of semi-natural communities<br />
in Estonia, the Ministries of Agriculture<br />
<strong>and</strong> the Environment have been greatly assisted by<br />
nature conservation <strong>and</strong> environmental protection<br />
organisations such as the Estonian Nature Fund<br />
<strong>and</strong> the Estonian Seminatural Community Conservation<br />
Association; the Ecological Technologies<br />
Centre cooperated in the preparation of the<br />
environmental programme.<br />
40
MINISTRY OF AGRICULTURE STRUCTURE<br />
Advisers to the Ministry<br />
Minister<br />
Secretary General<br />
Advisers to the Minister<br />
Deputy Secretary General<br />
for Agriculture <strong>and</strong> Rural<br />
Development<br />
Deputy Secretary General<br />
for Agro-Food <strong>and</strong> Trade<br />
Department of<br />
Rural Development<br />
Bureau of<br />
Infrastructure<br />
Bureau of Rural<br />
Policy<br />
Bureau of Rural<br />
Entrepreneurship<br />
Bureau of Research<br />
Education <strong>and</strong><br />
Extension<br />
Department<br />
of Agriculture<br />
Bureau of<br />
phytosanitary<br />
Bureau of<br />
Intervention<br />
Bureau of<br />
Enviroment<br />
Bureau of Animal<br />
Husb<strong>and</strong>ry<br />
Bureau of<br />
Information <strong>and</strong><br />
Income Policy<br />
Bureau of<br />
Cultivation<br />
Veterinary <strong>and</strong><br />
Food Department<br />
Bureau of<br />
Inspection<br />
Bureau of<br />
Food Safety<br />
Bureau of<br />
Veterinary Service<br />
Bureau of breeding<br />
<strong>and</strong> animal welfare<br />
Department of<br />
Agro-Food <strong>and</strong><br />
Trade<br />
Bureau of<br />
Trade<br />
Bureau of Agro-<br />
Industry<br />
Bureau of<br />
Alcohol<br />
Department of<br />
Legal Services<br />
Department of<br />
Internal Audit<br />
Department of<br />
Public <strong>and</strong> Foreign<br />
Affairs<br />
Bureau of<br />
Public Relations<br />
Bureau of Foreign<br />
Relations<br />
Department of<br />
Fishery Economics<br />
Administrative<br />
Department<br />
Bureau of<br />
Budgeting<br />
Bureau of<br />
Informatics<br />
Bureau Office <strong>and</strong><br />
Management<br />
Bureau of Personnel<br />
Bureau of<br />
Accounting<br />
Bureau of Public<br />
Property<br />
Administration
MINISTRY OF AGRICULTURE REPUBLIC OF ESTONIA<br />
39/41 Lai Str.<br />
15056 Tallinn ESTONIA<br />
Telephone: (+372) 6256 101<br />
Fax: (+372) 6256 200<br />
E-mail: pm@agri.ee<br />
www.agri.ee<br />
PLANT PRODUCTION INSPECTORATE<br />
2 Teaduse Str.<br />
75501 Saku<br />
HARJU COUNTY<br />
ESTONIA<br />
Telephone: (+372) 671 2602<br />
Fax: +(372) 671 2604<br />
E-mail: plant@plant.agri.ee<br />
www.plant.agri.ee<br />
ANIMAL BREEDING INSPECTORATE<br />
2 Teaduse Str.<br />
75501 Saku<br />
HARJU COUNTY<br />
ESTONIA<br />
Telephone: +(372)672 8883<br />
Fax (+372) 672 8883<br />
E-mail: anne.emmus@breeding.ee<br />
www.breeding.ee/inspektsioon.php<br />
AGRICULTURAL REGISTERS AND<br />
INFORMATION BOARD<br />
3 Narva Road<br />
51009 TARTU<br />
ESTONIA<br />
Telephone: (+372) 7 371 200<br />
Fax: (+372) 7 371 201<br />
E-mail: pria@pria.ee<br />
web.pria.ee<br />
VETERINARY AND FOOD BOARD<br />
3 Väike-Paala Str.<br />
11415 TALLINN<br />
ESTONIA<br />
Telephone: (+372)605 1710<br />
Fax: (+372)621 1441<br />
E-mail: vet@vet.agri.ee<br />
www.vet.agri.ee<br />
BORDER SERVICE OF VETERINARY AND<br />
FOOD BOARD<br />
3 Väike-Paala Str.<br />
11415 TALLINN<br />
ESTONIA<br />
Telephone: (+372)605 6888<br />
Fax: (+372)605 6887<br />
E-mail: piir@vet.agri.ee<br />
www.vet.agri.ee<br />
JÄNEDA TRAINING AND ADVISORY CENTRE<br />
Jäneda<br />
73602 JÄRVA COUNTY<br />
ESTONIA<br />
Telephone: (+372) 38 98275<br />
Fax: (+372) 38 38198<br />
E-mail: onk@janeda.ee<br />
www.janeda.ee/jonk/index.html<br />
ANIMAL RECORDING CENTRE<br />
48A Kreutzwaldi Str.<br />
50094 TARTU<br />
ESTONIA<br />
Telephone: (+372) 7 387 700<br />
Fax (+372) 7 387 702<br />
E-mail: keskus@reg.agri.ee<br />
www.reg.agri.ee<br />
CONTROL CENTRE OF PLANT PRODUCTION<br />
6 Teaduse Str.<br />
75501 Saku<br />
HARJU COUNTY<br />
ESTONIA<br />
Telephone: (+372) 672 9112<br />
Fax: (+372)672 9113<br />
E-mail: info@tmkk.ee<br />
www.tmkk.ee<br />
VETERINARY AND FOOD LABORATORY<br />
3 Väike-Paala Str.<br />
11415 TALLINN<br />
ESTONIA<br />
Telephone (+372) 621 1453<br />
Fax: (+372) 621 1453<br />
E-mail: lab@vet.agri.ee<br />
www.vetlab.ee<br />
ESTONIAN RESEARCH INSTITUTE OF<br />
AGRICULTURE<br />
13 Teaduse Str.<br />
75501 Saku<br />
HARJU COUNTY<br />
ESTONIA<br />
Telephone: (+372)604 1854<br />
Fax: (+372) 604 1961<br />
E-mail: arvi.kallas@mail.ee<br />
www.eria.ee<br />
JÕGEVA INSTITUTE OF PLANT BREEDING<br />
1 Aamisepa Str.<br />
48309 JÕGEVA<br />
ESTONIA<br />
Telephone: (+372) 77 66 901<br />
Fax: (+372) 77 66 902<br />
E-mail: jogeva@jpbi.ee<br />
www.jpbi.ee<br />
ESTONIAN AGRI-BIO CENTRE<br />
10 Rõõmu Str.<br />
51013 TARTU<br />
ESTONIA<br />
Telephone: (+372) 7 339 717<br />
Fax: (+372) 7 339 717<br />
E-mail: eabc@eau.ee<br />
www.eau.ee/eabc