estonian agriculture, rural economy and food industry
estonian agriculture, rural economy and food industry
estonian agriculture, rural economy and food industry

You also want an ePaper? Increase the reach of your titles
YUMPU automatically turns print PDFs into web optimized ePapers that Google loves.
7.<br />
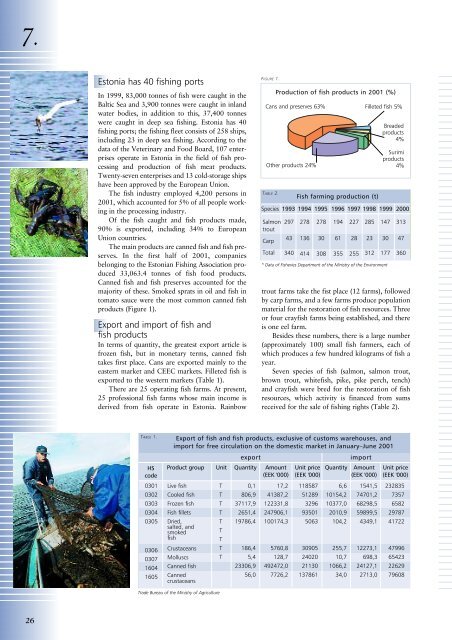
Estonia has 40 fishing ports<br />
In 1999, 83,000 tonnes of fish were caught in the<br />
Baltic Sea <strong>and</strong> 3,900 tonnes were caught in inl<strong>and</strong><br />
water bodies, in addition to this, 37,400 tonnes<br />
were caught in deep sea fishing. Estonia has 40<br />
fishing ports; the fishing fleet consists of 258 ships,<br />
including 23 in deep sea fishing. According to the<br />
data of the Veterinary <strong>and</strong> Food Board, 107 enterprises<br />
operate in Estonia in the field of fish processing<br />
<strong>and</strong> production of fish meat products.<br />
Twenty-seven enterprises <strong>and</strong> 13 cold-storage ships<br />
have been approved by the European Union.<br />
The fish <strong>industry</strong> employed 4,200 persons in<br />
2001, which accounted for 5% of all people working<br />
in the processing <strong>industry</strong>.<br />
Of the fish caught <strong>and</strong> fish products made,<br />
90% is exported, including 34% to European<br />
Union countries.<br />
The main products are canned fish <strong>and</strong> fish preserves.<br />
In the first half of 2001, companies<br />
belonging to the Estonian Fishing Association produced<br />
33,063.4 tonnes of fish <strong>food</strong> products.<br />
Canned fish <strong>and</strong> fish preserves accounted for the<br />
majority of these. Smoked sprats in oil <strong>and</strong> fish in<br />
tomato sauce were the most common canned fish<br />
products (Figure 1).<br />
Export <strong>and</strong> import of fish <strong>and</strong><br />
fish products<br />
In terms of quantity, the greatest export article is<br />
frozen fish, but in monetary terms, canned fish<br />
takes first place. Cans are exported mainly to the<br />
eastern market <strong>and</strong> CEEC markets. Filleted fish is<br />
exported to the western markets (Table 1).<br />
There are 25 operating fish farms. At present,<br />
25 professional fish farms whose main income is<br />
derived from fish operate in Estonia. Rainbow<br />
FIGURE 1.<br />
Cans <strong>and</strong> preserves 63%<br />
Other products 24%<br />
TABLE 2.<br />
Production of fish products in 2001 (%)<br />
297<br />
43<br />
340<br />
Fish farming production (t)<br />
Species 1993 1994 1995 1996 1997 1998 1999 2000<br />
Salmon<br />
trout<br />
Carp<br />
Total<br />
278<br />
136<br />
414<br />
278<br />
30<br />
308<br />
194<br />
61<br />
355<br />
227<br />
trout farms take the fist place (12 farms), followed<br />
by carp farms, <strong>and</strong> a few farms produce population<br />
material for the restoration of fish resources. Three<br />
or four crayfish farms being established, <strong>and</strong> there<br />
is one eel farm.<br />
Besides these numbers, there is a large number<br />
(approximately 100) small fish farmers, each of<br />
which produces a few hundred kilograms of fish a<br />
year.<br />
Seven species of fish (salmon, salmon trout,<br />
brown trout, whitefish, pike, pike perch, tench)<br />
<strong>and</strong> crayfish were bred for the restoration of fish<br />
resources, which activity is financed from sums<br />
received for the sale of fishing rights (Table 2).<br />
28<br />
255<br />
Filleted fish 5%<br />
285<br />
23<br />
312<br />
Breaded<br />
products<br />
4%<br />
Surimi<br />
products<br />
4%<br />
147<br />
30<br />
177<br />
* Data of Fisheries Department of the Ministry of the Environment<br />
313<br />
47<br />
360<br />
TABLE 1.<br />
HS<br />
code<br />
0301<br />
0302<br />
0303<br />
0304<br />
0305<br />
0306<br />
0307<br />
1604<br />
1605<br />
Export of fish <strong>and</strong> fish products, exclusive of customs warehouses, <strong>and</strong><br />
import for free circulation on the domestic market in January–June 2001<br />
export<br />
import<br />
Product group<br />
Live fish<br />
Cooled fish<br />
Frozen fish<br />
Fish fillets<br />
Dried,<br />
salted, <strong>and</strong><br />
smoked<br />
fish<br />
Crustaceans<br />
Molluscs<br />
Canned fish<br />
Canned<br />
crustaceans<br />
Unit<br />
T<br />
T<br />
T<br />
T<br />
T<br />
T<br />
T<br />
T<br />
T<br />
Quantity<br />
0,1<br />
806,9<br />
37117,9<br />
2651,4<br />
19786,4<br />
186,4<br />
5,4<br />
23306,9<br />
56,0<br />
Amount<br />
(EEK '000)<br />
17,2<br />
41387,2<br />
122331,8<br />
247906,1<br />
100174,3<br />
5760,8<br />
128,7<br />
492472,0<br />
7726,2<br />
Unit price<br />
(EEK '000)<br />
118587<br />
51289<br />
3296<br />
93501<br />
5063<br />
30905<br />
24020<br />
21130<br />
137861<br />
Quantity<br />
6,6<br />
10154,2<br />
10377,0<br />
2010,9<br />
104,2<br />
255,7<br />
10,7<br />
1066,2<br />
34,0<br />
Amount<br />
(EEK '000)<br />
1541,5<br />
74701,2<br />
68298,5<br />
59899,5<br />
4349,1<br />
12273,1<br />
698,3<br />
24127,1<br />
2713,0<br />
Unit price<br />
(EEK '000)<br />
232835<br />
7357<br />
6582<br />
29787<br />
41722<br />
47996<br />
65423<br />
22629<br />
79608<br />
Trade Bureau of the Ministry of Agriculture<br />
26