

2013-2017_-_Private_Sector_Development_Strategy
2013-2017_-_Private_Sector_Development_Strategy
2013-2017_-_Private_Sector_Development_Strategy

Create successful ePaper yourself
Turn your PDF publications into a flip-book with our unique Google optimized e-Paper software.
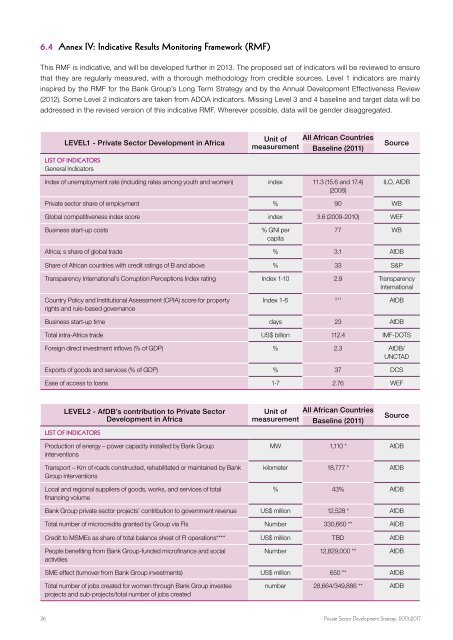
6.4 Annex IV: Indicative Results Monitoring Framework (RMF)<br />
This RMF is indicative, and will be developed further in <strong>2013</strong>. The proposed set of indicators will be reviewed to ensure<br />
that they are regularly measured, with a thorough methodology from credible sources. Level 1 indicators are mainly<br />
inspired by the RMF for the Bank Group’s Long Term <strong>Strategy</strong> and by the Annual <strong>Development</strong> Effectiveness Review<br />
(2012). Some Level 2 indicators are taken from ADOA indicators. Missing Level 3 and 4 baseline and target data will be<br />
addressed in the revised version of this indicative RMF. Wherever possible, data will be gender disaggregated.<br />
LEVEL1 - <strong>Private</strong> <strong>Sector</strong> <strong>Development</strong> in Africa<br />
List of indicators<br />
General Indicators<br />
Unit of<br />
measurement<br />
All African Countries<br />
Baseline (2011)<br />
Source<br />
Index of unemployment rate (including rates among youth and women) index 11.3 (15.6 and 17.4)<br />
(2008)<br />
ILO, AfDB<br />
<strong>Private</strong> sector share of employment % 90 WB<br />
Global competitiveness index score index 3.6 (2009-2010) WEF<br />
Business start-up costs<br />
% GNI per<br />
capita<br />
77 WB<br />
Africa; s share of global trade % 3.1 AfDB<br />
Share of African countries with credit ratings of B and above % 33 S&P<br />
Transparency International’s Corruption Perceptions Index rating Index 1-10 2.9 Transparency<br />
International<br />
Country Policy and Institutional Assessment (CPIA) score for property<br />
rights and rule-based governance<br />
Index 1-6<br />
3.11<br />
AfDB<br />
Business start-up time days 23 AfDB<br />
Total intra-Africa trade US$ billion 112.4 IMF-DOTS<br />
Foreign direct investment inflows (% of GDP) % 2.3 AfDB/<br />
UNCTAD<br />
Exports of goods and services (% of GDP) % 37 DCS<br />
Ease of access to loans 1-7 2.76 WEF<br />
LEVEL2 - AfDB’s contribution to <strong>Private</strong> <strong>Sector</strong><br />
<strong>Development</strong> in Africa<br />
List of indicators<br />
Unit of<br />
measurement<br />
All African Countries<br />
Baseline (2011)<br />
Source<br />
Production of energy – power capacity installed by Bank Group<br />
interventions<br />
Transport – Km of roads constructed, rehabilitated or maintained by Bank<br />
Group interventions<br />
Local and regional suppliers of goods, works, and services of total<br />
financing volume<br />
MW 1,110 * AfDB<br />
kilometer 18,777 * AfDB<br />
% 43% AfDB<br />
Bank Group private sector projects’ contribution to government revenue US$ million 12,528 * AfDB<br />
Total number of microcredits granted by Group via FIs Number 330,660 ** AfDB<br />
Credit to MSMEs as share of total balance sheet of FI operations**** US$ million TBD AfDB<br />
People benefiting from Bank Group-funded microfinance and social<br />
activities<br />
Number 12,829,000 ** AfDB<br />
SME effect (turnover from Bank Group investments) US$ million 650 ** AfDB<br />
Total number of jobs created for women through Bank Group investee<br />
projects and sub-projects/total number of jobs created<br />
number 28,664/349,886 ** AfDB<br />
36 <strong>Private</strong> <strong>Sector</strong> <strong>Development</strong> <strong>Strategy</strong>, <strong>2013</strong>-<strong>2017</strong>