


Create successful ePaper yourself
Turn your PDF publications into a flip-book with our unique Google optimized e-Paper software.
Ratio Analysis<br />
Cash Flow<br />
Balance Sheet<br />
Profit & Loss Statement<br />
Global Research – <strong>Oman</strong><br />
<strong>Oman</strong> <strong>Cement</strong> <strong>Company</strong><br />
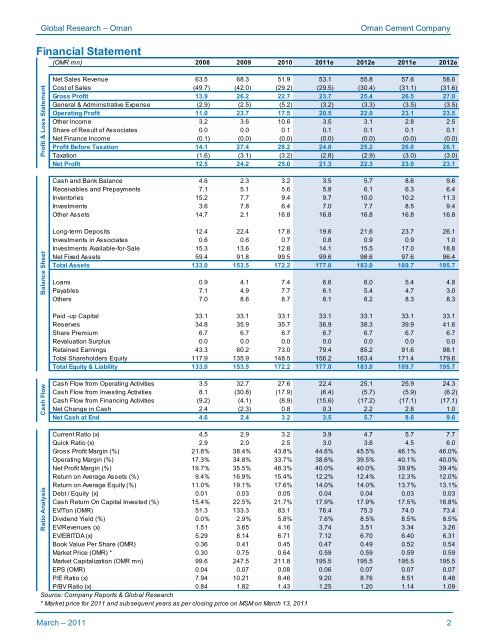
Financial Statement<br />
(OMR mn) 2008 2009 2010 2011e 2012e 2011e 2012e<br />
Net Sales Revenue 63.5 68.3 51.9 53.1 55.8 57.6 58.6<br />
Cost of Sales (49.7) (42.0) (29.2) (29.5) (30.4) (31.1) (31.6)<br />
Gross Profit 13.9 26.2 22.7 23.7 25.4 26.5 27.0<br />
General & Administrative Expense (2.9) (2.5) (5.2) (3.2) (3.3) (3.5) (3.5)<br />
Operating Profit 11.0 23.7 17.5 20.5 22.0 23.1 23.5<br />
Other Income 3.2 3.6 10.6 3.5 3.1 2.8 2.5<br />
Share of Result of Associates 0.0 0.0 0.1 0.1 0.1 0.1 0.1<br />
Net Finance Income (0.1) (0.0) (0.0) (0.0) (0.0) (0.0) (0.0)<br />
Profit Before Taxation 14.1 27.4 28.2 24.0 25.2 26.0 26.1<br />
Taxation (1.6) (3.1) (3.2) (2.8) (2.9) (3.0) (3.0)<br />
Net Profit 12.5 24.2 25.0 21.3 22.3 23.0 23.1<br />
Cash and Bank Balance 4.6 2.3 3.2 3.5 5.7 8.6 9.6<br />
Receivables and Prepayments 7.1 5.1 5.6 5.8 6.1 6.3 6.4<br />
Inventories 15.2 7.7 9.4 9.7 10.0 10.2 11.3<br />
Investments 3.6 7.8 6.4 7.0 7.7 8.5 9.4<br />
Other Assets 14.7 2.1 16.8 16.8 16.8 16.8 16.8<br />
Long-term Deposits 12.4 22.4 17.8 19.6 21.6 23.7 26.1<br />
Investments in Associates 0.6 0.6 0.7 0.8 0.9 0.9 1.0<br />
Investments Available-for-Sale 15.3 13.6 12.8 14.1 15.5 17.0 18.8<br />
Net Fixed Assets 59.4 91.8 99.5 99.6 98.6 97.6 96.4<br />
Total Assets 133.0 153.5 172.2 177.0 183.0 189.7 195.7<br />
Loans 0.9 4.1 7.4 6.6 6.0 5.4 4.8<br />
Payables 7.1 4.9 7.7 6.1 5.4 4.7 3.0<br />
Others 7.0 8.6 8.7 8.1 8.2 8.3 8.3<br />
Paid -up Capital 33.1 33.1 33.1 33.1 33.1 33.1 33.1<br />
Reserves 34.8 35.9 35.7 36.9 38.3 39.9 41.6<br />
Share Premium 6.7 6.7 6.7 6.7 6.7 6.7 6.7<br />
Revaluation Surplus 0.0 0.0 0.0 0.0 0.0 0.0 0.0<br />
Retained Earnings 43.3 60.2 73.0 79.4 85.2 91.6 98.1<br />
Total Shareholders Equity 117.9 135.9 148.5 156.2 163.4 171.4 179.6<br />
Total Equity & Liability 133.0 153.5 172.2 177.0 183.0 189.7 195.7<br />
Cash Flow from Operating Activities 3.5 32.7 27.6 22.4 25.1 25.9 24.3<br />
Cash Flow from Investing Activities 8.1 (30.8) (17.9) (6.4) (5.7) (5.9) (6.2)<br />
Cash Flow from Financing Activities (9.2) (4.1) (8.9) (15.6) (17.2) (17.1) (17.1)<br />
Net Change in Cash 2.4 (2.3) 0.8 0.3 2.2 2.8 1.0<br />
Net Cash at End 4.6 2.4 3.2 3.5 5.7 8.6 9.6<br />
Current Ratio (x) 4.5 2.9 3.2 3.9 4.7 5.7 7.7<br />
Quick Ratio (x) 2.9 2.0 2.5 3.0 3.6 4.5 6.0<br />
Gross Profit Margin (%) 21.8% 38.4% 43.8% 44.6% 45.5% 46.1% 46.0%<br />
Operating Margin (%) 17.3% 34.8% 33.7% 38.6% 39.5% 40.1% 40.0%<br />
Net Profit Margin (%) 19.7% 35.5% 48.3% 40.0% 40.0% 39.9% 39.4%<br />
Return on Average Assets (%) 9.4% 16.9% 15.4% 12.2% 12.4% 12.3% 12.0%<br />
Return on Average Equity (%) 11.0% 19.1% 17.6% 14.0% 14.0% 13.7% 13.1%<br />
Debt / Equity (x) 0.01 0.03 0.05 0.04 0.04 0.03 0.03<br />
Cash Return On Capital Invested (%) 15.4% 22.5% 21.7% 17.9% 17.9% 17.5% 16.8%<br />
EV/Ton (OMR) 51.3 133.3 83.1 76.4 75.3 74.0 73.4<br />
Dividend Yield (%) 0.0% 2.9% 5.8% 7.6% 8.5% 8.5% 8.5%<br />
EV/Revenues (x) 1.51 3.65 4.16 3.74 3.51 3.34 3.26<br />
EV/EBITDA (x) 5.29 8.14 6.71 7.12 6.70 6.40 6.31<br />
Book Value Per Share (OMR) 0.36 0.41 0.45 0.47 0.49 0.52 0.54<br />
Market Price (OMR) * 0.30 0.75 0.64 0.59 0.59 0.59 0.59<br />
Market Capitalization (OMR mn) 99.6 247.5 211.8 195.5 195.5 195.5 195.5<br />
EPS (OMR) 0.04 0.07 0.08 0.06 0.07 0.07 0.07<br />
P/E Ratio (x) 7.94 10.21 8.46 9.20 8.76 8.51 8.48<br />
P/BV Ratio (x) 0.84 1.82 1.43 1.25 1.20 1.14 1.09<br />
Source: <strong>Company</strong> Reports & Global Research<br />
* Market price for 2011 and subsequent years as per closing price on MSM on March 13, 2011<br />
March – 2011 2


