


You also want an ePaper? Increase the reach of your titles
YUMPU automatically turns print PDFs into web optimized ePapers that Google loves.
Mar-10<br />
Apr-10<br />
May-10<br />
Jun-10<br />
Jul-10<br />
Aug-10<br />
Sep-10<br />
Oct-10<br />
Nov-10<br />
Dec-10<br />
Jan-11<br />
Feb-11<br />
Mar-11<br />
Global Research<br />
Result Update<br />
Equity – <strong>Oman</strong><br />
<strong>Cement</strong> Sector<br />
13 March, 2011<br />
<strong>Oman</strong> <strong>Cement</strong> <strong>Company</strong><br />
Market Data<br />
Bloomberg Code:<br />
OCOI OM<br />
Reuters Code:<br />
OCCO.OM<br />
CMP (13 Mar 2011):<br />
OMR0.591<br />
O/S (mn) 330.9<br />
Market Cap (OMR mn): 193.3<br />
Market Cap (USD mn): 501.8<br />
P/E 2011e (x): 9.2<br />
P/Bv 2011e (x): 1.3<br />
Price Performance 1-Yr<br />
High (OMR): 0.737<br />
Low (OMR): 0.413<br />
Average Volume: (000) 227.5<br />
1m 3m 12m<br />
Absolute (%) -3.5 -7.0 -12.2<br />
Relative (%) 1.0 -8.7 -14.3<br />
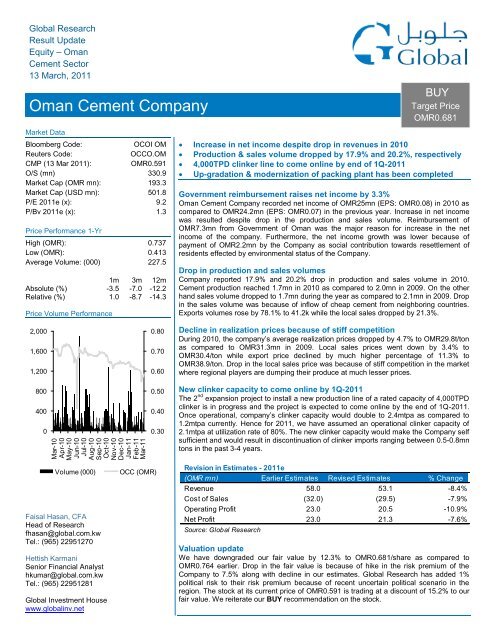
Price Volume Performance<br />
BUY<br />
Target Price<br />
OMR0.681<br />
Increase in net income despite drop in revenues in 2010<br />
Production & sales volume dropped by 17.9% and 20.2%, respectively<br />
4,000TPD clinker line to come online by end of 1Q-2011<br />
Up-gradation & modernization of packing plant has been completed<br />
Government reimbursement raises net income by 3.3%<br />
<strong>Oman</strong> <strong>Cement</strong> <strong>Company</strong> recorded net income of OMR25mn (EPS: OMR0.08) in 2010 as<br />
compared to OMR24.2mn (EPS: OMR0.07) in the previous year. Increase in net income<br />
was resulted despite drop in the production and sales volume. Reimbursement of<br />
OMR7.3mn from Government of <strong>Oman</strong> was the major reason for increase in the net<br />
income of the company. Furthermore, the net income growth was lower because of<br />
payment of OMR2.2mn by the <strong>Company</strong> as social contribution towards resettlement of<br />
residents effected by environmental status of the <strong>Company</strong>.<br />
Drop in production and sales volumes<br />
<strong>Company</strong> reported 17.9% and 20.2% drop in production and sales volume in 2010.<br />
<strong>Cement</strong> production reached 1.7mn in 2010 as compared to 2.0mn in 2009. On the other<br />
hand sales volume dropped to 1.7mn during the year as compared to 2.1mn in 2009. Drop<br />
in the sales volume was because of inflow of cheap cement from neighboring countries.<br />
Exports volumes rose by 78.1% to 41.2k while the local sales dropped by 21.3%.<br />
2,000<br />
1,600<br />
1,200<br />
800<br />
400<br />
0<br />
0.80<br />
0.70<br />
0.60<br />
0.50<br />
0.40<br />
0.30<br />
Decline in realization prices because of stiff competition<br />
During 2010, the company’s average realization prices dropped by 4.7% to OMR29.8t/ton<br />
as compared to OMR31.3mn in 2009. Local sales prices went down by 3.4% to<br />
OMR30.4/ton while export price declined by much higher percentage of 11.3% to<br />
OMR38.9/ton. Drop in the local sales price was because of stiff competition in the market<br />
where regional players are dumping their produce at much lesser prices.<br />
New clinker capacity to come online by 1Q-2011<br />
The 2 nd expansion project to install a new production line of a rated capacity of 4,000TPD<br />
clinker is in progress and the project is expected to come online by the end of 1Q-2011.<br />
Once operational, company’s clinker capacity would double to 2.4mtpa as compared to<br />
1.2mtpa currently. Hence for 2011, we have assumed an operational clinker capacity of<br />
2.1mtpa at utilization rate of 80%. The new clinker capacity would make the <strong>Company</strong> self<br />
sufficient and would result in discontinuation of clinker imports ranging between 0.5-0.8mn<br />
tons in the past 3-4 years.<br />
Volume (000)<br />
Faisal Hasan, CFA<br />
Head of Research<br />
fhasan@global.com.kw<br />
Tel.: (965) 22951270<br />
Hettish Karmani<br />
Senior Financial Analyst<br />
hkumar@global.com.kw<br />
Tel.: (965) 22951281<br />
Global Investment House<br />
www.globalinv.net<br />
OCC (OMR)<br />
Revision in Estimates - 2011e<br />
(OMR mn) Earlier Estimates Revised Estimates % Change<br />
Revenue 58.0 53.1 -8.4%<br />
Cost of Sales (32.0) (29.5) -7.9%<br />
Operating Profit 23.0 20.5 -10.9%<br />
Net Profit 23.0 21.3 -7.6%<br />
Source: Global Research<br />
Valuation update<br />
We have downgraded our fair value by 12.3% to OMR0.681/share as compared to<br />
OMR0.764 earlier. Drop in the fair value is because of hike in the risk premium of the<br />
<strong>Company</strong> to 7.5% along with decline in our estimates. Global Research has added 1%<br />
political risk to their risk premium because of recent uncertain political scenario in the<br />
region. The stock at its current price of OMR0.591 is trading at a discount of 15.2% to our<br />
fair value. We reiterate our BUY recommendation on the stock.
Ratio Analysis<br />
Cash Flow<br />
Balance Sheet<br />
Profit & Loss Statement<br />
Global Research – <strong>Oman</strong><br />
<strong>Oman</strong> <strong>Cement</strong> <strong>Company</strong><br />
Financial Statement<br />
(OMR mn) 2008 2009 2010 2011e 2012e 2011e 2012e<br />
Net Sales Revenue 63.5 68.3 51.9 53.1 55.8 57.6 58.6<br />
Cost of Sales (49.7) (42.0) (29.2) (29.5) (30.4) (31.1) (31.6)<br />
Gross Profit 13.9 26.2 22.7 23.7 25.4 26.5 27.0<br />
General & Administrative Expense (2.9) (2.5) (5.2) (3.2) (3.3) (3.5) (3.5)<br />
Operating Profit 11.0 23.7 17.5 20.5 22.0 23.1 23.5<br />
Other Income 3.2 3.6 10.6 3.5 3.1 2.8 2.5<br />
Share of Result of Associates 0.0 0.0 0.1 0.1 0.1 0.1 0.1<br />
Net Finance Income (0.1) (0.0) (0.0) (0.0) (0.0) (0.0) (0.0)<br />
Profit Before Taxation 14.1 27.4 28.2 24.0 25.2 26.0 26.1<br />
Taxation (1.6) (3.1) (3.2) (2.8) (2.9) (3.0) (3.0)<br />
Net Profit 12.5 24.2 25.0 21.3 22.3 23.0 23.1<br />
Cash and Bank Balance 4.6 2.3 3.2 3.5 5.7 8.6 9.6<br />
Receivables and Prepayments 7.1 5.1 5.6 5.8 6.1 6.3 6.4<br />
Inventories 15.2 7.7 9.4 9.7 10.0 10.2 11.3<br />
Investments 3.6 7.8 6.4 7.0 7.7 8.5 9.4<br />
Other Assets 14.7 2.1 16.8 16.8 16.8 16.8 16.8<br />
Long-term Deposits 12.4 22.4 17.8 19.6 21.6 23.7 26.1<br />
Investments in Associates 0.6 0.6 0.7 0.8 0.9 0.9 1.0<br />
Investments Available-for-Sale 15.3 13.6 12.8 14.1 15.5 17.0 18.8<br />
Net Fixed Assets 59.4 91.8 99.5 99.6 98.6 97.6 96.4<br />
Total Assets 133.0 153.5 172.2 177.0 183.0 189.7 195.7<br />
Loans 0.9 4.1 7.4 6.6 6.0 5.4 4.8<br />
Payables 7.1 4.9 7.7 6.1 5.4 4.7 3.0<br />
Others 7.0 8.6 8.7 8.1 8.2 8.3 8.3<br />
Paid -up Capital 33.1 33.1 33.1 33.1 33.1 33.1 33.1<br />
Reserves 34.8 35.9 35.7 36.9 38.3 39.9 41.6<br />
Share Premium 6.7 6.7 6.7 6.7 6.7 6.7 6.7<br />
Revaluation Surplus 0.0 0.0 0.0 0.0 0.0 0.0 0.0<br />
Retained Earnings 43.3 60.2 73.0 79.4 85.2 91.6 98.1<br />
Total Shareholders Equity 117.9 135.9 148.5 156.2 163.4 171.4 179.6<br />
Total Equity & Liability 133.0 153.5 172.2 177.0 183.0 189.7 195.7<br />
Cash Flow from Operating Activities 3.5 32.7 27.6 22.4 25.1 25.9 24.3<br />
Cash Flow from Investing Activities 8.1 (30.8) (17.9) (6.4) (5.7) (5.9) (6.2)<br />
Cash Flow from Financing Activities (9.2) (4.1) (8.9) (15.6) (17.2) (17.1) (17.1)<br />
Net Change in Cash 2.4 (2.3) 0.8 0.3 2.2 2.8 1.0<br />
Net Cash at End 4.6 2.4 3.2 3.5 5.7 8.6 9.6<br />
Current Ratio (x) 4.5 2.9 3.2 3.9 4.7 5.7 7.7<br />
Quick Ratio (x) 2.9 2.0 2.5 3.0 3.6 4.5 6.0<br />
Gross Profit Margin (%) 21.8% 38.4% 43.8% 44.6% 45.5% 46.1% 46.0%<br />
Operating Margin (%) 17.3% 34.8% 33.7% 38.6% 39.5% 40.1% 40.0%<br />
Net Profit Margin (%) 19.7% 35.5% 48.3% 40.0% 40.0% 39.9% 39.4%<br />
Return on Average Assets (%) 9.4% 16.9% 15.4% 12.2% 12.4% 12.3% 12.0%<br />
Return on Average Equity (%) 11.0% 19.1% 17.6% 14.0% 14.0% 13.7% 13.1%<br />
Debt / Equity (x) 0.01 0.03 0.05 0.04 0.04 0.03 0.03<br />
Cash Return On Capital Invested (%) 15.4% 22.5% 21.7% 17.9% 17.9% 17.5% 16.8%<br />
EV/Ton (OMR) 51.3 133.3 83.1 76.4 75.3 74.0 73.4<br />
Dividend Yield (%) 0.0% 2.9% 5.8% 7.6% 8.5% 8.5% 8.5%<br />
EV/Revenues (x) 1.51 3.65 4.16 3.74 3.51 3.34 3.26<br />
EV/EBITDA (x) 5.29 8.14 6.71 7.12 6.70 6.40 6.31<br />
Book Value Per Share (OMR) 0.36 0.41 0.45 0.47 0.49 0.52 0.54<br />
Market Price (OMR) * 0.30 0.75 0.64 0.59 0.59 0.59 0.59<br />
Market Capitalization (OMR mn) 99.6 247.5 211.8 195.5 195.5 195.5 195.5<br />
EPS (OMR) 0.04 0.07 0.08 0.06 0.07 0.07 0.07<br />
P/E Ratio (x) 7.94 10.21 8.46 9.20 8.76 8.51 8.48<br />
P/BV Ratio (x) 0.84 1.82 1.43 1.25 1.20 1.14 1.09<br />
Source: <strong>Company</strong> Reports & Global Research<br />
* Market price for 2011 and subsequent years as per closing price on MSM on March 13, 2011<br />
March – 2011 2
Global Research – <strong>Oman</strong><br />
<strong>Oman</strong> <strong>Cement</strong> <strong>Company</strong><br />
Disclosure<br />
The following is a comprehensive list of disclosures which may or may not apply to all our researches. Only the relevant<br />
disclosures which apply to this particular research has been mentioned in the table below under the heading of disclosure.<br />
Disclosure Checklist<br />
<strong>Company</strong><br />
Recommendation<br />
Bloomberg<br />
Ticker<br />
Reuters<br />
Ticker Price Disclosure<br />
<strong>Oman</strong> <strong>Cement</strong> <strong>Company</strong> BUY OCOI OM OCCO.OM OMR0.591 1,10<br />
1. Global Investment House did not receive and will not receive any compensation from the company or anyone else for the<br />
preparation of this report.<br />
2. The company being researched holds more than 5% stake in Global Investment House.<br />
3. Global Investment House makes a market in securities issued by this company.<br />
4. Global Investment House acts as a corporate broker or sponsor to this company.<br />
5. The author of or an individual who assisted in the preparation of this report (or a member of his/her household) has a direct<br />
ownership position in securities issued by this company.<br />
6. An employee of Global Investment House serves on the board of directors of this company.<br />
7. Within the past year, Global Investment House has managed or co-managed a public offering for this company, for which it<br />
received fees.<br />
8. Global Investment House has received compensation from this company for the provision of investment banking or financial<br />
advisory services within the past year.<br />
9. Global Investment House expects to receive or intends to seek compensation for investment banking services from this<br />
company in the next three month.<br />
10. Please see special footnote below for other relevant disclosures.<br />
Global Research: Equity Ratings Definitions<br />
Global Rating<br />
Definition<br />
STRONG BUY<br />
BUY<br />
HOLD<br />
SELL<br />
Fair value of the stock is >20% from the current market price<br />
Fair value of the stock is between +10% and +20% from the current market price<br />
Fair value of the stock is between +10% and -10% from the current market price<br />
Fair value of the stock is < -10% from the current market price<br />
Disclaimer<br />
This material was produced by Global Investment House KSCC (‘Global’),a firm regulated by the Central Bank of Kuwait. This document is not<br />
to be used or considered as an offer to sell or a solicitation of an offer to buy any securities. Global may, from time to time to the extent permitted<br />
by law, participate or invest in other financing transactions with the issuers of the securities (‘securities’), perform services for or solicit business<br />
from such issuer, and/or have a position or effect transactions in the securities or options thereof. Global may, to the extent permitted by<br />
applicable Kuwaiti law or other applicable laws or regulations, effect transactions in the securities before this material is published to recipients.<br />
Information and opinions contained herein have been compiled or arrived by Global from sources believed to be reliable, but Global has not<br />
independently verified the contents of this document. Accordingly, no representation or warranty, express or implied, is made as to and no<br />
reliance should be placed on the fairness, accuracy, completeness or correctness of the information and opinions contained in this document.<br />
Global accepts no liability for any loss arising from the use of this document or its contents or otherwise arising in connection therewith. This<br />
document is not to be relied upon or used in substitution for the exercise of independent judgment. Global shall have no responsibility or liability<br />
whatsoever in respect of any inaccuracy in or omission from this or any other document prepared by Global for, or sent by Global to any person<br />
and any such person shall be responsible for conducting his own investigation and analysis of the information contained or referred to in this<br />
document and of evaluating the merits and risks involved in the securities forming the subject matter of this or other such document. Opinions<br />
and estimates constitute our judgment and are subject to change without prior notice. Past performance is not indicative of future results. This<br />
document does not constitute an offer or invitation to subscribe for or purchase any securities, and neither this document nor anything contained<br />
herein shall form the basis of any contract or commitment whatsoever. It is being furnished to you solely for your information and may not be<br />
reproduced or redistributed to any other person. Neither this report nor any copy hereof may be distributed in any jurisdiction outside Kuwait<br />
where its distribution may be restricted by law. Persons who receive this report should make themselves aware of and adhere to any such<br />
restrictions. By accepting this report you agree to be bound by the foregoing limitations.<br />
March - 2011 3
Global Investment House<br />
Website: www.globalinv.net<br />
Global Tower<br />
Sharq, Al-Shuhada Str.<br />
Tel. + (965) 2 295 1000<br />
Fax. + (965) 2 295 1005<br />
P.O. Box: 28807 Safat, 13149 Kuwait<br />
Research<br />
Faisal Hasan, CFA<br />
(965) 2295-1270<br />
fhasan@global.com.kw<br />
Index<br />
Rasha Al-Huneidi<br />
(965) 2295-1285<br />
huneidi@global.com.kw<br />
Brokerage<br />
Fouad Fahmi Darwish<br />
(965) 2295-1700<br />
fdarwish@global.com.kw<br />
Wealth Management -<br />
Kuwait<br />
Rasha Al-Qenaei<br />
(965) 2295-1380<br />
alqenaei@global.com.kw<br />
Wealth Management -<br />
International<br />
Fahad Al-Ibrahim<br />
(965) 2295-1400<br />
fahad@global.com.kw<br />
Global Kuwait<br />
Tel: (965) 2 295 1000<br />
Fax: (965) 2 295 1005<br />
P.O.Box 28807 Safat, 13149<br />
Kuwait<br />
Global Abu Dhabi<br />
Tel: (971) 2 6744446<br />
Fax: (971) 2 6725263/4<br />
P.O.Box 127373 Abu Dhabi,<br />
UAE<br />
Global Egypt<br />
Tel: (202) 24189705/06<br />
Fax: (202) 22905972<br />
24 Cleopatra St., Heliopolis,<br />
Cairo<br />
Global Bahrain<br />
Tel: (973) 17 210011<br />
Fax: (973) 17 210222<br />
P.O.Box 855 Manama,<br />
Bahrain<br />
Global Saudi Arabia<br />
Tel: (966) 1 2994100<br />
Fax: (966) 1 2994199<br />
P.O. Box 66930 Riyadh<br />
11586,<br />
Kingdom of Saudi Arabia<br />
Global Jordan<br />
Tel: (962) 6 5005060<br />
Fax: (962) 6 5005066<br />
P.O.Box 3268 Amman 11180,<br />
Jordan<br />
Global Dubai<br />
Tel: (971) 4 4477066<br />
Fax: (971) 4 4477067<br />
P.O.Box 121227 Dubai,<br />
UAE<br />
Global Qatar<br />
Tel: (974) 4967305<br />
Fax: (974) 4967307<br />
P.O.Box 18126 Doha,<br />
Qatar<br />
Global Wealth Manager<br />
E-mail: contactus@global.com.kw<br />
Tel: (965) 1-804-242


