The Quality Measurement Journey - Sikker Patient
The Quality Measurement Journey - Sikker Patient
The Quality Measurement Journey - Sikker Patient

Create successful ePaper yourself
Turn your PDF publications into a flip-book with our unique Google optimized e-Paper software.
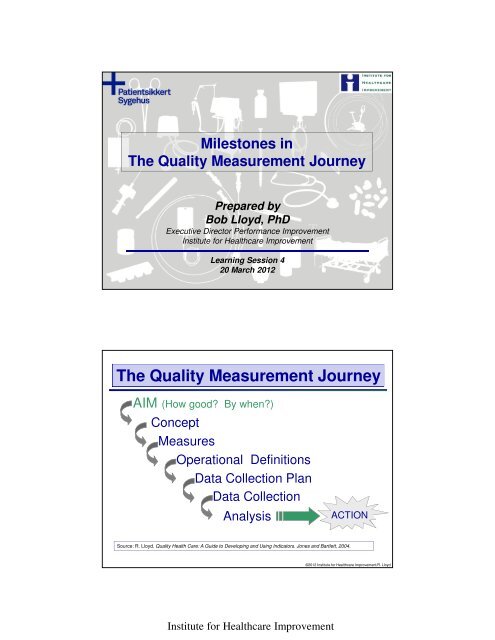
Milestones in<br />
<strong>The</strong> <strong>Quality</strong> <strong>Measurement</strong> <strong>Journey</strong><br />
Prepared by<br />
Bob Lloyd, PhD<br />
Executive Director Performance Improvement<br />
Institute for Healthcare Improvement<br />
Learning Session 4<br />
20 March 2012<br />
<strong>The</strong> <strong>Quality</strong> <strong>Measurement</strong> <strong>Journey</strong><br />
AIM (How good By when)<br />
Concept<br />
Measures<br />
Operational Definitions<br />
Data Collection Plan<br />
Data Collection<br />
Analysis<br />
ACTION<br />
Source: R. Lloyd. <strong>Quality</strong> Health Care: A Guide to Developing and Using Indicators. Jones and Bartlett, 2004.<br />
©2012 Institute for Healthcare Improvement/R. Lloyd<br />
Institute for Healthcare Improvement
<strong>The</strong> <strong>Quality</strong> <strong>Measurement</strong> <strong>Journey</strong><br />
AIM (How good By when)<br />
Concept<br />
Measures<br />
Operational Definitions<br />
Data Collection Plan<br />
Data Collection<br />
Analysis<br />
ACTION<br />
Source: R. Lloyd. <strong>Quality</strong> Health Care: A Guide to Developing and Using Indicators. Jones and Bartlett, 2004.<br />
©Copyright 2011 IHI/R. Lloyd<br />
From Concept to Measure<br />
“How will I know that a<br />
change is an improvement”<br />
How can we construct measures that<br />
will usefully and efficiently answer<br />
this question<br />
©Copyright 2011 IHI/R. Lloyd<br />
Institute for Healthcare Improvement
Every concept can have many measures<br />
Concept<br />
Hand Hygiene<br />
Medication Errors<br />
Ventilator Associated<br />
Pneumonias (VAPs)<br />
Potential Measures<br />
Ounces of hand gel used each day<br />
Ounces of gel used per staff<br />
Percent of staff washing their hands<br />
(before & after visiting a patient)<br />
Percent of inpatients with C.Diff<br />
Percent of errors<br />
Number of errors<br />
Medication error rate<br />
Percent of patients with a VAP<br />
Number of VAPs in a month<br />
<strong>The</strong> number of days without a VAP<br />
Compliance with the ventilator bundle<br />
Source: R. Lloyd. <strong>Quality</strong> Health Care: A Guide to Developing and Using Indicators. Jones and Bartlett, 2004.<br />
©Copyright 2011 IHI/R. Lloyd<br />
Three Types of Measures<br />
(a Family of Measures)<br />
• Outcome Measures: Voice of the customer or patient.<br />
How is the system performing What is the result<br />
• Process Measures: Voice of the workings of the<br />
system. Are the parts/steps in the system performing as<br />
planned<br />
• Balancing Measures: Looking at a system from<br />
different directions/dimensions. What happened to the<br />
system as we improved the outcome and process<br />
measures (e.g. unanticipated consequences, other<br />
factors influencing outcome)<br />
©Copyright 2011 IHI/R. Lloyd<br />
Institute for Healthcare Improvement
Potential Set of Measures for Improvement<br />
in the Accident & Emergency (ER)<br />
Topic<br />
Outcome<br />
Measures<br />
Process<br />
Measures<br />
Balancing<br />
Measures<br />
Improve waiting<br />
time and patient<br />
satisfaction in<br />
the ER<br />
Total Length of<br />
Stay in the ER<br />
<strong>Patient</strong><br />
Satisfaction<br />
Scores<br />
Time to<br />
registration<br />
<strong>Patient</strong> and staff<br />
comments on flow<br />
% patient receiving<br />
discharge<br />
materials<br />
Volumes<br />
% Leaving<br />
without being<br />
seen<br />
Staff satisfaction<br />
Financials<br />
Availability of<br />
antibiotics<br />
©Copyright 2011 IHI/R. Lloyd<br />
Balancing Measures: Looking at the<br />
System from Different Dimensions<br />
• Outcome (quality, time)<br />
• Transaction (volume, no. of patients)<br />
• Productivity (cycle time, efficiency,<br />
utilisation, flow, capacity, demand)<br />
• Financial (charges, staff hours, materials)<br />
• Appropriateness (validity, usefulness)<br />
• <strong>Patient</strong> satisfaction (surveys, customer<br />
complaints)<br />
• Staff satisfaction<br />
©Copyright 2011 IHI/R. Lloyd<br />
Institute for Healthcare Improvement
<strong>The</strong> <strong>Quality</strong> <strong>Measurement</strong> <strong>Journey</strong><br />
AIM (Why are you measuring)<br />
Concept<br />
Measures<br />
Operational Definitions<br />
Data Collection Plan<br />
Data Collection<br />
Analysis<br />
ACTION<br />
Source: R. Lloyd. <strong>Quality</strong> Health Care: A Guide to Developing and Using Indicators. Jones and Bartlett, 2004.<br />
©Copyright 2011 IHI/R. Lloyd<br />
Operational Definitions<br />
“Would you tell me, please, which way I<br />
ought to go from here,” asked Alice<br />
“That depends a good deal on where you<br />
want to get to,” said the Cat.<br />
“I don’t much care where” - said Alice.<br />
“<strong>The</strong>n it doesn’t matter which way you<br />
go,” said the Cat.<br />
From Alice in Wonderland, Brimax Books, London, 1990.<br />
©Copyright 2011 IHI/R. Lloyd<br />
Institute for Healthcare Improvement
An Operational Definition...<br />
… is a<br />
description, in<br />
quantifiable<br />
terms, of what<br />
to measure and<br />
the steps to<br />
follow to<br />
measure it<br />
consistently.<br />
• It gives communicable<br />
meaning to a concept<br />
• Is clear and<br />
unambiguous<br />
• Specifies measurement<br />
methods and equipment<br />
• Identifies criteria<br />
Source: R. Lloyd. <strong>Quality</strong> Health Care: A Guide to Developing and Using Indicators. Jones and Bartlett Publishers, 2004.<br />
11<br />
©Copyright 2011 IHI/R. Lloyd<br />
How do you define the following<br />
healthcare concepts<br />
• World Class Performance • Delayed discharges<br />
• Alcohol related admissions • End of life care<br />
• Teenage pregnancy<br />
• Falls (with/without injuries)<br />
• Cancer waiting times<br />
• Childhood immunizations<br />
• Health inequalities<br />
• Complete maternity service<br />
• Asthma admissions<br />
• <strong>Patient</strong> engagement<br />
• Childhood obesity<br />
• Moving services closer to home<br />
• <strong>Patient</strong> education<br />
• Successful breastfeeding<br />
• Health and wellbeing<br />
• Ambulatory care<br />
• Adding life to years and years to life • Access to health in deprived areas<br />
• Children's palliative care • Diagnostics in the community<br />
• Safe services<br />
• Productive community services<br />
• Smoking cessation<br />
• Vascular inequalities<br />
• Urgent care<br />
• Breakthrough priorities<br />
©Copyright 2011 IHI/R. Lloyd<br />
Institute for Healthcare Improvement
Exercise<br />
Operational Definitions<br />
• Select a measure for your project (it can<br />
be an outcome, process or balancing<br />
measure).<br />
• Evaluate this measure against the<br />
criteria for a “good” operational<br />
definition.<br />
• How well does your measure stand up<br />
• Use the Operational Definition<br />
Worksheet to guide and record your<br />
work.<br />
©Copyright 2011 IHI/R. Lloyd<br />
Operational Definition Worksheet ©<br />
Name of team:_______________________________ Date: _____________<br />
Measure Name<br />
(Provide a specific name such<br />
as medication error rate)<br />
Operational Definition<br />
(Define the measure in very specific terms.<br />
Provide the numerator and the denominator<br />
if a percentage or rate. Indicate what is to be<br />
included and excluded. Be as clear and<br />
unambiguous as possible)<br />
Data Source(s)<br />
(Indicate the sources of<br />
the data. <strong>The</strong>se could<br />
include medical records,<br />
logs, surveys, etc.)<br />
Data<br />
Collection:<br />
•Schedule (daily, weekly,<br />
monthly or quarterly)<br />
•Method (automated<br />
systems, manual, telephone,<br />
etc.)<br />
Baseline<br />
•Period<br />
•Value<br />
Goals<br />
•Short term<br />
•Long term<br />
Source: R. Lloyd. <strong>Quality</strong> Health Care: A Guide to Developing and Using Indicators. Jones and Bartlett, 2004.<br />
©Copyright 2011 IHI/R. Lloyd<br />
Institute for Healthcare Improvement
Source: R. Lloyd. <strong>Quality</strong> Health Care: A Guide to Developing and Using Indicators. Jones and Bartlett, 2004.<br />
NON-SPECIFIC CHEST PAIN PATHWAY MEASUREMENT PLAN<br />
Measure Name<br />
(Provide a specific name such<br />
as medication error rate)<br />
Operational Definition<br />
(Define the measure in very specific<br />
terms.<br />
Provide the numerator and the<br />
denominator if a percentage or rate.<br />
Indicate what is to be included and<br />
excluded. Be as clear and<br />
unambiguous as possible)<br />
Data Source(s)<br />
(Indicate the sources of the<br />
data. <strong>The</strong>se could include<br />
medical records, logs,<br />
surveys, etc.)<br />
Data<br />
Collection:<br />
•Schedule (daily, weekly,<br />
monthly or quarterly)<br />
•Method (automated systems,<br />
manual, telephone, etc.)<br />
Baseline<br />
•Period<br />
•Value<br />
Goals<br />
•Short term<br />
•Long term<br />
Percent of patients who have<br />
MI or Unstable Angina as<br />
diagnosis<br />
Numerator =<br />
<strong>Patient</strong>s entered into the NSCP<br />
pathway each month who have Acute<br />
MI or Unstable Angina as the<br />
discharge diagnosis<br />
Denominator =<br />
All patients entered into the NSCP<br />
pathway each month<br />
1.Medical Records<br />
2.Midas data system<br />
3.Variance Tracking Form<br />
1.Discharge diagnosis will be<br />
identified for all patients entered<br />
into the NSCP pathway<br />
2.QA-URwill retrospectively<br />
review charts of all patients<br />
entered into the NSCP pathway.<br />
Data will be entered into MIDAS<br />
system<br />
1.Currently<br />
collecting<br />
baseline data.<br />
2.Baseline<br />
will be<br />
completed by<br />
end of 1 st Q<br />
2012<br />
Once the baseline of<br />
missed diagnosis is<br />
calculated short and<br />
long term reductions<br />
will be established as<br />
the goals<br />
Number of patients who are<br />
admitted to the hospital or seen<br />
in an ED due to chest pain<br />
within one week of when we<br />
discharged them<br />
A patient that we saw in our ED who<br />
reports during the call-back interview<br />
that they have been admitted or seen in<br />
an ED (ours or some other ED) for<br />
chest pain during the past week<br />
All patients who have been<br />
managed within the NSCP<br />
protocol throughout their<br />
hospital stay<br />
1.<strong>Patient</strong>s will be contacted by<br />
phone one week after discharge<br />
2.Call-back interview will be the<br />
method<br />
1.Currently<br />
collecting<br />
baseline data.<br />
2.Baseline<br />
will be<br />
completed by<br />
end of 1 st Q<br />
2012<br />
Ultimately the goal<br />
is to have no patients<br />
admitted or seen in<br />
the ED within a<br />
week after discharge.<br />
<strong>The</strong> baseline will be<br />
used to help<br />
establish initial<br />
goals.<br />
Costs per cardiac diagnosis (a<br />
rate)<br />
Numerator =<br />
Total costs each month for hospital<br />
care of NSCP pathway patients<br />
Denominator =<br />
Number of patients each month<br />
entered into the NSCP pathway with a<br />
discharge diagnosis of MI or Unstable<br />
Angina<br />
1.Finance<br />
2.Chart Review<br />
Can be calculated every month<br />
from financial and clinical data<br />
already being collected<br />
1.Months<br />
2011<br />
2.Will be<br />
computed<br />
within 10<br />
days of the<br />
close of the<br />
previous<br />
month<br />
<strong>The</strong> initial goal will<br />
be to reduce the<br />
baseline cost per<br />
case by 5%within<br />
the first six months<br />
of initiating the<br />
project.<br />
©Copyright 2011 IHI/R. Lloyd<br />
<strong>The</strong> <strong>Quality</strong> <strong>Measurement</strong> <strong>Journey</strong><br />
AIM (Why are you measuring)<br />
Concept<br />
Measures<br />
Operational Definitions<br />
Data Collection Plan<br />
Data Collection<br />
Analysis<br />
ACTION<br />
Source: R. Lloyd. <strong>Quality</strong> Health Care: A Guide to Developing and Using Indicators. Jones and Bartlett, 2004.<br />
©Copyright 2011 IHI/R. Lloyd<br />
Institute for Healthcare Improvement
Now that you have selected and defined<br />
your measures, it is time to head out, cast<br />
your net and actually gather some data!<br />
©Copyright 2011 IHI/R. Lloyd<br />
Key Data Collection Strategies<br />
Stratification<br />
• Separation & classification<br />
of data according to<br />
predetermined categories<br />
• Designed to discover<br />
patterns in the data<br />
• For example, are there<br />
differences by shift, time of<br />
day, day of week, severity<br />
of patients, age, gender or<br />
type of procedure<br />
• Consider stratification<br />
BEFORE you collect the<br />
data<br />
Sampling Strategies<br />
• Systematic sampling<br />
• Simple random sampling<br />
• Stratified sampling<br />
• Proportional stratified<br />
random sampling<br />
• Quota sampling<br />
• Judgment sampling<br />
• Convenience sampling<br />
• Knowledge of sampling<br />
techniques will make data<br />
collection much easier and<br />
less time consuming<br />
©Copyright 2011 IHI/R. Lloyd<br />
Institute for Healthcare Improvement
Examples of Stratification Problems<br />
©Copyright 2011 IHI/R. Lloyd<br />
Sampling Methods<br />
Probability Sampling Methods<br />
• Simple random sampling<br />
• Stratified random sampling<br />
• Stratified proportional random sampling<br />
• Systematic sampling<br />
• Cluster sampling<br />
Non-probability Sampling Methods<br />
• Convenience sampling<br />
• Quota sampling<br />
• Judgment sampling<br />
©Copyright 2011 IHI/R. Lloyd<br />
Institute for Healthcare Improvement
<strong>The</strong> <strong>Quality</strong> <strong>Measurement</strong> <strong>Journey</strong><br />
AIM (Why are you measuring)<br />
Concept<br />
Measures<br />
Operational Definitions<br />
Data Collection Plan<br />
Data Collection<br />
Analysis<br />
ACTION<br />
Source: R. Lloyd. <strong>Quality</strong> Health Care: A Guide to Developing and Using Indicators. Jones and Bartlett, 2004.<br />
©Copyright 2011 IHI/R. Lloyd<br />
You have<br />
performance data.<br />
Now what the heck<br />
do you do with it<br />
22<br />
©Copyright 2011 IHI/R. Lloyd<br />
Institute for Healthcare Improvement
“If I had to reduce<br />
my message for<br />
management to just<br />
a few words, I’d say<br />
it all had to do with<br />
reducing variation.”<br />
W. Edwards Deming<br />
23<br />
©Copyright 2011 IHI/R. Lloyd<br />
<strong>The</strong> Problem<br />
Aggregated data presented in<br />
tabular formats or with summary<br />
statistics, will not help you<br />
measure the impact of process<br />
improvement/redesign efforts.<br />
Aggregated data can only lead to<br />
judgment, not to improvement!<br />
24<br />
©Copyright 2011 IHI/R. Lloyd<br />
Institute for Healthcare Improvement
Average CABG Mortality<br />
Before and After the Implementation of a New Protocol<br />
25<br />
5.2<br />
Percent Mortality<br />
3.8<br />
5.0%<br />
WOW!<br />
A “significant drop”<br />
from 5% to 4%<br />
4.0%<br />
Time 1 Time 2<br />
Conclusion -<strong>The</strong> protocol was a success!<br />
A 20% drop in the average mortality!<br />
©Copyright 2011 IHI/R. Lloyd<br />
Average CABG Mortality<br />
Before and After the Implementation of a New Protocol A Second Look at the Data<br />
9.0<br />
Protocol implemented here<br />
Percent Mortality<br />
5.0<br />
1.0<br />
UCL= 6.0<br />
CL = 4.0<br />
LCL = 2.0<br />
24 Months<br />
Now what do you conclude about the impact of the protocol<br />
26<br />
©Copyright 2011 IHI/R. Lloyd<br />
Institute for Healthcare Improvement
<strong>The</strong> average of a set of numbers can be<br />
created by many different distributions<br />
Measure<br />
X<br />
(CL)<br />
Time<br />
27<br />
©Copyright 2011 IHI/R. Lloyd<br />
If you don’t understand the variation that<br />
lives in your data, you will be tempted to ...<br />
• Deny the data (It doesn’t fit my view of<br />
reality!)<br />
• See trends where there are no trends<br />
• Try to explain natural variation as special<br />
events<br />
• Blame and give credit to people for things<br />
over which they have no control<br />
• Distort the process that produced the data<br />
• Kill the messenger!<br />
28<br />
©Copyright 2011 IHI/R. Lloyd<br />
Institute for Healthcare Improvement
Dr. Walter A Shewhart<br />
Shewhart - Economic Control of <strong>Quality</strong> of<br />
Manufactured Product, 1931.<br />
“A phenomenon<br />
will be said to be<br />
controlled when,<br />
through the use of<br />
past experience,<br />
we can predict, at<br />
least within limits,<br />
how the<br />
phenomenon may<br />
be expected to vary<br />
in the future”<br />
©Copyright 2011 IHI/R. Lloyd<br />
“What is the variation in one system<br />
over time” Walter A. Shewhart - early 1920’s, Bell Laboratories<br />
Dynamic View<br />
UCL<br />
Static View<br />
time<br />
LCL<br />
Every process displays variation:<br />
• Controlled variation<br />
stable, consistent pattern of variation<br />
“chance”, constant causes<br />
30<br />
Static View<br />
• Special cause variation<br />
“assignable”<br />
pattern changes over time<br />
©Copyright 2011 IHI/R. Lloyd<br />
Institute for Healthcare Improvement
Types of Variation<br />
Common Cause Variation<br />
• Is inherent in the design of the<br />
process<br />
• Is due to regular, natural or<br />
ordinary causes<br />
• Affects all the outcomes of a<br />
process<br />
• Results in a “stable” process that<br />
is predictable<br />
• Also known as random or<br />
unassignable variation<br />
Special Cause Variation<br />
• Is due to irregular or unnatural<br />
causes that are not inherent in<br />
the design of the process<br />
• Affect some, but not necessarily<br />
all aspects of the process<br />
• Results in an “unstable”<br />
process that is not predictable<br />
• Also known as non-random or<br />
assignable variation<br />
31<br />
©Copyright 2011 IHI/R. Lloyd<br />
Point …<br />
Common Cause does not mean “Good Variation.” It only means<br />
that the process is stable and predictable. For example, if a<br />
patient’s systolic blood pressure averaged around 165 and was<br />
usually between 160 and 170 mmHg, this might be stable and<br />
predictable but completely unacceptable.<br />
Similarly Special Cause variation should not be viewed as “Bad<br />
Variation.” You could have a special cause that represents a very<br />
good result (e.g., a low turnaround time), which you would want to<br />
emulate. Special Cause merely means that the process is unstable<br />
and unpredictable.<br />
You have to decide if the output of the process is<br />
acceptable!<br />
©Copyright 2011 IHI/R. Lloyd<br />
Institute for Healthcare Improvement
Unplanned Returns to Ed w/in 72 Hours<br />
Month M A M J J A S O N D J F M A M J J A S<br />
ED/100 41.78 43.89 39.86 40.03 38.01 43.43 39.21 41 .90 41.78 43.00 39.66 40.03 48.21 43.89 39.86 36.21 41.78 43.89 31.45<br />
Retur ns 17 26 13 16 24 27 19 14 33 20 17 22 29 17 36 19 22 24 22<br />
u chart<br />
1.2<br />
chart<br />
1.0<br />
0.8<br />
0.6<br />
0.4<br />
0.2<br />
0.0<br />
1<br />
UCL = 0 .88<br />
Mean = 0.54<br />
LCL = 0.19<br />
2<br />
3<br />
4<br />
5<br />
6<br />
7<br />
8<br />
9<br />
10<br />
11<br />
12<br />
13<br />
14<br />
15<br />
16<br />
17<br />
18<br />
19<br />
How can I depict variation<br />
Rate per 100 ED <strong>Patient</strong>s<br />
33<br />
STATIC VIEW<br />
Descriptive Statistics<br />
Mean, Median & Mode<br />
Minimum/Maximum/Range<br />
Standard Deviation<br />
Bar graphs/Pie charts<br />
DYNAMIC VIEW<br />
Run Chart<br />
Control Chart<br />
(plot data over time)<br />
Statistical Process Control (SPC)<br />
©Copyright 2011 IHI/R. Lloyd<br />
<strong>The</strong> SPC Pioneers<br />
W. Edwards<br />
Deming<br />
(1900 - 1993)<br />
Walter<br />
Shewhart<br />
(1891 – 1967)<br />
Joseph Juran<br />
(1904 - 2008)<br />
©Copyright 2011 IHI/R. Lloyd<br />
Institute for Healthcare Improvement
How do we analyze variation for<br />
quality improvement<br />
Run and Control Charts<br />
are the best tools to<br />
determine if our<br />
improvement strategies<br />
have had the desired<br />
effect.<br />
35<br />
©Copyright 2011 IHI/R. Lloyd<br />
Elements of a Run Chart<br />
6.00<br />
5.75<br />
5.50<br />
<strong>The</strong> centerline (CL) on a<br />
Run Chart is the Median<br />
Measure<br />
Pounds of Red Bag Waste<br />
5.25<br />
5.00<br />
4.75<br />
4.50<br />
4.25<br />
4.00<br />
Median=4.610<br />
~<br />
X (CL)<br />
3.75<br />
3.50<br />
3.25<br />
Time<br />
1 2 3 4 5 6 7 8 9 10 11 12 13 14 15 16 17 18 19 20 21 22 23 24 25 26 27 28 29<br />
Point Number<br />
Four simple run rules are used to determine if<br />
non-random data patterns are present<br />
©Copyright 2011 IHI/R. Lloyd<br />
Institute for Healthcare Improvement
Elements of a Shewhart<br />
Control Chart<br />
50.0<br />
45.0<br />
40.0<br />
(Upper Control Limit)<br />
UCL=44.855<br />
A<br />
Measure<br />
Number of Complaints<br />
35.0<br />
30.0<br />
25.0<br />
20.0<br />
15.0<br />
10.0<br />
An indication of<br />
a special cause<br />
B<br />
C<br />
CL=29.250<br />
C<br />
B<br />
A<br />
X (Mean)<br />
LCL=13.645<br />
(Lower Control Limit)<br />
5.0<br />
Jan01 Mar01 May01 July01 Sept01 Nov01 Jan02 Mar02 May02 July02 Sept02 Nov02<br />
Time<br />
Month<br />
©Copyright 2011 IHI/R. Lloyd<br />
Run and Control Charts<br />
don’t tell you<br />
• <strong>The</strong> reasons(s) for a Special Cause<br />
• Whether or not a Common Cause process<br />
should be improved (Is the performance of<br />
the process acceptable)<br />
• How the process should actually be<br />
improved or redesigned<br />
©Copyright 2011 IHI/R. Lloyd<br />
Institute for Healthcare Improvement
<strong>The</strong> Sequence for Improvement<br />
Test under<br />
a variety of<br />
conditions<br />
Make part<br />
of routine<br />
operations<br />
Implementing a<br />
change<br />
Sustaining<br />
improvements and<br />
Spreading the changes<br />
to other locations<br />
<strong>The</strong>ory<br />
and<br />
Prediction<br />
Developing a<br />
change<br />
Testing a<br />
change<br />
Act<br />
Study<br />
Plan<br />
Do<br />
©2012 Institute for Healthcare Improvement/R. Lloyd<br />
General References on <strong>Quality</strong><br />
• <strong>The</strong> Improvement Guide: A Practical Approach to Enhancing<br />
Organizational Performance. G. Langley, K. Nolan, T. Nolan, C. Norman,<br />
L. Provost. Jossey-Bass Publishers., San Francisco, 1996.<br />
• <strong>Quality</strong> Improvement Through Planned Experimentation. 2nd edition. R.<br />
Moen, T. Nolan, L. Provost, McGraw-Hill, NY, 1998.<br />
• <strong>The</strong> Improvement Handbook. Associates in Process Improvement.<br />
Austin, TX, January, 2005.<br />
• A Primer on Leading the Improvement of Systems,” Don M. Berwick,<br />
BMJ, 312: pp 619-622, 1996.<br />
• “Accelerating the Pace of Improvement - An Interview with Thomas<br />
Nolan,” Journal of <strong>Quality</strong> Improvement, Volume 23, No. 4, <strong>The</strong> Joint<br />
Commission, April, 1997.<br />
40<br />
©2012 Institute for Healthcare Improvement/R. Lloyd<br />
Institute for Healthcare Improvement
References on <strong>Measurement</strong><br />
• Brook, R. et. al. “Health System Reform and <strong>Quality</strong>.” Journal of<br />
the American Medical Association 276, no. 6 (1996): 476-480.<br />
• Carey, R. and Lloyd, R. Measuring <strong>Quality</strong> Improvement in<br />
healthcare: A Guide to Statistical Process Control Applications.<br />
ASQ Press, Milwaukee, WI, 2001.<br />
• Lloyd, R. <strong>Quality</strong> Health Care: A Guide to Developing and Using<br />
Indicators. Jones and Bartlett Publishers, Sudbury, MA, 2004.<br />
• Nelson, E. et al, “Report Cards or Instrument Panels: Who Needs<br />
What Journal of <strong>Quality</strong> Improvement, Volume 21, Number 4,<br />
April, 1995.<br />
• Provost, L. and Murray, S. <strong>The</strong> Health Care Data Guide. Jossey-<br />
Bass, San Francisco, 2011.<br />
• Solberg. L. et. al. “<strong>The</strong> Three Faces of Performance Improvement:<br />
Improvement, Accountability and Research.” Journal of <strong>Quality</strong><br />
Improvement 23, no.3 (1997): 135-147.<br />
41<br />
©2012 Institute for Healthcare Improvement/R. Lloyd<br />
“<strong>Quality</strong> begins with<br />
intent, which is fixed<br />
by management.”<br />
W. E. Deming, Out of the Crisis, p.5<br />
42<br />
©2012 Institute for Healthcare Improvement/R. Lloyd<br />
Institute for Healthcare Improvement
Robert Lloyd, Ph.D.<br />
Executive Director Performance Improvement<br />
can be reached at:<br />
43<br />
<strong>The</strong> Institute for Healthcare<br />
Improvement<br />
(630) 717-5383 Chicago office<br />
(630) 717-8564 fax<br />
rlloyd@ihi.org<br />
Dr. Lloyd’s books, Measuring <strong>Quality</strong> Improvement in Healthcare: A<br />
Guide to Statistical Process Control Applications and <strong>Quality</strong><br />
HealthCare: A Guide to Developing and Using Indicators, can be<br />
obtained from ASQ Press (800) 248-1948 and Jones & Bartlett<br />
Publishing (800) 832-0034 respectively.<br />
©2012 Institute for Healthcare Improvement/R. Lloyd<br />
Institute for Healthcare Improvement