
Create successful ePaper yourself
Turn your PDF publications into a flip-book with our unique Google optimized e-Paper software.
Eksploatacja przemysłowa biogazowego zespołu kogeneracyjnego...<br />
the generation of electric energy and heat, and the average<br />
electric and thermal loads (as expressed in MW and referred<br />
to the rated powers) and the availability of the Cogeneration<br />
Set, as broken down into individual years of operation, are<br />
illustrated in Fig. 4.<br />
The visible in Fig. 4 decrease in electric energy and heat<br />
generation in 2011 compared to the preceding years was<br />
cause, among other things, by the already mentioned over<br />
week-long planned maintenance shutdown of the CHP Set at<br />
the turn of May and June 2011 and the previously mentioned<br />
four-day emergency outage in February 2011. The average<br />
hourly electric and thermal load of the CHP Biogas Set as<br />
represented on a monthly basis and for the entire previous<br />
period of its operation, respectively, is shown in Fig. 5.<br />
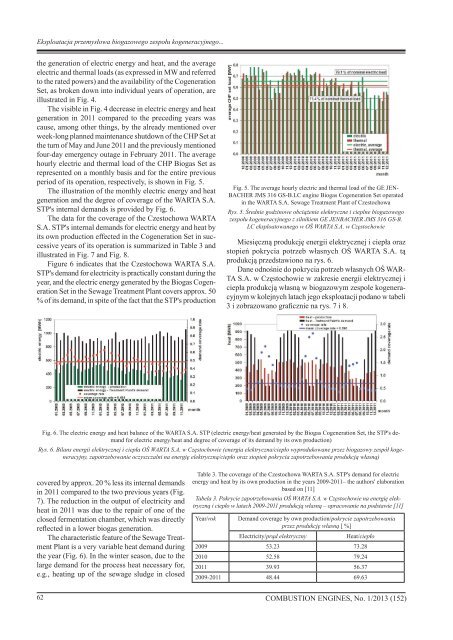
The illustration of the monthly electric energy and heat<br />
generation and the degree of coverage of the WARTA S.A.<br />
STP's internal demands is provided by Fig. 6.<br />
The data for the coverage of the Czestochowa WARTA<br />
S.A. STP's internal demands for electric energy and heat by<br />
its own production effected in the Cogeneration Set in successive<br />
years of its operation is summarized in Table 3 and<br />
illustrated in Fig. 7 and Fig. 8.<br />
Figure 6 indicates that the Czestochowa WARTA S.A.<br />
STP's demand for electricity is practically constant during the<br />
year, and the electric energy generated by the Biogas Cogeneration<br />
Set in the Sewage Treatment Plant covers approx. 50<br />
% of its demand, in spite of the fact that the STP's production<br />
Fig. 5. The average hourly electric and thermal load of the GE JEN-<br />
BACHER JMS 316 GS-B.LC engine Biogas Cogeneration Set operated<br />
in the WARTA S.A. Sewage Treatment Plant of Czestochowa<br />
Rys. 5. Średnie godzinowe obciążenie elektryczne i cieplne biogazowego<br />
zespołu kogeneracyjnego z silnikiem GE JENBACHER JMS 316 GS-B.<br />
LC eksploatowanego w OŚ WARTA S.A. w Częstochowie<br />
Miesięczną produkcję energii elektrycznej i ciepła oraz<br />
stopień pokrycia potrzeb własnych OŚ WARTA S.A. tą<br />
produkcją przedstawiono na rys. 6.<br />
Dane odnośnie do pokrycia potrzeb własnych OŚ WAR-<br />
TA S.A. w Częstochowie w zakresie energii elektrycznej i<br />
ciepła produkcją własną w biogazowym zespole kogeneracyjnym<br />
w kolejnych latach jego eksploatacji podano w tabeli<br />
3 i zobrazowano graficznie na rys. 7 i 8.<br />
Fig. 6. The electric energy and heat balance of the WARTA S.A. STP (electric energy/heat generated by the Biogas Cogeneration Set, the STP's demand<br />
for electric energy/heat and degree of coverage of its demand by its own production)<br />
Rys. 6. Bilans energii elektrycznej i ciepła OŚ WARTA S.A. w Częstochowie (energia elektryczna/ciepło wyprodukowane przez biogazowy zespół kogeneracyjny,<br />
zapotrzebowanie oczyszczalni na energię elektryczną/ciepło oraz stopień pokrycia zapotrzebowania produkcją własną)<br />
covered by approx. 20 % less its internal demands<br />
in 2011 compared to the two previous years (Fig.<br />
7). The reduction in the output of electricity and<br />
heat in 2011 was due to the repair of one of the<br />
closed fermentation chamber, which was directly<br />
reflected in a lower biogas generation.<br />
The characteristic feature of the Sewage Treatment<br />
Plant is a very variable heat demand during<br />
the year (Fig. 6). In the winter season, due to the<br />
large demand for the process heat necessary for,<br />
e.g., heating up of the sewage sludge in closed<br />
Table 3. The coverage of the Czestochowa WARTA S.A. STP's demand for electric<br />
energy and heat by its own production in the years 2009-2011– the authors' elaboration<br />
based on [11]<br />
Tabela 3. Pokrycie zapotrzebowania OŚ WARTA S.A. w Częstochowie na energię elektryczną<br />
i ciepło w latach 2009-2011 produkcją własną – opracowanie na podstawie [11]<br />
Year/rok<br />
Demand coverage by own production/pokrycie zapotrzebowania<br />
przez produkcję własną [ %]<br />
Electricity/prąd elektryczny<br />
Heat/ciepło<br />
2009 53.23 73.28<br />
2010 52.58 79.24<br />
2011 39.93 56.37<br />
2009-2011 48.44 69.63<br />
62 <strong>COMBUSTION</strong> <strong>ENGINES</strong>, No. 1/2013 (152)