Global entrepreneurship report - ResearchGate
Global entrepreneurship report - ResearchGate
Global entrepreneurship report - ResearchGate

You also want an ePaper? Increase the reach of your titles
YUMPU automatically turns print PDFs into web optimized ePapers that Google loves.
Changes in Entrepreneurial<br />
Activity Over Time<br />
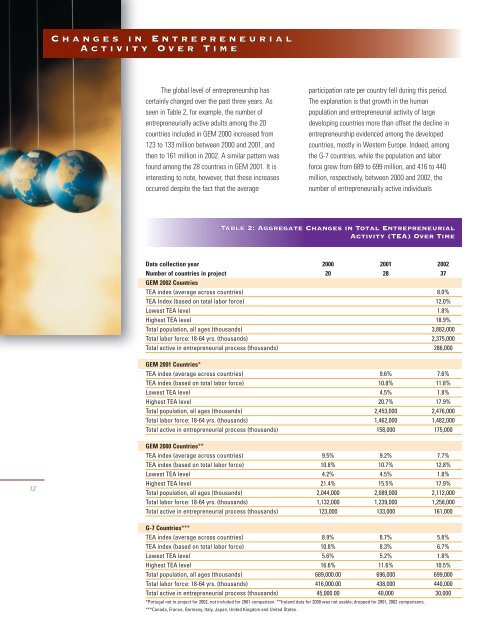
The global level of <strong>entrepreneurship</strong> has<br />
certainly changed over the past three years. As<br />
seen in Table 2, for example, the number of<br />
entrepreneurially active adults among the 20<br />
countries included in GEM 2000 increased from<br />
123 to 133 million between 2000 and 2001, and<br />
then to 161 million in 2002. A similar pattern was<br />
found among the 28 countries in GEM 2001. It is<br />
interesting to note, however, that these increases<br />
occurred despite the fact that the average<br />
participation rate per country fell during this period.<br />
The explanation is that growth in the human<br />
population and entrepreneurial activity of large<br />
developing countries more than offset the decline in<br />
<strong>entrepreneurship</strong> evidenced among the developed<br />
countries, mostly in Western Europe. Indeed, among<br />
the G-7 countries, while the population and labor<br />
force grew from 689 to 699 million, and 416 to 440<br />
million, respectively, between 2000 and 2002, the<br />
number of entrepreneurially active individuals<br />
Table 2: Aggregate Changes in Total Entrepreneurial<br />
Activity (TEA) Over Time<br />
Data collection year 2000 2001 2002<br />
Number of countries in project 20 28 37<br />
GEM 2002 Countries<br />
TEA index (average across countries) 8.0%<br />
TEA Index (based on total labor force) 12.0%<br />
Lowest TEA level 1.8%<br />
Highest TEA level 18.9%<br />
Total population, all ages (thousands) 3,882,000<br />
Total labor force: 18-64 yrs. (thousands) 2,375,000<br />
Total active in entrepreneurial process (thousands) 286,000<br />
GEM 2001 Countries*<br />
TEA index (average across countries) 9.6% 7.6%<br />
TEA index (based on total labor force) 10.8% 11.8%<br />
Lowest TEA level 4.5% 1.8%<br />
Highest TEA level 20.7% 17.9%<br />
Total population, all ages (thousands) 2,453,000 2,476,000<br />
Total labor force: 18-64 yrs. (thousands) 1,462,000 1,482,000<br />
Total active in entrepreneurial process (thousands) 158,000 175,000<br />
12<br />
GEM 2000 Countries**<br />
TEA index (average across countries) 9.5% 9.2% 7.7%<br />
TEA index (based on total labor force) 10.8% 10.7% 12.8%<br />
Lowest TEA level 4.2% 4.5% 1.8%<br />
Highest TEA level 21.4% 15.5% 17.9%<br />
Total population, all ages (thousands) 2,044,000 2,089,000 2,112,000<br />
Total labor force: 18-64 yrs. (thousands) 1,132,000 1,239,000 1,258,000<br />
Total active in entrepreneurial process (thousands) 123,000 133,000 161,000<br />
G-7 Countries***<br />
TEA index (average across countries) 8.9% 8.7% 5.8%<br />
TEA index (based on total labor force) 10.8% 8.3% 6.7%<br />
Lowest TEA level 5.6% 5.2% 1.8%<br />
Highest TEA level 16.6% 11.6% 10.5%<br />
Total population, all ages (thousands) 689,000.00 696,000 699,000<br />
Total labor force: 18-64 yrs. (thousands) 416,000.00 438,000 440,000<br />
Total active in entrepreneurial process (thousands) 45,000.00 40,000 30,000<br />
*Portugal not in project for 2002, not included for 2001 comparison. **Ireland data for 2000 was not usable; dropped for 2001, 2002 comparisons.<br />
***Canada, France, Germany, Italy, Japan, United Kingdom and United States.