Selecting the Right Objective Measure for Association Analysis*
Selecting the Right Objective Measure for Association Analysis*
Selecting the Right Objective Measure for Association Analysis*

Create successful ePaper yourself
Turn your PDF publications into a flip-book with our unique Google optimized e-Paper software.
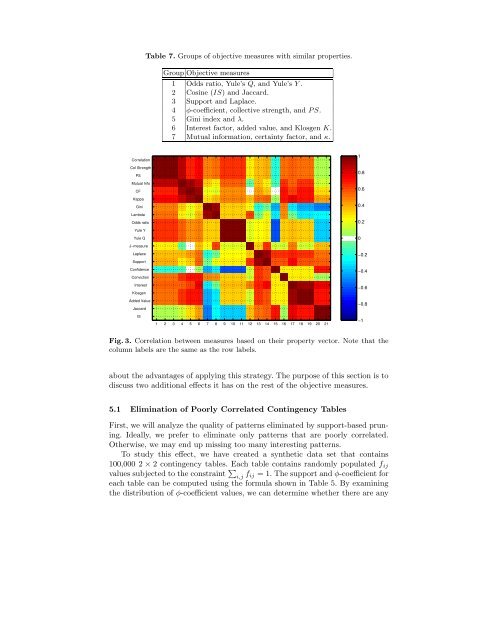
Table 7. Groups of objective measures with similar properties.<br />
Group <strong>Objective</strong> measures<br />
1 Odds ratio, Yule’s Q, and Yule’s Y .<br />
2 Cosine (IS) and Jaccard.<br />
3 Support and Laplace.<br />
4 φ-coefficient, collective strength, and P S.<br />
5 Gini index and λ.<br />
6 Interest factor, added value, and Klosgen K.<br />
7 Mutual in<strong>for</strong>mation, certainty factor, and κ.<br />
Correlation<br />
Col Strength<br />
PS<br />
Mutual Info<br />
CF<br />
Kappa<br />
Gini<br />
Lambda<br />
Odds ratio<br />
Yule Y<br />
Yule Q<br />
J−measure<br />
Laplace<br />
Support<br />
Confidence<br />
Conviction<br />
Interest<br />
Klosgen<br />
Added Value<br />
Jaccard<br />
IS<br />
1 2 3 4 5 6 7 8 9 10 11 12 13 14 15 16 17 18 19 20 21<br />
1<br />
0.8<br />
0.6<br />
0.4<br />
0.2<br />
0<br />
−0.2<br />
−0.4<br />
−0.6<br />
−0.8<br />
−1<br />
Fig. 3. Correlation between measures based on <strong>the</strong>ir property vector. Note that <strong>the</strong><br />
column labels are <strong>the</strong> same as <strong>the</strong> row labels.<br />
about <strong>the</strong> advantages of applying this strategy. The purpose of this section is to<br />
discuss two additional effects it has on <strong>the</strong> rest of <strong>the</strong> objective measures.<br />
5.1 Elimination of Poorly Correlated Contingency Tables<br />
First, we will analyze <strong>the</strong> quality of patterns eliminated by support-based pruning.<br />
Ideally, we prefer to eliminate only patterns that are poorly correlated.<br />
O<strong>the</strong>rwise, we may end up missing too many interesting patterns.<br />
To study this effect, we have created a syn<strong>the</strong>tic data set that contains<br />
100,000 2 × 2 contingency tables. Each table contains randomly populated f ij<br />
values subjected to <strong>the</strong> constraint ∑ i,j f ij = 1. The support and φ-coefficient <strong>for</strong><br />
each table can be computed using <strong>the</strong> <strong>for</strong>mula shown in Table 5. By examining<br />
<strong>the</strong> distribution of φ-coefficient values, we can determine whe<strong>the</strong>r <strong>the</strong>re are any