Selecting the Right Objective Measure for Association Analysis*
Selecting the Right Objective Measure for Association Analysis*
Selecting the Right Objective Measure for Association Analysis*

You also want an ePaper? Increase the reach of your titles
YUMPU automatically turns print PDFs into web optimized ePapers that Google loves.
6.3 Consistency of <strong>Measure</strong>s under Table Standardization<br />
Interestingly, <strong>the</strong> consequence of doing standardization goes beyond ensuring<br />
uni<strong>for</strong>m margins in a contingency table. More importantly, if we apply different<br />
measures from Table 5 on <strong>the</strong> standardized, positively-correlated tables, <strong>the</strong>ir<br />
rankings become identical. To <strong>the</strong> best of our knowledge, this fact has not been<br />
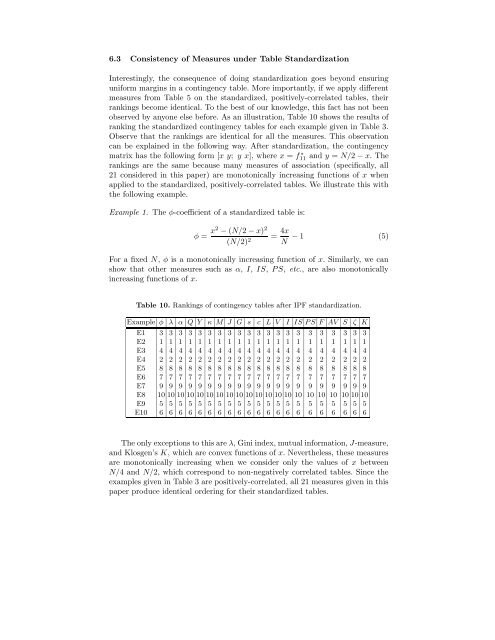
observed by anyone else be<strong>for</strong>e. As an illustration, Table 10 shows <strong>the</strong> results of<br />
ranking <strong>the</strong> standardized contingency tables <strong>for</strong> each example given in Table 3.<br />
Observe that <strong>the</strong> rankings are identical <strong>for</strong> all <strong>the</strong> measures. This observation<br />
can be explained in <strong>the</strong> following way. After standardization, <strong>the</strong> contingency<br />
matrix has <strong>the</strong> following <strong>for</strong>m [x y; y x], where x = f ∗ 11 and y = N/2 − x. The<br />
rankings are <strong>the</strong> same because many measures of association (specifically, all<br />
21 considered in this paper) are monotonically increasing functions of x when<br />
applied to <strong>the</strong> standardized, positively-correlated tables. We illustrate this with<br />
<strong>the</strong> following example.<br />
Example 1. The φ-coefficient of a standardized table is:<br />
φ = x2 − (N/2 − x) 2<br />
(N/2) 2<br />
= 4x<br />
N − 1 (5)<br />
For a fixed N, φ is a monotonically increasing function of x. Similarly, we can<br />
show that o<strong>the</strong>r measures such as α, I, IS, P S, etc., are also monotonically<br />
increasing functions of x.<br />
Table 10. Rankings of contingency tables after IPF standardization.<br />
Example φ λ α Q Y κ M J G s c L V I IS P S F AV S ζ K<br />
E1 3 3 3 3 3 3 3 3 3 3 3 3 3 3 3 3 3 3 3 3 3<br />
E2 1 1 1 1 1 1 1 1 1 1 1 1 1 1 1 1 1 1 1 1 1<br />
E3 4 4 4 4 4 4 4 4 4 4 4 4 4 4 4 4 4 4 4 4 4<br />
E4 2 2 2 2 2 2 2 2 2 2 2 2 2 2 2 2 2 2 2 2 2<br />
E5 8 8 8 8 8 8 8 8 8 8 8 8 8 8 8 8 8 8 8 8 8<br />
E6 7 7 7 7 7 7 7 7 7 7 7 7 7 7 7 7 7 7 7 7 7<br />
E7 9 9 9 9 9 9 9 9 9 9 9 9 9 9 9 9 9 9 9 9 9<br />
E8 10 10 10 10 10 10 10 10 10 10 10 10 10 10 10 10 10 10 10 10 10<br />
E9 5 5 5 5 5 5 5 5 5 5 5 5 5 5 5 5 5 5 5 5 5<br />
E10 6 6 6 6 6 6 6 6 6 6 6 6 6 6 6 6 6 6 6 6 6<br />
The only exceptions to this are λ, Gini index, mutual in<strong>for</strong>mation, J-measure,<br />
and Klosgen’s K, which are convex functions of x. Never<strong>the</strong>less, <strong>the</strong>se measures<br />
are monotonically increasing when we consider only <strong>the</strong> values of x between<br />
N/4 and N/2, which correspond to non-negatively correlated tables. Since <strong>the</strong><br />
examples given in Table 3 are positively-correlated, all 21 measures given in this<br />
paper produce identical ordering <strong>for</strong> <strong>the</strong>ir standardized tables.