Selecting the Right Objective Measure for Association Analysis*
Selecting the Right Objective Measure for Association Analysis*
Selecting the Right Objective Measure for Association Analysis*

Create successful ePaper yourself
Turn your PDF publications into a flip-book with our unique Google optimized e-Paper software.
10000<br />
All contingency tables<br />
7000<br />
Tables with support > 0.9<br />
8000<br />
6000<br />
5000<br />
Count<br />
6000<br />
4000<br />
2000<br />
0<br />
−1 −0.5 0 0.5 1<br />
φ<br />
Count<br />
4000<br />
3000<br />
2000<br />
1000<br />
0<br />
−1 −0.5 0 0.5 1<br />
φ<br />
7000<br />
Tables with support > 0.7<br />
7000<br />
Tables with support > 0.5<br />
6000<br />
6000<br />
5000<br />
5000<br />
Count<br />
4000<br />
3000<br />
Count<br />
4000<br />
3000<br />
2000<br />
2000<br />
1000<br />
1000<br />
0<br />
−1 −0.5 0 0.5 1<br />
φ<br />
0<br />
−1 −0.5 0 0.5 1<br />
φ<br />
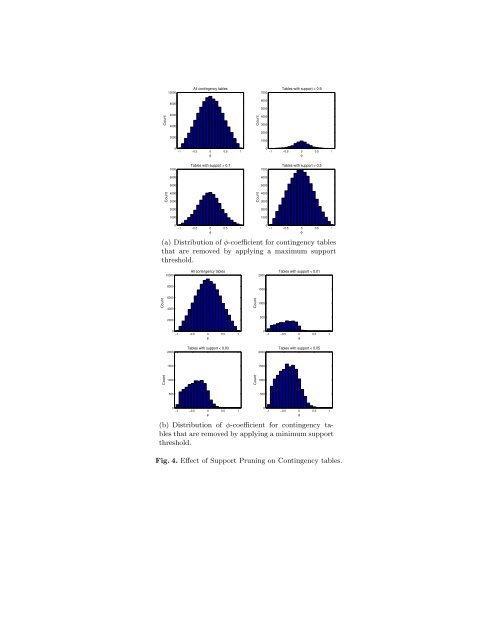
(a) Distribution of φ-coefficient <strong>for</strong> contingency tables<br />
that are removed by applying a maximum support<br />
threshold.<br />
10000<br />
All contingency tables<br />
2000<br />
Tables with support < 0.01<br />
8000<br />
1500<br />
Count<br />
6000<br />
4000<br />
Count<br />
1000<br />
2000<br />
500<br />
0<br />
−1 −0.5 0 0.5 1<br />
φ<br />
0<br />
−1 −0.5 0 0.5 1<br />
φ<br />
2000<br />
Tables with support < 0.03<br />
2000<br />
Tables with support < 0.05<br />
1500<br />
1500<br />
Count<br />
1000<br />
Count<br />
1000<br />
500<br />
500<br />
0<br />
−1 −0.5 0 0.5 1<br />
φ<br />
0<br />
−1 −0.5 0 0.5 1<br />
φ<br />
(b) Distribution of φ-coefficient <strong>for</strong> contingency tables<br />
that are removed by applying a minimum support<br />
threshold.<br />
Fig. 4. Effect of Support Pruning on Contingency tables.