Selecting the Right Objective Measure for Association Analysis*
Selecting the Right Objective Measure for Association Analysis*
Selecting the Right Objective Measure for Association Analysis*

You also want an ePaper? Increase the reach of your titles
YUMPU automatically turns print PDFs into web optimized ePapers that Google loves.
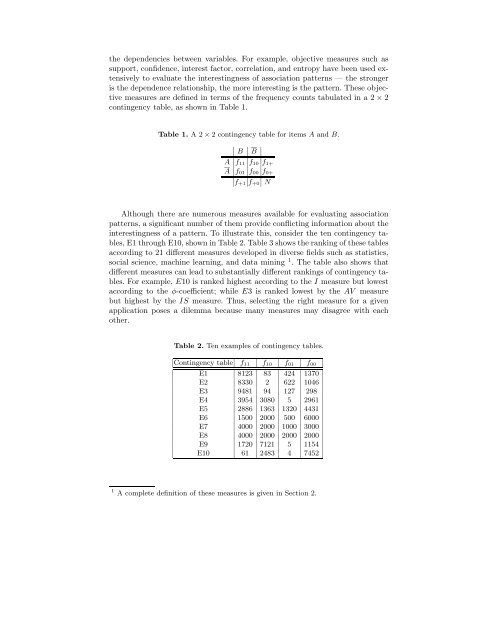
<strong>the</strong> dependencies between variables. For example, objective measures such as<br />
support, confidence, interest factor, correlation, and entropy have been used extensively<br />
to evaluate <strong>the</strong> interestingness of association patterns — <strong>the</strong> stronger<br />
is <strong>the</strong> dependence relationship, <strong>the</strong> more interesting is <strong>the</strong> pattern. These objective<br />
measures are defined in terms of <strong>the</strong> frequency counts tabulated in a 2 × 2<br />
contingency table, as shown in Table 1.<br />
Table 1. A 2 × 2 contingency table <strong>for</strong> items A and B.<br />
B<br />
B<br />
A f 11 f 10 f 1+<br />
A f 01 f 00 f 0+<br />
f +1 f +0 N<br />
Although <strong>the</strong>re are numerous measures available <strong>for</strong> evaluating association<br />
patterns, a significant number of <strong>the</strong>m provide conflicting in<strong>for</strong>mation about <strong>the</strong><br />
interestingness of a pattern. To illustrate this, consider <strong>the</strong> ten contingency tables,<br />
E1 through E10, shown in Table 2. Table 3 shows <strong>the</strong> ranking of <strong>the</strong>se tables<br />
according to 21 different measures developed in diverse fields such as statistics,<br />
social science, machine learning, and data mining 1 . The table also shows that<br />
different measures can lead to substantially different rankings of contingency tables.<br />
For example, E10 is ranked highest according to <strong>the</strong> I measure but lowest<br />
according to <strong>the</strong> φ-coefficient; while E3 is ranked lowest by <strong>the</strong> AV measure<br />
but highest by <strong>the</strong> IS measure. Thus, selecting <strong>the</strong> right measure <strong>for</strong> a given<br />
application poses a dilemma because many measures may disagree with each<br />
o<strong>the</strong>r.<br />
Table 2. Ten examples of contingency tables.<br />
Contingency table f 11 f 10 f 01 f 00<br />
E1 8123 83 424 1370<br />
E2 8330 2 622 1046<br />
E3 9481 94 127 298<br />
E4 3954 3080 5 2961<br />
E5 2886 1363 1320 4431<br />
E6 1500 2000 500 6000<br />
E7 4000 2000 1000 3000<br />
E8 4000 2000 2000 2000<br />
E9 1720 7121 5 1154<br />
E10 61 2483 4 7452<br />
1 A complete definition of <strong>the</strong>se measures is given in Section 2.