Selecting the Right Objective Measure for Association Analysis*
Selecting the Right Objective Measure for Association Analysis*
Selecting the Right Objective Measure for Association Analysis*

You also want an ePaper? Increase the reach of your titles
YUMPU automatically turns print PDFs into web optimized ePapers that Google loves.
Table 12. Data sets used in our experiments.<br />
Name Description Number of Variables<br />
re0 Reuters-21578 articles 2886<br />
la1 LA-Times articles 31472<br />
product Retail data 14462<br />
S&P 500 Stock market data 976<br />
E-Com Web data 6664<br />
Census Survey data 59<br />
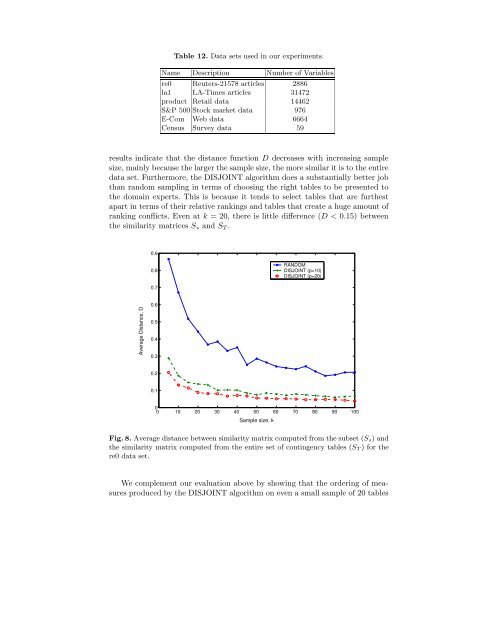
results indicate that <strong>the</strong> distance function D decreases with increasing sample<br />
size, mainly because <strong>the</strong> larger <strong>the</strong> sample size, <strong>the</strong> more similar it is to <strong>the</strong> entire<br />
data set. Fur<strong>the</strong>rmore, <strong>the</strong> DISJOINT algorithm does a substantially better job<br />
than random sampling in terms of choosing <strong>the</strong> right tables to be presented to<br />
<strong>the</strong> domain experts. This is because it tends to select tables that are fur<strong>the</strong>st<br />
apart in terms of <strong>the</strong>ir relative rankings and tables that create a huge amount of<br />
ranking conflicts. Even at k = 20, <strong>the</strong>re is little difference (D < 0.15) between<br />
<strong>the</strong> similarity matrices S s and S T .<br />
0.9<br />
0.8<br />
RANDOM<br />
DISJOINT (p=10)<br />
DISJOINT (p=20)<br />
0.7<br />
Average Distance, D<br />
0.6<br />
0.5<br />
0.4<br />
0.3<br />
0.2<br />
0.1<br />
0<br />
0 10 20 30 40 50 60 70 80 90 100<br />
Sample size, k<br />
Fig. 8. Average distance between similarity matrix computed from <strong>the</strong> subset (S s) and<br />
<strong>the</strong> similarity matrix computed from <strong>the</strong> entire set of contingency tables (S T ) <strong>for</strong> <strong>the</strong><br />
re0 data set.<br />
We complement our evaluation above by showing that <strong>the</strong> ordering of measures<br />
produced by <strong>the</strong> DISJOINT algorithm on even a small sample of 20 tables