Annual Programme of Work 2009 - Ministry of Health
Annual Programme of Work 2009 - Ministry of Health
Annual Programme of Work 2009 - Ministry of Health

Create successful ePaper yourself
Turn your PDF publications into a flip-book with our unique Google optimized e-Paper software.
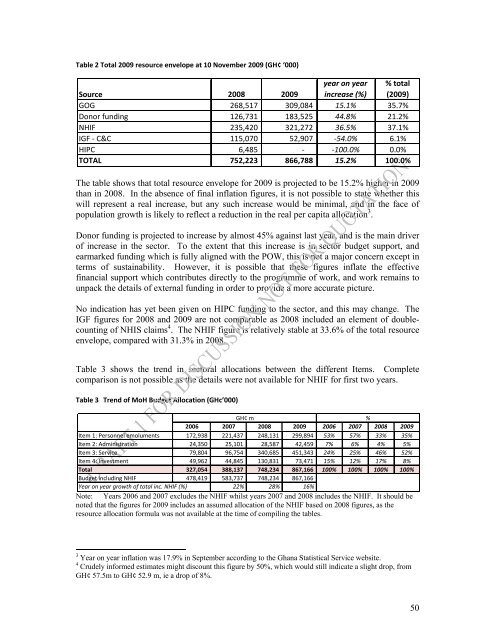
Table 2 Total <strong>2009</strong> resource envelope at 10 November <strong>2009</strong> (GH¢ ‘000)<br />
Source 2008 <strong>2009</strong><br />
year on year<br />
increase (%)<br />
% total<br />
(<strong>2009</strong>)<br />
GOG 268,517 309,084 15.1% 35.7%<br />
Donor funding 126,731 183,525 44.8% 21.2%<br />
NHIF 235,420 321,272 36.5% 37.1%<br />
IGF ‐ C&C 115,070 52,907 ‐54.0% 6.1%<br />
HIPC 6,485 ‐ ‐100.0% 0.0%<br />
TOTAL 752,223 866,788 15.2% 100.0%<br />
The table shows that total resource envelope for <strong>2009</strong> is projected to be 15.2% higher in <strong>2009</strong><br />
than in 2008. In the absence <strong>of</strong> final inflation figures, it is not possible to state whether this<br />
will represent a real increase, but any such increase would be minimal, and in the face <strong>of</strong><br />
population growth is likely to reflect a reduction in the real per capita allocation 3 .<br />
Donor funding is projected to increase by almost 45% against last year, and is the main driver<br />
<strong>of</strong> increase in the sector. To the extent that this increase is in sector budget support, and<br />
earmarked funding which is fully aligned with the POW, this is not a major concern except in<br />
terms <strong>of</strong> sustainability. However, it is possible that these figures inflate the effective<br />
financial support which contributes directly to the programme <strong>of</strong> work, and work remains to<br />
unpack the details <strong>of</strong> external funding in order to provide a more accurate picture.<br />
No indication has yet been given on HIPC funding to the sector, and this may change. The<br />
IGF figures for 2008 and <strong>2009</strong> are not comparable as 2008 included an element <strong>of</strong> doublecounting<br />
<strong>of</strong> NHIS claims 4 . The NHIF figure is relatively stable at 33.6% <strong>of</strong> the total resource<br />
envelope, compared with 31.3% in 2008.<br />
Table 3 shows the trend in sectoral allocations between the different Items. Complete<br />
comparison is not possible as the details were not available for NHIF for first two years.<br />
Table 3 Trend <strong>of</strong> MoH Budget Allocation (GHc’000)<br />
GH¢ m %<br />
2006 2007 2008 <strong>2009</strong> 2006 2007 2008 <strong>2009</strong><br />
Item 1: Personnel emoluments 172,938 221,437 248,131 299,894 53% 57% 33% 35%<br />
Item 2: Administration 24,350 25,101 28,587 42,459 7% 6% 4% 5%<br />
Item 3: Service 79,804 96,754 340,685 451,343 24% 25% 46% 52%<br />
Item 4: Investment 49,962 44,845 130,831 73,471 15% 12% 17% 8%<br />
Total 327,054 388,137 748,234 867,166 100% 100% 100% 100%<br />
Budget including NHIF 478,419 583,737 748,234 867,166<br />
Year on year growth <strong>of</strong> total inc. NHIF (%) 22% 28% 16%<br />
Note: Years 2006 and 2007 excludes the NHIF whilst years 2007 and 2008 includes the NHIF. It should be<br />
noted that the figures for <strong>2009</strong> includes an assumed allocation <strong>of</strong> the NHIF based on 2008 figures, as the<br />
resource allocation formula was not available at the time <strong>of</strong> compiling the tables.<br />
3 Year on year inflation was 17.9% in September according to the Ghana Statistical Service website.<br />
4 Crudely informed estimates might discount this figure by 50%, which would still indicate a slight drop, from<br />
GH¢ 57.5m to GH¢ 52.9 m, ie a drop <strong>of</strong> 8%.<br />
50