Flo-Ware Manual - Hachflow
Flo-Ware Manual - Hachflow
Flo-Ware Manual - Hachflow

Create successful ePaper yourself
Turn your PDF publications into a flip-book with our unique Google optimized e-Paper software.
DOC026.53.80112<br />
<strong>Flo</strong>-<strong>Ware</strong> 4 Software<br />
User <strong>Manual</strong><br />
July 2010, Edition 1<br />
© Hach Company, 2010. All rights reserved. Printed in the U.S.A.
Table of Contents<br />
Section 1 General information.........................................................................................................3<br />
1.1 Product overview..........................................................................................................................3<br />
1.2 PC requirements .........................................................................................................................3<br />
Section 2 Installation..........................................................................................................................5<br />
2.1 Install the files..............................................................................................................................5<br />
2.2 Install updates..............................................................................................................................5<br />
Section 3 Operation............................................................................................................................7<br />
3.1 User interface .............................................................................................................................7<br />
3.2 Raw data......................................................................................................................................7<br />
3.2.1 Edit data .............................................................................................................................8<br />
3.2.2 Export data..........................................................................................................................8<br />
3.2.3 Open data or project files....................................................................................................9<br />
3.2.3.1 Change file properties..............................................................................................11<br />
3.2.3.2 Make a new data file................................................................................................11<br />
3.2.3.3 Delete files................................................................................................................11<br />
3.2.3.4 Copy files to a new location......................................................................................12<br />
3.3 Themes......................................................................................................................................12<br />
3.3.1 Set up themes...................................................................................................................12<br />
3.3.2 Edit site information...........................................................................................................12<br />
3.3.3 Delete a theme..................................................................................................................13<br />
3.3.4 Make a custom theme.......................................................................................................13<br />
3.4 Charts.........................................................................................................................................13<br />
3.4.1 About charts......................................................................................................................13<br />
3.4.2 Set up charts.....................................................................................................................14<br />
3.4.2.1 Change the data range.............................................................................................14<br />
3.4.2.2 Make a template for charts.......................................................................................15<br />
3.4.2.3 Use a chart template................................................................................................15<br />
3.4.3 Print a chart.......................................................................................................................15<br />
3.5 Reports.......................................................................................................................................15<br />
3.5.1 Make a report....................................................................................................................15<br />
3.5.2 Print a report......................................................................................................................16<br />
3.6 Data reconstruction....................................................................................................................16<br />
3.6.1 About data reconstruction.................................................................................................16<br />
3.6.2 Use a recontruction table..................................................................................................17<br />
3.6.3 Use the scatter plot...........................................................................................................18<br />
Section 4 Device communication ................................................................................................19<br />
4.1 FL900 series logger .................................................................................................................19<br />
4.1.1 Initial setup........................................................................................................................19<br />
4.1.1.1 Install the FL900 driver.............................................................................................19<br />
4.1.1.2 Attach the logger to the computer............................................................................19<br />
4.1.1.3 Attach a sensor to the logger...................................................................................20<br />
4.1.2 User interface and navigation............................................................................................20<br />
4.1.2.1 Driver window description........................................................................................20<br />
4.1.2.2 Connection status.....................................................................................................21<br />
4.1.2.3 Toolbar.....................................................................................................................21<br />
4.1.2.4 Menu tabs.................................................................................................................22<br />
4.1.3 Connect to the logger........................................................................................................22<br />
4.1.4 Make a logger program.....................................................................................................23<br />
4.1.4.1 Site information........................................................................................................24<br />
4.1.4.2 Communications settings—local..............................................................................24<br />
4.1.4.3 Communications settings—remote..........................................................................24<br />
1
Table of Contents<br />
4.1.4.4 Datalog setup...........................................................................................................25<br />
4.1.4.5 <strong>Flo</strong>-Dar setup—Cal Wizard......................................................................................26<br />
4.1.4.6 <strong>Flo</strong>-Dar setup—manual............................................................................................27<br />
4.1.4.7 <strong>Flo</strong>-Tote setup—Cal Wizard.....................................................................................31<br />
4.1.4.8 <strong>Flo</strong>-Tote setup—manual...........................................................................................32<br />
4.1.4.9 Set up alarms...........................................................................................................32<br />
4.1.4.10 Set sampler options................................................................................................34<br />
4.1.5 View data...........................................................................................................................34<br />
4.1.5.1 Download data.........................................................................................................34<br />
4.1.5.2 Open a site file.........................................................................................................34<br />
4.1.5.3 Tabular view ...........................................................................................................35<br />
4.1.5.4 Graph view .............................................................................................................36<br />
4.1.5.5 Sample log .............................................................................................................37<br />
4.1.6 Troubleshooting.................................................................................................................37<br />
4.1.6.1 View diagnostic information......................................................................................37<br />
4.1.6.2 <strong>Manual</strong> USB driver installation.................................................................................38<br />
4.1.7 Update the firmware..........................................................................................................38<br />
2
Section 1<br />
General information<br />
1.1 Product overview<br />
1.2 PC requirements<br />
<strong>Flo</strong>-<strong>Ware</strong> is a software system for communication with supported instruments. The system<br />
uses a modular format, where "plug-in" file drivers are installed for each instrument type that<br />
is used. For example, one file driver can be installed for a <strong>Flo</strong>-Dar instrument and another<br />
file driver can be installed for a <strong>Flo</strong>-Tote instrument.<br />
Additionally, data can be processed from supported instruments at the same time. For<br />
example, data can be plotted from the <strong>Flo</strong>-Tote system and from the <strong>Flo</strong>-Dar system in the<br />
same chart or text report.<br />
<strong>Flo</strong>-<strong>Ware</strong> options:<br />
• Data charts<br />
• Data reports<br />
• Data reconstruction and edit functions<br />
• International language support<br />
• Custom formats for data reports<br />
• Language editor to make language translation files<br />
File Driver options:<br />
• International language support<br />
• Communications with devices directly or via modem<br />
• Original file-type reading<br />
• Data calculations<br />
• Other instrument services<br />
Compatible programs:<br />
• Instrument-specific drivers—these "plug-ins" are designed for each instrument type that<br />
operates with <strong>Flo</strong>-<strong>Ware</strong>. After the driver is installed, <strong>Flo</strong>-<strong>Ware</strong> will automatically<br />
communicate with and record data from the associated instrument.<br />
• Report Designer—the Report Designer is used to change the design of text reports. The<br />
reports can be saved as templates for easy reuse.<br />
• Language Editor—the Language Editor is used to create language files for <strong>Flo</strong>-<strong>Ware</strong>.<br />
Once created, <strong>Flo</strong>-<strong>Ware</strong> can translate from English to the selected language.<br />
• Shape Generator—the Shape Generator is used to draw and create odd-shape pipes<br />
for flow monitoring applications. Any shape other than circular or rectangular is<br />
considered an odd-shape pipe.<br />
The computer must have the following minimum requirements:<br />
• Windows ® 2000 or XP operating system<br />
• Pentium class processor or equivalent, 90 MHz<br />
• 16 MB RAM<br />
• Video adapter card for 1024 x 768, 96 dpi resolution, 16-bit color<br />
• Microsoft ® Internet Explorer ® 5.0<br />
3
General information<br />
4
Section 2<br />
Installation<br />
2.1 Install the files<br />
2.2 Install updates<br />
Two installations are necessary:<br />
• <strong>Flo</strong>-<strong>Ware</strong>—contains the main application, the Language Editor and the Report<br />
Designer.<br />
• File Drivers—must be installed for communication with devices.<br />
1. Find the link for the <strong>Flo</strong>-<strong>Ware</strong> 4 installation from the website or from the CD:<br />
• Go to http://www.hachflow.com/p_soft_floware_down.html.<br />
• Put the CD in the computer. If the main window does not open automatically, find<br />
and open the startcd.exe file on the CD.<br />
2. Follow the on-screen instructions to install the software. When the installation is<br />
complete, a <strong>Flo</strong>-<strong>Ware</strong> shortcut icon is shown on the desktop.<br />
3. Find and install the <strong>Flo</strong>-<strong>Ware</strong> Help File. Follow the on-screen instructions to install the<br />
file.<br />
4. Find and install the File Driver for each instrument that is used. Follow the on-screen<br />
instructions to install the file.<br />
5. Install any associated files that are shown for the instrument.<br />
The application and drivers are updated regularly for continued improvement. Install the<br />
updated files for best results.<br />
1. Make sure that the computer is connected to the internet.<br />
2. Open <strong>Flo</strong>-<strong>Ware</strong> and click on the HELP button. The Help, About window opens.<br />
3. Find the version of the application and drivers that are in use.<br />
4. Click on the CHECK FOR UPDATES button. An internet browser opens and the<br />
download center is shown.<br />
5. Compare the version number of the installation files on the download page to the version<br />
of the application and drivers that are in use.<br />
6. If a newer file is available, close the application and install the updated files.<br />
5
Installation<br />
6
Section 3<br />
Operation<br />
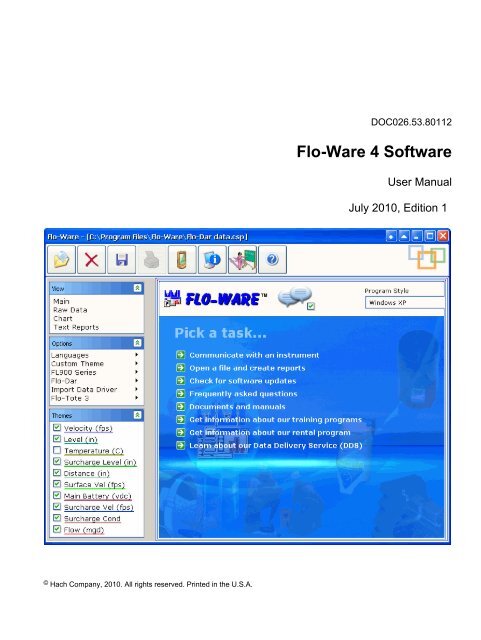
3.1 User interface<br />
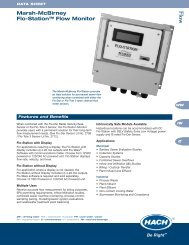
Figure 1 Main window<br />
Main window<br />
Double-click the FLO-WARE icon on the desktop to open the main window (Figure 1).<br />
1 Themes panel—measurement channels 5 Balloon help—descriptions of icons and links<br />
2 Options panel—language options and device drivers 6 Program style—color and style options for <strong>Flo</strong>-<strong>Ware</strong><br />
3 View panel—main view and data views 7 Main view—changes with the selected menu<br />
4 Main toolbar—icons shown in all windows 8 Main-view tasks—links for basic tasks and information<br />
3.2 Raw data<br />
The Raw Data view shows the data or project file in a spreadsheet. The columns correspond<br />
to the themes that are shown in the Themes panel. The maximum number of records is<br />
limited only by the computer memory.<br />
Navigation in the Raw Data view is similar to navigation in common spreadsheet software.<br />
Use the arrow keys on the computer keyboard to move up, down, left or right. Use hot keys<br />
such as Ctrl + End to move the cursor to the last cell in the spreadsheet. Use Ctrl +<br />
Home to move the cursor to the first cell in the spreadsheet.<br />
7
Operation<br />
3.2.1 Edit data<br />
Data can be adjusted in the raw data view to change incorrect values. For example, if a<br />
value for the level measurement indicates 0 volume, the corresponding velocity value should<br />
also be 0. If the velocity value is not 0, a velocity value of 0 can be entered.<br />
1. Click to select a data cell in the raw data view.<br />
2. Use a method to change the values:<br />
Option<br />
<strong>Manual</strong><br />
Description<br />
Use the computer keyboard to change the value. Any calculated values, such<br />
as flow, are automatically recalculated. For example, if the velocity value is<br />
doubled, the flow is automatically recalculated.<br />
Find/Replace Use the FIND/REPLACE button to search for data and replace the value.<br />
Calculator<br />
Select one or more data cells and and select add, subtract, multiply or divide<br />
from the Operator field on the toolbar. Enter a value and click the<br />
RECALCULATE SPREADSHEET button.<br />
Note: To highlight multiple cells, click in a data cell and drag down. Alternatively,<br />
click in a data cell, press the shift key and click in another cell.<br />
3.2.2 Export data<br />
Data can be saved in a .txt or .csv file format for use in common applications such as<br />
Microsoft ® Excel ® spreadsheet software.<br />
1. Open a data or project file in the Raw Data view.<br />
2. Click the EXPORT button from the toolbar of the Raw Data view. The Export window<br />
opens.<br />
8
3. To change the date and time range, click on the start time or end time that is shown.<br />
The Date/Time window opens. Select a new date and time range and click OK.<br />
4. Select a Data Interval. The intervals in the exported data file can be different from the<br />
intervals in the raw data file. For example, the raw data file can have 15 minute intervals<br />
and the exported data can have hourly or daily intervals.<br />
5. Click EXPORT. The Save Export File As window opens.<br />
6. Enter a file name and location.<br />
7. Select either the tabbed text (.txt) or comma separated values (.csv) file format and click<br />
SAVE.<br />
3.2.3 Open data or project files<br />
A data file is created whenever data is transferred from an instrument to the computer. Open<br />
these files to view and analyze the data. When data files are opened in <strong>Flo</strong>-<strong>Ware</strong>, a project<br />
file is automatically created.<br />
The project file contains the charts, text reports, themes and analysis for the data. Save the<br />
project to retain the changes that were made. When the project file is opened at a later date,<br />
the project opens up at the point where it was last saved.<br />
1. Click on the FILE OPEN button on the main toolbar. The Open File window opens<br />
(Figure 2).<br />
2. In the Type section, select a file type:<br />
Operation<br />
• <strong>Flo</strong>-<strong>Ware</strong> Project Files—previously-opened files that were saved as a project.<br />
• Instrument Files—available for an instrument if the file driver for that instrument was<br />
installed.<br />
3. In the Look In section, click BROWSE to select the folder where the data files are<br />
located. Once a path is selected, it will be available from the drop-down list.<br />
4. In the File Name section, click to highlight the data file to open. To highlight more than<br />
one file, press and hold the shift key and then click additional files.<br />
5. If a project is currently open, the Import Options section is shown. Select whether to<br />
start a new project or import the data into the current project.<br />
9
Operation<br />
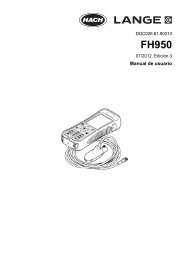
Figure 2 Open file window<br />
1 Options for highlighted files 4 File type (dependent on installed file drivers)<br />
2 Data or project files 5 Options for multiple files<br />
3 Path to file location on PC or network 6 Options for checked files<br />
6. Click OK. The Data Interval window opens.<br />
7. Select the time span and data interval.<br />
Option<br />
Start Time<br />
End Time<br />
Description<br />
The start time of the data file is shown initially. A different date and time can be<br />
selected.<br />
The end time of the data file is shown initially. A different date and time can be<br />
selected.<br />
Data Interval The data interval that is set for the instrument is shown initially. A different interval<br />
can be selected and the data will be averaged.<br />
Note: Some intervals are not compatible with the intervals set for the instrument.<br />
For example, if the instrument is set to record in 3- or 15-minute intervals, the 1-<br />
and 5-minute intervals in <strong>Flo</strong>-<strong>Ware</strong> are not available.<br />
8. Click OK. The file, if a single file and a new project, opens in the Raw data view.<br />
9. If the file is imported into the current project, or if multiple files are opened, the Theme<br />
Data window opens. Select Import (side by side) or Append (string the data together)<br />
and click OK.<br />
Option<br />
Import Data<br />
Description<br />
A side-by-side presentation is useful when the data from many different sites is<br />
plotted in one project. This presentation is useful, for example, when comparing<br />
upstream and downstream sites within the same project.<br />
Append Data Data files from the same site can be appended to create long continuous projects<br />
that are several months or several years long. Make sure to append data only<br />
from the same site.<br />
10
Operation<br />
The data file will open in the Raw data view. <strong>Flo</strong>-<strong>Ware</strong> copies the selected data file(s)<br />
and imports it into the project, leaving the original raw data file unchanged and intact<br />
for archival purposes.<br />
3.2.3.1 Change file properties<br />
In the Open File window, the properties of a data file can be changed. For example, if the<br />
wrong year was assigned to a connected flow meter during installation, the start date for<br />
the file can be changed.<br />
Note: The file properties cannot be changed for project files.<br />
Figure 3 File Properties window<br />
1. Click the FILE OPEN button and select the file type and path in the Open File window.<br />
2. Highlight the file name and click Properties. The File Properties window opens<br />
(Figure 3).<br />
3. Click in one of the fields, edit the information and click OK.<br />
3.2.3.2 Make a new data file<br />
The user can make a new data file from one or more highlighted data files. This can be<br />
useful when several data files exist for one month of data, for example. The first data file<br />
may not start exactly on the first day of the month at 0:00 hours, and the last file may not<br />
end exactly on the last day of the month at 24:00 hours. These data files can be combined<br />
into one data file that is exactly one month long.<br />
Note: Some instruments that are supported by <strong>Flo</strong>-<strong>Ware</strong> allow the user to select the exact span of<br />
data. In this case, a data file can be created with the exact span that is needed.<br />
1. Click the FILE OPEN button and select the file type and path in the Open File window.<br />
2. Highlight one or more file names and click Create data file. The Select Data Span<br />
window opens.<br />
Note: To open multiple files, highlight the first file, then hold down the Ctrl or Shift key and<br />
highlight additional files.<br />
3. Select or enter the start date and time, the end date and time and click OK. The Save<br />
File window opens.<br />
4. Enter a name for the file and click Save.<br />
3.2.3.3 Delete files<br />
Data and project files can be deleted if necessary.<br />
11
Operation<br />
1. Click the FILE OPEN button and select the file type and path in the Open File window.<br />
2. Highlight the file name to delete and click Delete. A confirmation window opens.<br />
3. Click YES to delete the file.<br />
3.2.3.4 Copy files to a new location<br />
A data or project file can be copied and pasted to a different location on the computer or<br />
network.<br />
3.3 Themes<br />
1. Click the FILE OPEN button and select the file type and path in the Open File window.<br />
2. Click the check box next to one or more file names.<br />
3. Click Copy Checked files to. Select the new location on the computer or network and<br />
click OK. The files are copied and pasted to the new location.<br />
Themes are shown as data columns in the Raw Data view. Each theme name is also shown<br />
in the Themes panel (refer to Figure 1 on page 7).<br />
The available themes correspond to the channels that were selected for logging during the<br />
site setup of the associated instrument. For example, the level and velocity themes are<br />
shown when a <strong>Flo</strong>-Tote 3 sensor is set up with level and velocity logging. A flow theme is<br />
also calculated and added.<br />
The check boxes in the themes panel allow the user to show or remove a theme in charts<br />
and text reports. Themes are always shown in the raw data view. To change the order of a<br />
theme, click and drag the theme up or down in the Themes panel.<br />
3.3.1 Set up themes<br />
Themes can be shown in a chart with different colors and attributes such as line width or<br />
style. For example, the velocity theme can have one color and the level theme can have a<br />
different color.<br />
1. Right-click a theme name from the Themes panel and select Theme Setup. The<br />
Properties window for the theme opens.<br />
2. Change the attributes that are shown on each of the tabs and click OK.<br />
Option<br />
General<br />
Marks<br />
Line, Bar or<br />
Area<br />
Description<br />
Changes the basic attributes of a theme such as the name and units. The<br />
available attributes change with the type of chart that is selected in the View<br />
panel.<br />
Changes the appearance of the marks or labels on a chart that shows individual<br />
data points. The changes affect only the theme that is selected on the General<br />
tab.<br />
Changes the appearance of the theme in a line, bar or area, pie or scatter chart.<br />
The available attributes change with the theme that is selected on the General<br />
tab.<br />
3.3.2 Edit site information<br />
The user can view and edit information about the site that is associated with the data file.<br />
This may be necessary after data entry errors are made in the field. Each supported<br />
instrument will have its own site information attributes.<br />
1. Right-click the theme name from the Themes panel.<br />
2. Select Site Information. The Site Information window opens.<br />
3. Edit the site information and click OK.<br />
Note: Refer to the help system for the associated instrument for more details about Site<br />
Information.<br />
12
Operation<br />
3.3.3 Delete a theme<br />
A theme can be removed from a project at any time.<br />
1. Right-click the theme name to be removed from the Themes panel.<br />
2. Select Delete Theme. A confirmation window opens.<br />
3. Click YES to delete the theme.<br />
3.3.4 Make a custom theme<br />
A Custom Theme adds a new column in the raw data view for user data such as infiltration/<br />
inflow, temperature, pH or maximum allowable flow.<br />
3.4 Charts<br />
1. Click Custom Theme in the Options view and select New. The Data Interval window<br />
opens.<br />
2. Enter the start time and end time. If the project is new, select the data interval.<br />
Note: If in an existing project, the interval that was set when the first file was added to the project<br />
is used for the data interval.<br />
3. Click OK. The Custom Unit Editor window opens.<br />
4. Define the units of measure for the chart and report labels:<br />
• Standard unit of measurement—enter the units and abbreviation.<br />
• Unit of measurement for totals—enter the units and abbreviation to use for totals.<br />
If the standard unit involves a rate, select the rate of measurement.<br />
5. Click OK. The Custom Properties window opens.<br />
6. Enter a name for the custom theme.<br />
7. Make selections on the General, Marks and Attributes tabs to define all of the<br />
attributes for the new custom theme. Click OK.<br />
8. To add data, select the Raw Data view. Type the data in the new column or paste data<br />
from a program such as Microsoft Excel spreadsheet software.<br />
All charts and text reports will reflect the selections that were made for the custom<br />
theme.<br />
To view data in a chart, open a data file and click Chart in the View panel.<br />
3.4.1 About charts<br />
Charts allow the user to see the data in a graphical format. Charts can show trends,<br />
anomalies, maximums, minimums and totals. Data can be shown in 4 different types of<br />
charts:<br />
• Combination—shows data as a line, a bar or an area. One theme can be shown as a<br />
data line, for example, and another theme can be shown as a bar<br />
• Bar—shows data as vertical bars. The summary type for the theme must be set to show<br />
total values. The total values are calculated based on the data interval. Each theme is<br />
shown as a portion of each bar.<br />
• Pie—shows data as a area. The summary type for the theme must be set to show total<br />
values. The total values are calculated based on the data interval. Each theme is shown<br />
as a section of the pie. The pie chart should only be used with the same type of data,<br />
for example flow data.<br />
• Scatter plot—shows data as (x, y) data pairs for two different themes. The first two<br />
checked themes are shown on the chart. The first checked theme is shown on the x-<br />
axis and the second checked theme is shown on the y-axis. To show the data for<br />
different themes, select or deselect the check box next to the theme name or change<br />
the order of the themes.<br />
13
Operation<br />
Use the buttons on the chart toolbar to navigate in the chart. To move the chart to the right<br />
or to the left, click on the PAN button, then right-click on the chart and drag the mouse to<br />
the left or right. The ZOOM IN and ZOOM OUT buttons allow the user to increase or<br />
decrease the amount of data that is shown in the chart view. The chart length can be<br />
increased up to 1 year.<br />
Charts can have multiple pages. The page navigator in the main window shows the total<br />
number of pages and the page number that is currently shown. Click the right or left arrows<br />
to go forward or back, or enter a number in the edit box and press ENTER on the computer<br />
keyboard.<br />
3.4.2 Set up charts<br />
The appearance of charts can be configured for attributes such as background color, titles,<br />
legends and 3-dimensional effects. The changes affect all of the themes in a project. After<br />
a chart is configured, the settings can be saved to a template for use with other data files.<br />
1. Open a data or project file.<br />
2. Click Chart from the View panel.<br />
3. Select a chart type (Combination, Bar, Pie or Scatter).<br />
4. Click the CHART SETUP button from the Chart toolbar. The Chart Setup window opens.<br />
5. Change the attributes that are shown on each of the tabs and click OK.<br />
Option<br />
General<br />
Description<br />
Changes the data span per chart page and sets 3D effects.<br />
Background Changes the background color of the chart and adds a background image or<br />
frame.<br />
Legend<br />
Axes<br />
Titles<br />
Walls<br />
Changes the location and style of the legend.<br />
Changes the settings for any axis of the chart. Select one of the axes from the<br />
left panel and then change the attributes for that axis.<br />
Adds up to 9 different titles in a chart. Select one of the options from the left panel<br />
and then change the title attributes for that option.<br />
Change the appearance the 3-dimensional walls that make up a 3D chart. The<br />
3D Charting option must be enabled in the General tab of the Chart Setup<br />
window. Select one of the walls from the left panel and then change the attributes<br />
for that wall.<br />
3.4.2.1 Change the data range<br />
The data span for the chart is shown in the Report Settings panel. The data span, chart<br />
length and data interval can be changed and the updates can then be seen in the chart view.<br />
Changes that are made to the span, chart length and data interval will change the number<br />
of chart pages.<br />
14
1. Select the check box next to Custom Data Span in the Report Settings panel. The start<br />
and end dates are shown.<br />
2. To change the date and time range, click on the start time or end time. The Date/Time<br />
window opens. Select a new date and time range and click OK.<br />
3. Select a chart length to be shown on each page of the chart.<br />
4. Select the data interval to be shown. The chart view is updated to show the changes.<br />
3.4.2.2 Make a template for charts<br />
The settings that are made in the Chart Setup window can be saved as a template file for<br />
use with other data files.<br />
1. Click on the CHART TEMPLATE button on the Chart toolbar. The Template Set Options<br />
window opens.<br />
2. Select Save Template Set and click Next. The Save Template Set Options window<br />
opens.<br />
3. Select one of the options:<br />
• Save as Default Template—the current chart settings are used automatically each<br />
time a chart is viewed. Click Finish and YES.<br />
• Save Template Set to File—the current chart settings can be saved and loaded into<br />
a project at any time. Click Next. Enter a file name and description for the new<br />
template. Click Finish.<br />
3.4.2.3 Use a chart template<br />
A chart template can be used as the default setup for charts, or it can be imported at any<br />
time.<br />
1. Click on the CHART TEMPLATE button on the Chart toolbar. The Template Set Options<br />
window opens.<br />
2. Select Load Template Set and click Next. The Load Template Set Options window<br />
opens.<br />
3. Select one of the options:<br />
• Load Default Template Set—use the default template to make a new chart. Click<br />
Finish.<br />
• Load Template Set from File—use a previously saved template for the current<br />
project. Click Next. Select a template file from the drop-down box. Click Finish.<br />
3.4.3 Print a chart<br />
A paper copy of a chart can be made from a local or network printer.<br />
3.5 Reports<br />
1. From the View panel, select Chart.<br />
2. Click the PRINT button. The Print window opens.<br />
3. Select the printer, the number of pages to be printed and make any necessary changes<br />
to the properties. Click OK. The chart is sent to the printer.<br />
Reports of raw data can be shown for different time intervals or as a summary of maximum,<br />
minimum, average and total values.<br />
3.5.1 Make a report<br />
Use the Text Report toolbar to make a text report.<br />
Operation<br />
15
Operation<br />
1. Open a data or project file.<br />
2. From the View panel, select Text Reports.<br />
3. Select a report type from the Available Reports drop-down list on the Text Report<br />
toolbar. The report is shown in the view window. Use the page navigator on the main<br />
toolbar to view additional pages.<br />
Note: After a report type is selected, it is available in the Installed Reports list.<br />
4. To add or remove a theme (column), go to the Themes panel and select or deselect a<br />
theme.<br />
5. To change the order of themes, go to the Themes panel and click and drag the theme<br />
name up or down.<br />
6. To change the date range:<br />
a. Go to the Report Settings panel.<br />
b. Select the check box next to Custom Data Span. The start and end dates and times<br />
are shown.<br />
c. Click on the start or the end date and time. The Date/Time window opens.<br />
d. Select a new date and time and click OK. The report will update and show the new<br />
date and time.<br />
3.5.2 Print a report<br />
A paper copy of a report can be made from a local or network printer.<br />
1. Open a text report.<br />
3.6 Data reconstruction<br />
2. Click the PRINT button. The Print window opens.<br />
3. Select the printer, the number of pages to be printed and make any necessary changes<br />
to the properties. Click OK. The report is sent to the printer.<br />
The data reconstruction workspace gives the user the flexibility to analyze data and, if<br />
necessary, repair or reconstruct the data. The example in this section describes the removal<br />
of an error in the velocity theme from a flow meter.<br />
3.6.1 About data reconstruction<br />
When a set of data suddenly shows a large change from a stable pattern, the data should<br />
be examined to find the cause for the change. As an example, imagine that the flow and<br />
velocity themes suddenly become erratic and go to very low values for approximately 1 day.<br />
This change can be due to a true decrease in the flow, or to a condition such as debris that<br />
collected on the sensor.<br />
Upon examination, the level theme shows a stable pattern for this day. If the flow actually<br />
did decrease, the level data is expected to decrease also. The conclusion can then be made<br />
that the velocity data has an error on that day.<br />
This error can be removed with the reconstruct option. The span of inaccurate data can be<br />
replaced with a span of data that is known to be accurate. The result will be more accurate<br />
data, better flow balances and a higher level of statistical confidence.<br />
The line chart or the scatter plot can be used to remove errors from most data files. The line<br />
chart is used to repair sections of data (Use a recontruction table on page 17). The scatter<br />
plot can be used to reconstruct an entire set of data (Use the scatter plot on page 18).<br />
16
3.6.2 Use a recontruction table<br />
The example that follows shows the removal of an error in the velocity theme based on the<br />
level data. The level data is referred to as the Base Theme. Before reconstruction, find a<br />
span of data that is considered to be accurate and that follows a noticeable pattern.<br />
1. Open the data or project file and select View>Chart. Select the Combination Chart from<br />
the toolbar.<br />
2. Right-click the Velocity theme in the Themes panel and select Reconstruct. The<br />
Reconstruct Velocity window opens.<br />
3. Select the Level theme from the drop-down box as the basis for the reconstruction and<br />
click OK. The Data Reconstruct panel is shown.<br />
4. In the Data Reconstruct panel, select Table > New. The Reconstruction Table<br />
Properties window opens.<br />
Note: To edit a reconstruction table that was previously saved from the same site, select Table<br />
> Open.<br />
5. Update the options as follows:<br />
• Decimal Precision—set the decimal precision for the 2 themes. The higher the<br />
precision for the base theme, the longer it will take to populate the table with data.<br />
• Base Theme Data Range—select the approximate minimum and maximum values<br />
of good data for the base theme (as seen in the line chart).<br />
• Notes—enter a comment about the site for future use.<br />
6. Click OK. A data reconstruction table is added to the Data Reconstruct panel.<br />
The left column of the table shows the Base Theme. The right column of the table shows<br />
the theme to be reconstructed.<br />
7. In the chart, select a span of data that is known to be accurate. First, left-click the start<br />
of the data, then right-click the end of the data span. The selected data for both themes<br />
will change color. Make sure that the selected span includes only accurate data.<br />
Note: If the Pan or Zoom buttons are enabled, the data cannot be selected.<br />
8. In the Data Reconstruct panel, select Table > Populate with Data. The velocity data will<br />
be added to the velocity column. Some of the data cells will be empty.<br />
9. Use one of the options that follow to fill in the empty data cells:<br />
• Select additional data spans to populate the table with more data.<br />
• Enter a reasonable value for the velocity using the keyboard.<br />
• Interpolate over blank cells: click and drag to highlight data from above the first<br />
empty data cell to below the last empty data cell. Select Edit > Interpolate. The table<br />
is updated with the linear interpolated data. The start and end cells are used as<br />
reference points.<br />
• Change to the Scatter Plot view and click in the scatter plot where the data should<br />
likely be (refer to Use the scatter plot on page 18).<br />
10. Select a span of inaccurate data in the chart. First, left-click the start of the data, then<br />
right-click the end of the inaccurate data span. The selected data for both themes will<br />
change color. Make sure that the selected span includes the data to be reconstructed.<br />
Note: If the Pan or Zoom buttons are enabled, the data cannot be selected.<br />
11. In the Data Reconstruct panel, select Table > Reconstruct. The theme is updated to<br />
show the correction (Figure 4).<br />
12. Select Table > Save to save the table. Enter a file name and location to store the file.<br />
Note: This table can be used for future data reconstruction at the same site.<br />
13. Close the Data Reconstruct panel to exit the reconstruction session.<br />
Operation<br />
Note: To reverse the reconstruction, select the Raw Data view and click the undo button.<br />
17
Operation<br />
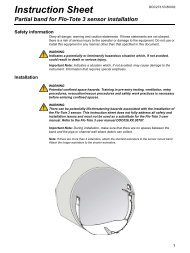
Figure 4 Data before and after reconstruction<br />
1 Valid data 2 Incorrect data 3 Repaired data<br />
3.6.3 Use the scatter plot<br />
Use the scatter plot when it is necessary to reconstruct the entire set of data. First, select a<br />
span of accurate data with the line chart to populate the reconstruction table. Then change<br />
to the scatter plot view to reconstruct the data.<br />
1. Complete step 86 to step 94 to in Use a recontruction table on page 17.<br />
2. Click on the SCATTER PLOT button. The data from the reconstruction table is shown<br />
in the scatter plot in a different color from the rest of the data set (Figure 5).<br />
3. If necessary, edit the data in the reconstruction table. The data points on the scatter plot<br />
are updated to show the new values.<br />
4. In the Data Reconstruct panel, select Table > Reconstruct. The entire set of data is<br />
updated to match the table data (Figure 5).<br />
5. Save the reconstruction file and close the Data Reconstruct panel.<br />
Figure 5 Data before and after reconstruction<br />
Note: To reverse the reconstruction, select the Raw Data view and click the UNDO button.<br />
18
Section 4<br />
Device communication<br />
4.1 FL900 series logger<br />
4.1.1 Initial setup<br />
4.1.1.1 Install the FL900 driver<br />
4.1.1.2 Attach the logger to the computer<br />
C A U T I O N<br />
Refer to the safety information in the user manual for the device before any connections are made<br />
to the device.<br />
When the driver for a device is installed, <strong>Flo</strong>-<strong>Ware</strong> can communicate directly with the device<br />
for various purposes such as data collection and site configuration.<br />
Pre-requisite: Before the FL900 logger is attached to a computer, make sure that <strong>Flo</strong>-<strong>Ware</strong><br />
is installed on the computer.<br />
The FL900 Series Driver must be installed on the PC to communicate with the logger.<br />
1. Find the link for the FL900 Series Driver on the <strong>Flo</strong>-<strong>Ware</strong> CD or from the website<br />
http://www.hachflow.com/p_soft_floware_down.html<br />
2. Click on the link and run the application. The install wizard starts.<br />
3. Follow the on-screen instructions to install the driver. Use the recommended settings.<br />
Pre-requisite: Make sure that the FL900 driver is installed on the computer.<br />
Connect only one logger to the computer.<br />
1. Attach the logger to the computer (Figure 6).<br />
2. When a USB cable is attached for the first time, the Found New Hardware wizard opens.<br />
Run the new hardware wizard to install the USB driver for the logger. When finished,<br />
the message “Your new hardware is installed and ready to use” is shown.<br />
Figure 6 Attach the logger to a computer<br />
19
Device communication<br />
4.1.1.3 Attach a sensor to the logger<br />
Figure 7 Attach a sensor to the logger<br />
Pre-requisite: Make sure that the connection status is offline.<br />
N O T I C E<br />
The IP67 rating of the sensor connector is applicable only when the cap is installed on unused<br />
connectors.<br />
The number of sensors that can attach to the logger varies with the model of the logger.<br />
1. If the sensor cable has connectors on both ends, attach the cable to the sensor first.<br />
2. Attach the sensor to any SENSOR port on the logger (Figure 7). Tighten the connector<br />
by hand.<br />
Note: For rain gauges, attach the sensor to the RAIN connector.<br />
3. Align the desiccant hub vertically and make sure that the air port points down<br />
(Figure 7).<br />
4.1.2 User interface and navigation<br />
4.1.2.1 Driver window description<br />
From the Options panel in <strong>Flo</strong>-<strong>Ware</strong>, select FL900 Series>Communications. The FL900<br />
Series Driver window opens (Figure 8). The FL900 Series Driver window has tabs and<br />
buttons to complete tasks or access menus. The connection status is shown on the bottom<br />
bar (Connection status on page 21).<br />
20
Device communication<br />
Figure 8 FL900 Series Driver window<br />
1 Menu tabs 5 Connection status—online or offline<br />
2 Menu options 6 Read/Write buttons (online only)<br />
3 Toolbar buttons 7 Connection details<br />
4 Main section 8 Load/Save/Clear buttons<br />
4.1.2.2 Connection status<br />
The connection status shows when a communication session is open:<br />
• Online—a communication session with the logger is open. Any attached sensors are<br />
shown in the driver window. The user can download and view data from the logger and<br />
write a program to the logger.<br />
• Offline—the FL900 driver is not connected to the logger. The user can open a site file<br />
or make a logger program for later use.<br />
4.1.2.3 Toolbar<br />
The toolbar buttons are always shown, but some buttons are enabled only when the<br />
connection status is online or offline.<br />
21
Device communication<br />
Connect—starts a communication session with the<br />
logger.<br />
Download since last—downloads only the data<br />
that was logged since the previous download.<br />
Disconnect—stops the communication session<br />
with the logger.<br />
Open a file—opens a site file or sensor<br />
diagnostics file from the default file path.<br />
Global settings—opens the settings window where<br />
various default settings such as file paths can be<br />
changed.<br />
Help—opens the help window.<br />
Download all data—downloads all data from the logger.<br />
4.1.2.4 Menu tabs<br />
Use the tabs to access the various menu options:<br />
• Programming—sets all of the user-adjustable parameters in the logger.<br />
• Data—allows the user to view data (tabular and graph) and get sample history from a<br />
site file that has been downloaded from the logger.<br />
• Diagnostics—contains the event log, alarm log, current status of the logger and realtime<br />
modem and sensor diagnostics.<br />
• Utilities—contains tools such as firmware updates.<br />
4.1.3 Connect to the logger<br />
When a communications session is started, the connection status changes from offline to<br />
online.<br />
1. In the FL900 Series Driver window, click the CONNECT button. The Communications<br />
window opens.<br />
2. Select the computer port (COM or USB) from the drop-down list. For COM ports, select<br />
the communications protocol for the computer.<br />
Note: When a USB cable is attached to the computer, a virtual serial port (e.g. USB:COM3) is<br />
assigned.<br />
3. Click OK. The driver reads the logger program and looks for sensors that are specified<br />
in the program.<br />
A Sensor Mismatch message is shown for the following situations:<br />
• The current logger program does not include an attached sensor<br />
• The current logger program includes a sensor that is not attached<br />
• The current logger program includes a sensor that is attached to an incorrect port<br />
4. If the Sensor Mismatch message is shown, select one of the options and click OK:<br />
• Use existing logger program—ignore the attached sensors and import the program<br />
from the logger.<br />
• Create new logger program based on detected sensors—include the attached<br />
sensors in a new program. The new program can then be written to the logger.<br />
22
Device communication<br />
4.1.4 Make a logger program<br />
The logger must have a program to specify all of the necessary parameters for data<br />
collection. The program can be made when the logger is online or offline. When made offline,<br />
the program is saved to a file and later written to the logger.<br />
The logger can have only one program. When a new program is written to the logger, the<br />
previous program is erased.<br />
1. From the Options panel in <strong>Flo</strong>-<strong>Ware</strong>, select FL900 Series>Communications to open the<br />
driver window.<br />
2. Start a communication session.<br />
3. Click on the Programming tab in the FL900 Series Driver window.<br />
4. Complete each menu option:<br />
Option<br />
Site information on page 24<br />
Communications settings—<br />
remote on page 24<br />
Communications settings—<br />
local on page 24<br />
Datalog setup on page 25<br />
<strong>Flo</strong>-Dar setup—Cal Wizard<br />
on page 26<br />
<strong>Flo</strong>-Dar setup—manual<br />
on page 27<br />
<strong>Flo</strong>-Tote setup—Cal Wizard<br />
on page 31<br />
<strong>Flo</strong>-Tote setup—manual<br />
on page 32<br />
Set up alarms on page 32<br />
Set sampler options<br />
on page 34<br />
Description<br />
Specifies general settings such as the model number, site<br />
ID, time zone, memory mode and GPS coordinates.<br />
Contains the remote communication settings for the<br />
logger.<br />
Contains the local communication settings for the logger.<br />
Specifies which measurements will be recorded, what<br />
values trigger an alarm and what actions will occur during<br />
an alarm condition.<br />
Sets the sensor units, flow channel geometry and the<br />
sensor calibration with the calibration wizard.<br />
Sets the sensor units, flow channel geometry and the<br />
sensor calibration manually.<br />
Sets the sensor units, flow channel geometry and the<br />
sensor calibration with the calibration wizard.<br />
Sets the sensor units, flow channel geometry and the<br />
sensor calibration manually.<br />
Sets the system alarms and specifies the address or<br />
number for email or text message notification.<br />
Specifies the time interval that triggers the sampler to<br />
collect samples.<br />
23
Device communication<br />
4.1.4.1 Site information<br />
The site information menu contains the identification information for the site.<br />
1. Click on the Programming tab in the FL900 Series Driver window.<br />
2. Complete the information in the Site Information menu:<br />
Option<br />
Model Number<br />
Description<br />
If online, the model number is selected automatically. If offline, select the<br />
model number of the logger that will be programmed.<br />
Site Identification Enter a unique name for the site (mandatory, maximum 16 characters).<br />
When telemetry is used for remote monitoring, a site repository is made on<br />
the server with this name.<br />
Site Location<br />
Time Zone<br />
Memory Mode<br />
Site Notes<br />
GPS Coordinates<br />
The optional location description (maximum 30 characters).<br />
Select the correct time zone for the site. When telemetry is used, the server<br />
uses this time zone to synchronize the clock.<br />
The memory mode specifies how the datalog operates when the memory<br />
becomes full. Wrap (default): the oldest data points are deleted as new data<br />
is added. Slate: data collection stops.<br />
Click the note icon to enter optional comments. Click the save icon to save<br />
the comments. The note file is saved as a .sn file in the default file path<br />
location.<br />
Enter the GPS coordinates for the site (optional). Use Datum WGS84 as<br />
the reference location and the format that is shown for Latitude and<br />
Longitude. When telemetry is used, these coordinates are shown on the<br />
map in FSDATA.<br />
4.1.4.2 Communications settings—local<br />
Local settings apply when the logger is connected to a computer with a communications<br />
cable. These settings are stored in the logger. When a communication session is started,<br />
the settings in the computer must be the same as the settings in the logger. The default<br />
local settings are sufficient for most applications. Change the settings only for specific<br />
communication requirements such as connection to a third-party device.<br />
1. Click on the Programming tab in the FL900 Series Driver window.<br />
2. Click on the Communications menu.<br />
3. Change any of the options:<br />
Option<br />
Description<br />
Modbus Address The address that is used for network communication with the logger (default<br />
address: 2).<br />
Baud Rate<br />
Parity<br />
Protocol<br />
The baud rate assigned to the logger.<br />
Even, odd or none.<br />
Modbus RTU (default) or Modbus ASCII.<br />
4.1.4.3 Communications settings—remote<br />
A modem can be used to transmit data to a server or to send email or text messages from<br />
the logger. The modem can be for wireless or landline (dialup) communication. When a<br />
GPRS wireless modem is used, the user must first install the SIM card from the mobile<br />
provider (refer to the documentation for the logger).<br />
For connection to the internet, the user must first configure the server for the instrument and<br />
get the Security Verification Code (SVC). Refer to the user manual for the FL900 logger for<br />
more information.<br />
24
1. Click on the Programming tab in the FL900 Series Driver window.<br />
2. Click on the Communications menu. If online, most of the settings are completed<br />
automatically.<br />
3. Change any of the options for the modem:<br />
Device communication<br />
Option<br />
Enable Modem<br />
Modem Type<br />
Description<br />
Makes the modem active. If the modem is not used, deselect this<br />
option to save battery power.<br />
Selects the type of modem (refer to the label on the logger). Options:<br />
GPRS, Verizon, Sprint, Dialup.<br />
Modem Frequency GPRS only—sets the modem frequency to be used. Options: 850,<br />
900E, 1800, 1900, 850/1900 (North America), 900E/1800 (EU), 900E/<br />
1900 MHz.<br />
Network Provider Wireless only—selects the mobile provider. Options: EU Mobistar 1,<br />
EU Mobistar 2, US AT&T Cingular, US TMobile.<br />
Access Point Name<br />
Username<br />
Password<br />
Programming Code<br />
Mobile Station ID<br />
Mobile Data Number<br />
Primary dial number<br />
Secondary dial<br />
number<br />
GPRS only—the access point name is entered automatically when<br />
the network provider is selected.<br />
If the network provider supplied a user name and password, enter the<br />
information.<br />
f the network provider supplied a user name and password, enter the<br />
information.<br />
Verizon or Sprint only—this information is supplied by the network<br />
provider.<br />
Verizon or Sprint only—this information is supplied by the network<br />
provider.<br />
Verizon or Sprint only—this information is supplied by the network<br />
provider.<br />
Dialup only—this information is supplied by the internet service<br />
provider.<br />
Dialup only—this information is supplied by the internet service<br />
provider.<br />
4. Change any of the options for the server:<br />
Option<br />
Server IP Address<br />
Port Number<br />
Primary Call Interval<br />
Description<br />
Internet server address, supplied by the manufacturer.<br />
Internet connection information, supplied by the manufacturer.<br />
The frequency that the logger calls the server, not to exceed the<br />
logging interval. Options: 5, 6, 10, 12, 15, 30, 60 minutes; 2, 3, 4, 6,<br />
12, 24 hours.<br />
Secondary Call Interval The frequency that the logger calls the server during an alarm<br />
condition. Options: 5, 6, 10, 12, 15, 30, 60 minutes; 2, 3, 4, 6, 12, 24<br />
hours.<br />
SMS to E-mail Gateway GPRS only—completed automatically when the provider is selected.<br />
SMS Service Center<br />
Server Verification<br />
Code<br />
GPRS only—completed automatically after the provider is selected.<br />
The customer-specific ID that connects an instrument to the customer<br />
account during telemetry.<br />
4.1.4.4 Datalog setup<br />
Use the datalog setup menu to specify which channels will be recorded in the datalog. A<br />
channel can be a reading from an attached sensor, the battery voltage from the logger or a<br />
25
Device communication<br />
statistical value based on a sensor reading. A channel must be selected before any data<br />
can be saved. A maximum of 16 channels can be selected.<br />
Note: If channels are added to or removed from an existing program, all data in the logger will be<br />
erased. Be sure to download the data from the logger to a safe location before the modified program<br />
is written to the logger.<br />
1. Click on the Programming tab in the FL900 Series Driver window. If online, the attached<br />
sensors and ports are shown.<br />
2. If offline, click on the Datalog Setup menu. Select the sensor(s) from the drop-down list<br />
in the Port Assignments section that agree with the sensor and port configurations on<br />
the logger.<br />
3. Click on the Datalog Setup menu.<br />
4. Select the channels to be logged in the Select Datalog Channels section:<br />
a. Expand the tree for the Logger channel group. The Power Supply channel is always<br />
shown in this group. If the logger contains a port for a rain gauge, the Rain channel<br />
is also shown. To include a Logger channel in the datalog, select the check box<br />
next to the channel name.<br />
b. Expand the tree for each Port[1 ](Sensor Name) channel group to view the available<br />
channels for the sensor.<br />
c. To include a Sensor channel in the datalog, select the check box next to the channel<br />
name. The log channel count increases each time a channel is selected.<br />
Note: For loggers with multiple sensor ports, the port number is added to the channel name.<br />
For example, Velocity 3 is the velocity channel name for sensor port 3.<br />
5. To set the logging interval for a channel group:<br />
a. Click on the channel group name, for example Port1 (<strong>Flo</strong>-Dar). The logging<br />
intervals are shown.<br />
b. Select the interval from the drop-down list. The primary logging interval is used for<br />
normal operation. The secondary logging interval is used during alarm conditions.<br />
Note: The logging interval cannot be set for an individual sensor channel.<br />
6. To change the units for a channel, click on the channel name. The units are shown.<br />
Select the units from the drop-down list.<br />
4.1.4.5 <strong>Flo</strong>-Dar setup—Cal Wizard<br />
The sensor can be configured and calibrated with the calibration wizard. The sensor must<br />
be installed in the process and must be online for calibration.<br />
1. Click on the Programming tab in the FL900 Series Driver window. If online, the attached<br />
sensors and ports are shown.<br />
2. If offline, click on the Datalog Setup menu. Select the sensor(s) from the drop-down list<br />
in the Port Assignments section that agree with the sensor and port configurations on<br />
the logger.<br />
3. Click on Sensor Port[1] (sensor name).<br />
4. Select the units in the Unit Preferences section. These units can be different from the<br />
logged units that are specified in the Datalog Setup menu.<br />
26
Device communication<br />
5. Click on the CAL WIZARD button. The Calibration Wizard window opens.<br />
6. Select the options on each screen and click NEXT:<br />
Option<br />
Number of<br />
samples<br />
<strong>Flo</strong>w parameters<br />
Ultrasonic<br />
transducer<br />
Description<br />
The number of times the sensor is sampled for the calibration<br />
measurements (1, 2 or 3).<br />
The shape and dimensions of the flow channel (circular, rectangular,<br />
trapezoidal or U-shaped).<br />
The level (depth) sensor that is used during non-surcharge conditions<br />
(standard or extended range).<br />
Surcharge velocity The SVS sensor for velocity measurements during surcharge conditions<br />
(yes, no. If yes, select the sensor port where the SVS is attached).<br />
Sensor height<br />
Calibration screen<br />
Actual level<br />
Actual velocity<br />
The distance from the bottom of the flow channel to the top of the sensor<br />
frame (direct—measured by user or indirect—measured by sensor. If<br />
indirect, the user must enter the liquid level after the measurement has<br />
been sampled from the sensor).<br />
The calibration measurements are taken.<br />
The liquid level (depth) in the flow channel.<br />
The user can measure the velocity with a different instrument and enter<br />
the value (optional).<br />
7. When the Calibration Complete screen is shown, click FINISH. The Calibration Wizard<br />
window closes.<br />
Note: The Calibration Complete screen shows the values that were entered by the user and the<br />
values that were measured by the sensor. If the values are different, the calibration adjustment<br />
value or multiplier is shown.<br />
8. Click WRITE TO LOGGER to save the settings.<br />
4.1.4.6 <strong>Flo</strong>-Dar setup—manual<br />
The Calibration Wizard is the easiest method to set up the sensor. Use the manual setup<br />
for odd-shaped flow channels or to adjust some of the calibration parameters. The sensor<br />
must be installed and online. Be sure to complete the level calibration before the velocity<br />
calibration.<br />
1. Click on the Programming tab in the FL900 Series Driver window. If online, the attached<br />
sensors and ports are shown.<br />
2. If offline, click on the Datalog Setup menu. Select the sensor(s) from the drop-down list<br />
in the Port Assignments section that agree with the sensor and port configurations on<br />
the logger.<br />
3. Click on Sensor Port[1] (sensor name).<br />
4. Select the units in the Unit Preferences section. These units can be different from the<br />
logged units that are specified in the Datalog Setup menu.<br />
5. Click on the <strong>Flo</strong>w Settings tab and select the shape of the flow channel.<br />
6. Enter the dimensions of the flow channel.<br />
7. If the flow channel is odd-shaped, a table is shown. A cross-section of the shape can<br />
be divided into parts and the area of the parts can be entered into the table.<br />
8. Click WRITE TO LOGGER to save the settings.<br />
9. If an SVS sensor if used, complete the following steps:<br />
a. Click on the Surcharge Settings tab.<br />
b. Select the Use SVS Sensor check box.<br />
c. Select the sensor port on the logger where the SVS is attached.<br />
27
Device communication<br />
d. Change any of the SVS settings if necessary:<br />
Option<br />
Reversed SVS Sensor<br />
Conductivity Trigger<br />
Distance Turn-On<br />
Distance Switchover<br />
Description<br />
Select if the <strong>Flo</strong>-Dar sensor is installed in the reverse direction.<br />
The conductivity value that starts the <strong>Flo</strong>-Dar surcharge mode<br />
(secondary trigger).<br />
The distance that starts the SVS operation (primary trigger).<br />
The distance that starts the <strong>Flo</strong>-Dar surcharge mode (primary<br />
trigger).<br />
Surcharge Level Trigger The surcharge level that starts the SVS operation (secondary<br />
trigger).<br />
SVS Velocity Multiplier<br />
The multiplier that is used to adjust the SVS measurements.<br />
Note: After the SVS port number is specified in the <strong>Flo</strong>-Dar setup, the menus are the same<br />
for the Sensor Port[1] (<strong>Flo</strong>-Dar) and the Sensor Port[2] (SVS) screens.<br />
If an SVS is not used, make sure that the Use SVS Sensor check box is not selected.<br />
4.1.4.6.1 Calibrate the surcharge level<br />
Calibration of the surcharge level sensor is usually not necessary when the auto calibration<br />
function is enabled. The value for the surcharge level should be zero during normal flow<br />
conditions. If the value is high or drifts, replace the desiccant cartridge.<br />
1. Click on the Advanced Settings tab in the Sensor Port[1] (<strong>Flo</strong>Dar) menu and click<br />
CALIBRATE. The Surcharge Level Calibration window opens (Figure 9).<br />
2. Click TAKE SAMPLE. The sensor measures the surcharge level. When complete, the<br />
value is shown in the Sensor field.<br />
3. If the measured depth is not zero (or the measured value), enter zero (or the measured<br />
value) in the Actual field. The offset is calculated and shown. The offset is used to adjust<br />
the measured value to the correct value.<br />
4. Click OK.<br />
5. Change any of the surcharge level settings if necessary:<br />
Option<br />
Level Calibration<br />
Stability Variance<br />
Trigger Count<br />
Auto Range Min<br />
Auto Range Max<br />
Description<br />
Shows the current value for the level calibration.<br />
Changes the required stability for auto calibration.<br />
Changes the required number of stable readings for auto calibration.<br />
Negative value limit for auto calibration.<br />
Positive value limit for auto calibration.<br />
6. Click WRITE TO LOGGER to save the settings. The level calibration is complete.<br />
Note: The data in the Quality Parameters section should not be changed unless recommended<br />
by technical support.<br />
28
Device communication<br />
Figure 9 Surcharge level calibration<br />
4.1.4.6.2 Calibrate the ultrasonic level sensor<br />
Calibrations must be done at the location where the sensor is installed. The sensor does<br />
not need to be calibrated again unless it is moved.<br />
1. Click on the General Settings tab.<br />
2. In the <strong>Flo</strong>Dar U-Sonic Level Settings section, select the Transducer Type (standard or<br />
extended range).<br />
3. If the sensor height is known, enter the value in the sensor height field. The sensor<br />
height is the distance from the bottom of the flow channel to the top of the sensor frame.<br />
If the sensor height is not known, do the following:<br />
a. Click ENTER. The U-Sonic Height window opens.<br />
b. Click TAKE SAMPLE. The sensor measures the distance to the liquid surface.<br />
c. In the Measured Level field, enter the depth of the liquid in the channel. The sensor<br />
height is then calculated and shown in the Sensor Height field.<br />
4. Click OK. The U-Sonic Height window closes.<br />
5. If there is sediment in the flow channel, enter the amount in the Sediment field.<br />
6. Click the CALIBRATE button. The U-Sonic Level Calibration window opens.<br />
7. Click TAKE SAMPLE. The sensor measures the distance to the liquid surface and uses<br />
the sensor height information to calculate the liquid level. After approximately 45<br />
seconds, the level measurement is shown.<br />
29
Device communication<br />
8. If the measured depth is different, enter the measured value in the Actual field. The<br />
offset is calculated and shown. The offset is used to adjust the measured value to the<br />
correct value.<br />
9. Click OK.<br />
10. Click WRITE TO LOGGER to save the settings. The level calibration is complete.<br />
4.1.4.6.3 Calibrate the velocity<br />
Calibrations must be done at the location where the sensor is installed. The sensor does<br />
not need to be calibrated again unless it is moved. Be sure to complete the level calibration<br />
before the velocity calibration is started.<br />
1. Click on the General Settings tab.<br />
2. In the <strong>Flo</strong>Dar Velocity Settings section, select a Velocity Method:<br />
• Mean Vel—use for circular flow channels.<br />
• Vel Multiplier—use for non-circular flow channels.<br />
3. If the velocity and flow are known, enter a site multiplier.<br />
a. Click the GENERATE button. The Velocity Multiplier window opens.<br />
b. Click TAKE SAMPLE. After approximately 45 seconds, the measured velocity is<br />
shown.<br />
c. In the Actual Velocity field, enter the known velocity. The multiplier value is<br />
calculated and the value is shown in the Multiplier field.<br />
d. Click OK.<br />
e. Repeat steps a–d to make sure the velocity is stable.<br />
4. If the average velocity is not known, a velocity profile should be completed.<br />
a. Click on the Diagnostics tab and then the Current Status menu.<br />
b. Record several real-time velocity readings from the Channel Info section.<br />
c. Calculate the average of the real-time velocity readings.<br />
d. Complete a velocity profile. The Open Channel Profiling Handbook is a good<br />
reference on velocity profiling.<br />
e. After the velocity profile is completed, repeat steps a–c.<br />
f. Compare the average velocity from the real-time readings to the velocity profile.<br />
g. Calculate the multiplier to convert the <strong>Flo</strong>-Dar velocity to the profiled velocity.<br />
h. Click on the Programming tab and go to the <strong>Flo</strong>-Dar sensor port menu.<br />
i. Enter the multiplier in the Site Multiplier field in the General Settings tab.<br />
5. Change any of the velocity settings if necessary:<br />
30
Device communication<br />
Option<br />
Site Multiplier<br />
Min FFT Limit<br />
Max FFT Limit<br />
Min Velocity Cutout<br />
Description<br />
Adjusts the <strong>Flo</strong>-Dar velocity to the profiled or known value.<br />
Narrows the processing window of the velocity measurement.<br />
Narrows the processing window of the velocity measurement.<br />
Forces the velocity to a substitute value when the measurement is<br />
outside of a user-specified range.<br />
Max Velocity Cutout Forces the velocity to a substitute value when the measurement is<br />
outside of a user-specified range.<br />
6. Click WRITE TO LOGGER to save the settings. The velocity calibration is complete.<br />
4.1.4.7 <strong>Flo</strong>-Tote setup—Cal Wizard<br />
The sensor can be configured and calibrated with the calibration wizard. The sensor must<br />
be installed in the process and must be online for calibration. If the flow channel is oddshaped,<br />
refer to <strong>Flo</strong>-Tote setup—manual on page 32.<br />
1. Click on the Programming tab in the FL900 Series Driver window. If online, the attached<br />
sensors and ports are shown.<br />
2. If offline, click on the Datalog Setup menu. Select the sensor(s) from the drop-down list<br />
in the Port Assignments section that agree with the sensor and port configurations on<br />
the logger.<br />
3. Click on Sensor Port[1] (<strong>Flo</strong>Tote).<br />
4. Select the units in the Unit Preferences section. These units can be different from the<br />
logged units that are specified in the Datalog Setup menu.<br />
5. Click on the CAL WIZARD button. The Calibration Wizard window opens.<br />
6. Select the options on each screen and click NEXT:<br />
Option<br />
Description<br />
Number of samples The number of times the sensor is sampled for the calibration<br />
measurements (1, 2 or 3).<br />
<strong>Flo</strong>w parameters<br />
Sensor offset<br />
Sediment value<br />
Actual level<br />
Actual velocity<br />
The shape and dimensions of the flow channel (circular, rectangular,<br />
trapezoidal or U-shaped).<br />
The difference between the measured level and the actual level.<br />
The amount of sediment in the flow channel.<br />
The liquid level (depth) in the flow channel. If the sensor height was<br />
measured indirectly, the liquid level must be measured manually.<br />
The user can measure the velocity with a different instrument and enter<br />
the value (optional).<br />
31
Device communication<br />
7. When the Calibration Complete screen is shown, click FINISH. The Calibration Wizard<br />
window closes.<br />
Note: The Calibration Complete screen shows the values that were entered by the user and the<br />
values that were measured by the sensor. If the values are different, the calibration adjustment<br />
value or multiplier is shown.<br />
8. Click WRITE TO LOGGER to save the settings.<br />
4.1.4.8 <strong>Flo</strong>-Tote setup—manual<br />
The Calibration Wizard is the easiest method to set up the sensor. Use the manual setup<br />
for odd-shaped flow channels or to adjust some of the calibration parameters. The sensor<br />
must be installed and online.<br />
1. Click on the Programming tab in the FL900 Series Driver window. If online, the attached<br />
sensors and ports are shown.<br />
2. If offline, click on the Datalog Setup menu. Select the sensor(s) from the drop-down list<br />
in the Port Assignments section that agree with the sensor and port configurations on<br />
the logger.<br />
3. Click on Sensor Port[1] (<strong>Flo</strong>Tote).<br />
4. Select the units in the Unit Preferences section. These units can be different from the<br />
logged units that are specified in the Datalog Setup menu.<br />
5. Click on the <strong>Flo</strong>w Settings tab and select the shape of the flow channel.<br />
6. Enter the dimensions of the flow channel.<br />
7. If the flow channel is odd-shaped, a table is shown. A cross-section of the shape can<br />
be divided into parts and the area of the parts can be entered into the table.<br />
8. Click WRITE TO LOGGER to save the settings.<br />
9. Click on the General Settings tab.<br />
10. In the velocity settings section, click the CALCULATE button. The Site Coefficient<br />
window opens.<br />
11. Click TAKE SAMPLE. The velocity measurement starts. When complete, the measured<br />
velocity is shown.<br />
12. Measure the velocity with a different instrument and enter the value in the Actual Velocity<br />
field. The multiplier value adjusts the sensor reading to be the same as the actual<br />
velocity value.<br />
13. Click OK.<br />
14. In the level settings section, click the CALIBRATE button. The Level Calibration window<br />
opens.<br />
15. Click TAKE SAMPLE. The level measurement starts. When complete, the measured<br />
level is shown.<br />
16. Measure the liquid level manually and enter the value in the Actual Level field. The offset<br />
value adjusts the sensor reading to be the same as the actual value.<br />
17. Click WRITE TO LOGGER to save the settings.<br />
4.1.4.9 Set up alarms<br />
Use the Alarms menu to set up channel alarms, system alarms and notifications. Channels<br />
must first be selected in the Datalog Setup menu before channel alarms can be set. A<br />
maximum of 16 channel alarms can be set.<br />
1. Click on the Programming tab in the FL900 Series Driver window.<br />
2. Click on the Alarms menu.<br />
3. To set a channel alarm, click on the Channel Alarms tab:<br />
a. Click on the ADD ALARM button.The Add Channel Alarm window opens.<br />
b. Select the channel from the drop-down list.<br />
32
Figure 10 Low alarm example<br />
Device communication<br />
c. Select the type of alarm (low/low, low, high, high/high) and click OK. The channel<br />
alarm is shown in the main section.<br />
d. Enter the trigger value and deadband. An alarm starts when the channel value is<br />
equal to the trigger value. An alarm stops when the channel value goes above (low<br />
alarm) or below (high alarm) the deadband value.<br />
1 Channel value 3 Low alarm stops 5 Trigger value<br />
2 Low alarm starts 4 Deadband 6 Time<br />
e. Select the actions that will start during an alarm condition:<br />
Option<br />
Send SMS from logger<br />
Send Email from logger<br />
Trigger sampler<br />
Switch to secondary log<br />
interval<br />
Switch to secondary call<br />
interval<br />
Send SMS from server<br />
Send Email from server<br />
Description<br />
Send an SMS (text) message from the logger—useful when<br />
the server cannot be contacted.<br />
Send an email message from the logger—useful when the<br />
server cannot be contacted.<br />
When a sampler is attached, start a sampling program.<br />
Switch to secondary log interval—the secondary log interval<br />
is used.<br />
Switch to secondary call interval—the secondary call interval<br />
is used.<br />
Send an SMS (text) message from the server—saves battery<br />
power on the logger.<br />
Send an email message from the server—saves battery<br />
power on the logger.<br />
4. To set a system alarm, click on the System Alarms tab:<br />
a. Select the system alarm type:<br />
Option<br />
Description<br />
Low Main Power The batteries in the logger or external power supply is less than 8 V.<br />
Low RTC Battery<br />
The battery for the internal clock in the logger is weak.<br />
Low Slate Memory The datalog is 80% full.<br />
Slate Memory Full<br />
The datalog is full and data collection has stopped.<br />
33
Device communication<br />
Option<br />
Sensor Timeout<br />
Description<br />
The sensor has not responded to a call by the server.<br />
Sensor ID Error<br />
b. Select the system alarm actions:<br />
The program cannot detect what type of sensor is connected.<br />
Option<br />
Send SMS from logger<br />
Description<br />
Send a text message from the logger via the network provider.<br />
Send Email from logger Send an email from the logger via the network provider.<br />
Send SMS from server<br />
Send a text message from the FSDATA server.<br />
Send Email from server Send an email from the FSDATA server.<br />
5. To set enter recipient information for alarm notifications, click on the Recipients tab:<br />
a. Enter the email address for each email recipient (maximum of 5).<br />
b. Enter the number for each SMS (text message) recipient (maximum of 5).<br />
4.1.4.10 Set sampler options<br />
If a sampler is used, the sampler must be attached to the auxiliary port on the logger. Use<br />
the Sampler menu to specify when samples are taken.<br />
4.1.5 View data<br />
1. Click on the Programming tab in the FL900 Series Driver window.<br />
2. Click on the Sampler menu.<br />
3. In the Pacing Source field, select the sensor port that will measure flow for the sampler.<br />
4. Enter the volume interval that generates a flow pulse to the sampler. For example, a<br />
sampler can take a sample every 100 gallons of flow.<br />
Note: The sampler can also take a sample during alarm conditions if the Trigger sampler action<br />
is set for a channel alarm.<br />
4.1.5.1 Download data<br />
When data is downloaded from the logger, the data includes the channel data, the event<br />
log, the alarm log and the sample history. The data is automatically saved as a .fl9 file in<br />
the default file path.<br />
1. Open a communication session with the logger (Connect to the logger on page 22).<br />
2. Click on one of the download options:<br />
Option<br />
Description<br />
Download all of the data from the logger.<br />
Download only the data that was logged since the last download.<br />
3. Wait for the data to download. When complete, a confirmation message is shown. Click<br />
OK. The data is shown in the FL900 window ( Tabular view on page 35).<br />
4.1.5.2 Open a site file<br />
Data files that were downloaded previously can be opened when the connection status is<br />
offline.<br />
1. Make sure the connection status is offline. If online, click on the DISCONNECT button.<br />
34
2. Click on the OPEN A SITE FILE button. The Open file window opens.<br />
Device communication<br />
3. Find the file and click OPEN. The data is shown in the FL900 window ( Tabular view<br />
on page 35).<br />
4.1.5.3 Tabular view<br />
The tabular view shows the data in a spreadsheet format (Figure 11). The following options<br />
are available:<br />
Option<br />
Open in <strong>Flo</strong>-<strong>Ware</strong><br />
Sort data<br />
Show or remove<br />
channels<br />
Change the date<br />
range<br />
Copy to the clipboard<br />
Print<br />
Export as tabseparated<br />
Export as commaseparated<br />
Open in Excel<br />
Description<br />
Click on the <strong>Flo</strong>-<strong>Ware</strong> icon to open the file in the main <strong>Flo</strong>-<strong>Ware</strong> application<br />
Click on a column header to sort the data by that column<br />
Click on the check box next to a channel and click the UPDATE<br />
TABLE button to show or remove channels.<br />
Change the date and time range and click the UPDATE TABLE button.<br />
Click on the copy icon to copy the data to the clipboard. The data can then<br />
be pasted in a spreadsheet or other application.<br />
Click on the printer icon to send the data to a printer.<br />
Click on the TSV icon to export the data as a tab-separated file.<br />
Click on the CSV icon to export the data as a comma-separated file.<br />
Click on the Excel icon to open the data in Microsoft ® Excel ® spreadsheet<br />
software.<br />
35
Device communication<br />
Figure 11 FL900 tabular data view<br />
4.1.5.4 Graph view<br />
The graph view shows the data in a line graph (Figure 12). A maximum of 2 channels can<br />
be shown. The rain gauge and sampler are shown as bars in addition to the 2 selected<br />
channels. The bars for the sampler are shown in a green color when a sample was collected<br />
and in a red color if the sampler failed to collect a sample.<br />
The following options are available:<br />
Option<br />
Show or remove<br />
channels<br />
Change the date<br />
range<br />
Copy to the clipboard<br />
Print<br />
Export as image<br />
Zoom in<br />
Description<br />
Click on the check box next to a channel and click the UPDATE<br />
TABLE button to show or remove channels.<br />
Change the date and time range and click the UPDATE TABLE button.<br />
Click on the copy icon to copy the data to the clipboard. The data can then<br />
be pasted in a spreadsheet or other application.<br />
Click on the printer icon to send the data to a printer.<br />
Click on the BMP icon to save the graph in a .bmp image format.<br />
Click on the graph and drag to the right to zoom in.<br />
36
Device communication<br />
Option<br />
Zoom out<br />
Pan left, right, up or<br />
down<br />
Description<br />
Click on the graph and drag to the left to zoom out.<br />
Right-click on the graph and drag to the left, right, up or down to move the<br />
graph position.<br />
Figure 12 FL900 graph view<br />
4.1.5.5 Sample log<br />
4.1.6 Troubleshooting<br />
When a sampler is attached to the logger, the following sample data is collected and shown<br />
in the tabular format:<br />
• Date and time of the sample<br />
• Sample status (success or failed)<br />
• Sample number<br />
• Sample bottle number<br />
Refer to the Tabular view on page 35 for a description of the available user options.<br />
4.1.6.1 View diagnostic information<br />
The user can view diagnostic information to help solve a problem or to confirm normal<br />
operation.<br />
37
Device communication<br />
1. Click on the Diagnostics tab.<br />
2. Select one of the menu options:<br />
Option<br />
Event Log<br />
Current<br />
Status<br />
Sensors<br />
Modem<br />
Alarm Log<br />
Description<br />
The date and time, event number, event text and event data is shown for all events<br />
in the tabular format. Refer to the Tabular view on page 35 for a description of<br />
the available user options.<br />
When online, real-time general information such as the power supply voltage is<br />
shown. The measured channel values are shown and are updated at the same<br />
interval that is set in the logger program. If a sampler is connected, the volume<br />
before the next sample is taken is shown.<br />
When online, the user can download a sensor diagnostic file (.sdf) for use by<br />
technical support. The file is saved in the location that is specified in the settings.<br />
Technical support may ask the user to take a sample or to run diagnostics for a<br />
specified time (1 hour, 1 day or 1 week) to get additional diagnostic information.<br />
When online, information about the modem and the signal strength is shown. The<br />
registration status should show home. The CALL SERVER button can be used to<br />
connect to the server and to show connection information. When the call is<br />
complete, click the SAVE button to save the information.<br />
The data for all alarms is shown in the tabular format. Refer to the Tabular view<br />
on page 35 for a description of the available user options.<br />
4.1.6.2 <strong>Manual</strong> USB driver installation<br />
If there was a problem with the USB driver installation, install the USB driver manually.<br />
1. With the logger attached to the PC, open the Windows Device Manager.<br />
2. Find the FL-9XX port under the Ports node and open the port properties.<br />
3. Install the driver from C:\Program Files\<strong>Flo</strong>-<strong>Ware</strong>\FL9xx\Backup (file name:<br />
FL-9XX_USB.inf).<br />
4.1.7 Update the firmware<br />
The firmware is updated regularly for continued improvement. Install the updates for best<br />
results.<br />
1. Click on the Utilities tab and select the Firmware Update menu.<br />
2. Select the file to install.<br />
3. Click START.<br />
4. Select the udpate option and click OK. The update starts. Wait for the status to show<br />
complete.<br />
38