FH950 User Manual English - Hachflow
FH950 User Manual English - Hachflow
FH950 User Manual English - Hachflow

You also want an ePaper? Increase the reach of your titles
YUMPU automatically turns print PDFs into web optimized ePapers that Google loves.
DOC026.52.80210<br />
<strong>FH950</strong><br />
07/2012, Edition 3<br />
<strong>User</strong> <strong>Manual</strong>
Table of Contents<br />
Specifications..............................................................................................................3<br />
Sensor specifications...................................................................................................3<br />
Portable meter specifications.......................................................................................3<br />
<strong>User</strong> interface specifications........................................................................................4<br />
General specifications.................................................................................................4<br />
General information..................................................................................................4<br />
Safety information........................................................................................................5<br />
Use of hazard information....................................................................................5<br />
Precautionary labels.............................................................................................5<br />
Certification...........................................................................................................5<br />
Product overview.........................................................................................................6<br />
System overview..................................................................................................6<br />
Sensor overview...................................................................................................7<br />
Meter overview.....................................................................................................8<br />
Product components.............................................................................................8<br />
Installation.....................................................................................................................9<br />
Installation with optional accessories...........................................................................9<br />
Install the sensor on the universal sensor mount........................................................9<br />
Connect the sensor to the meter...............................................................................10<br />
Attach the lanyard......................................................................................................10<br />
Attach the velcro strap...............................................................................................11<br />
<strong>User</strong> interface and navigation............................................................................11<br />
Keypad and key functions..........................................................................................11<br />
Status bar..................................................................................................................12<br />
Navigation and Main Menu .......................................................................................13<br />
Startup and self-test...............................................................................................17<br />
Sleep mode................................................................................................................17<br />
Operation.....................................................................................................................18<br />
Stream profiles...........................................................................................................18<br />
Stations and station spacing...............................................................................18<br />
Measure velocity.................................................................................................18<br />
Measure velocities in a cross-section.......................................................... 19<br />
Insert or delete a station..............................................................................21<br />
Conduit profiles..........................................................................................................22<br />
0.9 x Vmax measurement method......................................................................22<br />
0.2/0.4/0.8 method..............................................................................................23<br />
Velocity/Level Integration measurement method...............................................23<br />
2D measurement method...................................................................................24<br />
Download data...........................................................................................................25<br />
Delete data files..................................................................................................25<br />
Maintenance...............................................................................................................25<br />
Download the PVM utility...........................................................................................25<br />
Update the firmware..................................................................................................25<br />
Clean the sensor........................................................................................................26<br />
Clean the meter.........................................................................................................27<br />
1
Table of Contents<br />
Install or replace the battery......................................................................................27<br />
Charge the battery.....................................................................................................28<br />
Troubleshooting.......................................................................................................28<br />
Diagnostics................................................................................................................28<br />
Troubleshoot errors...................................................................................................29<br />
Replacement parts and accessories...............................................................29<br />
Appendix......................................................................................................................31<br />
Mean-section and Mid-section methods....................................................................31<br />
Profiles and measurements.......................................................................................32<br />
Site selection.............................................................................................................33<br />
Do a velocity calibration.............................................................................................33<br />
Wet/Dry threshold......................................................................................................33<br />
2
Specifications<br />
Specifications are subject to change without notice.<br />
Sensor specifications<br />
Specification<br />
Details<br />
Velocity measurement<br />
Method<br />
Range<br />
Minimum water depth<br />
Accuracy<br />
Electromagnetic<br />
0 to 6.09 m/s (0 to 20 ft/s)<br />
3.18 cm (1.25 in.)<br />
±2% of reading ±0.015 m/s (±0.05 ft/s) 0 to 3.04 m/s (0 to 10 ft/s); ± 4% of reading from<br />
3.04 to 4.87 m/s (10 to 16 ft/s)<br />
Resolution 0.01 value < 100; 0.1 value < 1000; 1.0 value ≥ 1000<br />
Zero stability<br />
Material<br />
Enclosure rating<br />
Dimensions (L x W x H)<br />
Cable material<br />
Cable lengths<br />
±0.015 m/s (±0.05 ft/s)<br />
ABS, glass filled<br />
IP68<br />
11.9 x 4.3 x 6.3 cm (4.7 x 1.7 x 2.5 in.)<br />
Polyurethane jacketed<br />
1.5, 6.1, 12.2 and 30.5 m (5, 20, 40 and 100 ft)<br />
Depth measurement<br />
Method<br />
Accuracy (static)<br />
Range<br />
Diaphragm type: absolute pressure with single point calibration<br />
The larger of ± 2% of reading or ± 0.015 m (± 0.504 inches). Steady state temperature<br />
and static non-flowing water.<br />
3.05 m (0-10 ft)<br />
Resolution 0.01 value < 100; 0.1 value < 1000; 1.0 value ≥ 1000<br />
Portable meter specifications<br />
Specification<br />
Details<br />
Pollution degree 2<br />
Protection class<br />
Charging temperature<br />
Operating temperature<br />
II<br />
0 to 40 ºC (32 to 104 ºF)<br />
–20 to 55 ºC (-4 to 131 ºF)<br />
Storage temperature –20 to 60 ºC (-4 to 140 ºF )<br />
Enclosure rating<br />
Battery life gauge<br />
Battery type<br />
Battery life<br />
Battery charger<br />
Dimensions (L x W x H)<br />
IP67<br />
Five-segment bar graph<br />
Rechargeable lithium ion, 3.7 V, 4.2 Ah<br />
18 hours heavy typical day use 1 ; 20 ºC (68 ºF)<br />
External Class III power adapter 100–240 VAC, 50–60 Hz, 0.3 A input; 12 VDC, 1.0 A<br />
output<br />
21.8 x 9.3 x 5.3 cm (8.6 x 3.7 x 2.1 in.)<br />
<strong>English</strong> 3
Specification<br />
USB connector<br />
Material<br />
Details<br />
Type Mini-B, 5-pin, rated to IP67 when capped<br />
Polycarbonate with a thermoplastic elastomer (TPE) overmold<br />
1 Defined as 30 minutes of set up, six 1-hour periods of continuous use with an active sensor and the display at<br />
maximum brightness and 30 minutes of sleep mode between use periods, data download and power off.<br />
<strong>User</strong> interface specifications<br />
Specification<br />
Graphics display<br />
Details<br />
Color, LCD 3.5" QVGA transflective (readable in direct sunlight)<br />
Measurement resolution 0.01 value < 100; 0.1 value < 1000; 1.0 value ≥ 1000<br />
Keypad<br />
Operating modes<br />
Profile types<br />
Conduit shapes<br />
Stream entries<br />
Noise rejection<br />
Units of measure<br />
Alpha-numeric<br />
Real time, profiling<br />
Stream, conduit<br />
Circular, rectangular, trapezoidal, 2/3 egg, inverted 2/3 egg<br />
Fixed, non-fixed stations<br />
<strong>User</strong>-selectable, 50 Hz or 60 Hz<br />
Velocity: ft/s, m/s, cm/s, mm/s<br />
Flow: ft 3 /sec, million gal/day, gal/day, gal/min, m 3 /s, m 3 /min, m 3 /hour, m 3 /day, liters/s,<br />
liters/min<br />
Depth: in., ft, m, cm, mm<br />
Stream flow calculation<br />
Diagnostics<br />
Conduit profiling methods<br />
Stream profiling methods<br />
File types<br />
Languages<br />
Mean-section or mid-section method<br />
Self test, keypad, display, event log<br />
0.9 x Vmax, 0.2/0.4/0.8, velocity and level integrator, 2D<br />
1, 2, 3, 5 and 6 point (velocity method - USGS and ISO)<br />
Real-time, profiling, event log<br />
<strong>English</strong>, French, Spanish, German, Italian, Dutch, Danish, Swedish, Chinese, Polish,<br />
Japanese, Korean, Portuguese, Slovak, Russian, Hungarian, Bulgarian, Romanian,<br />
Czech, Turkish, Finnish, Greek<br />
General specifications<br />
Specification<br />
Profiles<br />
Maximum number of real-time files<br />
Firmware<br />
Details<br />
Data storage for up to 10 profiles with 32 stations per profile<br />
Three each with up to 75 readings captured by the user.<br />
The sensor and portable meter are field upgradeable via USB<br />
General information<br />
In no event will the manufacturer be liable for direct, indirect, special, incidental or consequential<br />
damages resulting from any defect or omission in this manual. The manufacturer reserves the right to<br />
make changes in this manual and the products it describes at any time, without notice or obligation.<br />
Revised editions are found on the manufacturer’s website.<br />
4 <strong>English</strong>
Safety information<br />
N O T I C E<br />
The manufacturer is not responsible for any damages due to misapplication or misuse of this product including,<br />
without limitation, direct, incidental and consequential damages, and disclaims such damages to the full extent<br />
permitted under applicable law. The user is solely responsible to identify critical application risks and install<br />
appropriate mechanisms to protect processes during a possible equipment malfunction.<br />
Please read this entire manual before unpacking, setting up or operating this equipment. Pay<br />
attention to all danger and caution statements. Failure to do so could result in serious injury to the<br />
operator or damage to the equipment.<br />
Make sure that the protection provided by this equipment is not impaired. Do not use or install this<br />
equipment in any manner other than that specified in this manual.<br />
Use of hazard information<br />
D A N G E R<br />
Indicates a potentially or imminently hazardous situation which, if not avoided, will result in death or serious injury.<br />
W A R N I N G<br />
Indicates a potentially or imminently hazardous situation which, if not avoided, could result in death or serious<br />
injury.<br />
C A U T I O N<br />
Indicates a potentially hazardous situation that may result in minor or moderate injury.<br />
N O T I C E<br />
Indicates a situation which, if not avoided, may cause damage to the instrument. Information that requires special<br />
emphasis.<br />
Precautionary labels<br />
This symbol, if noted on the instrument, references the instruction manual for operation and/or safety<br />
information.<br />
This symbol indicates the presence of devices sensitive to Electro-static Discharge (ESD) and<br />
indicated that care must be taken to prevent damage with the equipment.<br />
Electrical equipment marked with this symbol may not be disposed of in European public disposal<br />
systems after 12 August of 2005. In conformity with European local and national regulations (EU<br />
Directive 2002/96/EC), European electrical equipment users must now return old or end-of-life<br />
equipment to the Producer for disposal at no charge to the user.<br />
Note: For return for recycling, please contact the equipment producer or supplier for instructions on how to return endof-life<br />
equipment, producer-supplied electrical accessories, and all auxiliary items for proper disposal.<br />
Certification<br />
Canadian Radio Interference-Causing Equipment Regulation, IECS-003, Class A:<br />
Supporting test records reside with the manufacturer.<br />
This Class A digital apparatus meets all requirements of the Canadian Interference-Causing<br />
Equipment Regulations.<br />
Cet appareil numèrique de la classe A respecte toutes les exigences du Rëglement sur le matériel<br />
brouilleur du Canada.<br />
FCC Part 15, Class "A" Limits<br />
Supporting test records reside with the manufacturer. The device complies with Part 15 of the FCC<br />
Rules. Operation is subject to the following conditions:<br />
<strong>English</strong> 5
1. The equipment may not cause harmful interference.<br />
2. The equipment must accept any interference received, including interference that may cause<br />
undesired operation.<br />
Changes or modifications to this equipment not expressly approved by the party responsible for<br />
compliance could void the user's authority to operate the equipment. This equipment has been tested<br />
and found to comply with the limits for a Class A digital device, pursuant to Part 15 of the FCC rules.<br />
These limits are designed to provide reasonable protection against harmful interference when the<br />
equipment is operated in a commercial environment. This equipment generates, uses and can<br />
radiate radio frequency energy and, if not installed and used in accordance with the instruction<br />
manual, may cause harmful interference to radio communications. Operation of this equipment in a<br />
residential area is likely to cause harmful interference, in which case the user will be required to<br />
correct the interference at their expense. The following techniques can be used to reduce<br />
interference problems:<br />
1. Disconnect the equipment from its power source to verify that it is or is not the source of the<br />
interference.<br />
2. If the equipment is connected to the same outlet as the device experiencing interference, connect<br />
the equipment to a different outlet.<br />
3. Move the equipment away from the device receiving the interference.<br />
4. Reposition the receiving antenna for the device receiving the interference.<br />
5. Try combinations of the above.<br />
Product overview<br />
The portable velocity system is used in the field, laboratory and municipalities. Turbulent, noisy and<br />
low flows can be measured with this system.<br />
The meter and sensor get velocity information in conduits and streams. These measurements are<br />
important for calibration in municipal wastewater industries, as well as for environmental-impact<br />
evaluations.<br />
Two types of sensor are available: velocity-only and velocity plus depth. This manual covers both<br />
types of sensors. If information applies to a specified type of sensor, this fact is noted in the text.<br />
System overview<br />
An overview of the assembled system is shown in Figure 1. Refer to the documentation supplied with<br />
the individual components or accessories for more information.<br />
6 <strong>English</strong>
Figure 1 Assembled components<br />
1 Portable meter 5 Adjustable mount for portable meter<br />
2 Sensor height lock/release device 6 Sensor assembly<br />
3 Top setting wading rod (optional accessory) 7 Flow direction<br />
4 Sensor cable<br />
Sensor overview<br />
Figure 2 shows the main sensor components. Instructions for how to attach the sensor on a standard<br />
or top-setting wading rod are supplied with the accessory.<br />
<strong>English</strong> 7
Figure 2 Sensor components<br />
1 Sensor electrodes 5 Pressure cell (sensors with depth option)<br />
2 Sensor body 6 Sensor with depth option<br />
3 Sensor connection plug 7 Sensor without depth option<br />
4 Sensor attachment thumb screw<br />
Meter overview<br />
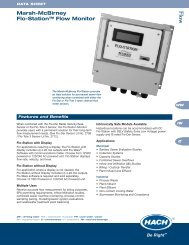
Figure 3 shows the features of the meter.<br />
Figure 3 Meter components<br />
1 USB connection port 6 Threaded hole for adjustable meter mount<br />
2 Keypad 7 Slots for velcro or strap attachment<br />
3 Meter display 8 Slot for neck strap attachment threads (2x)<br />
4 Expansion port (not used) 9 Sensor connection port<br />
5 Battery compartment cover 10 Wall-charger connection port<br />
Product components<br />
When purchasing a complete system, refer to Figure 4 to make sure that all components have been<br />
received. If any of these items are missing or damaged, contact the manufacturer or a sales<br />
representative immediately.<br />
8 <strong>English</strong>
Figure 4 System components<br />
1 Carrying case (with slot for sensor cable) 7 Cloth to dry the sensor<br />
2 USB communication cable 8 Universal sensor mount<br />
3 Adjustable portable meter mount 9 Velcro strap<br />
4 Wall charger and universal plug kit 10 Lanyard<br />
5 Sensor 11 Portable meter<br />
6 Extra thumb screws (4x) 12 Sensor as connected to meter inside case<br />
Installation<br />
Installation with optional accessories<br />
Mount the meter on an optional wading rod for use in low-stage stream environments where the<br />
stream can be waded. Optional accessories let the user take measurements from a bridge or cable<br />
over a stream. A torpedo shaped weight attached below the sensor keeps the sensor in place when<br />
under water. For more information, refer to the documentation supplied with the accessory.<br />
Install the sensor on the universal sensor mount<br />
Use the universal sensor mount to attach the sensor to poles 1 inch or less in diameter. For correct<br />
operation and accurate readings, the front of the sensor must be pointed upstream with the<br />
electrodes in full contact with the flow.<br />
Note: Keep the sensor electrodes free from nonconductive substances such as oil and grease. To remove sensor<br />
contamination, refer to Clean the sensor on page 26.<br />
1. The front part of the sensor is round and contains three electrodes. The sensor has a mounting<br />
hole in back and a thumbscrew on top. Put the mounting shaft of the universal mount in the<br />
mounting hole at the back of the sensor. Make sure that the mounting shaft is completely<br />
engaged with the mounting hole and the thumbscrew is engaged with the groove.<br />
2. Hand tighten the thumbscrew.<br />
3. Move a pole 1 inch or less in diameter through the clamp of the universal sensor mount. Tighten<br />
the clamp.<br />
Note: Instructions for how to mount the sensor on a standard or top setting wading rod are supplied with the<br />
accessory.<br />
<strong>English</strong> 9
Connect the sensor to the meter<br />
Attach the lanyard<br />
Attach the lanyard to wear the meter safely around the neck.<br />
10 <strong>English</strong>
Attach the velcro strap<br />
Use the velcro strap to hold the extra cable. Refer to Figure 5.<br />
Figure 5 Attach the velcro strap<br />
1 Loop side 2 Hook side<br />
<strong>User</strong> interface and navigation<br />
Keypad and key functions<br />
Figure 6 shows the meter keypad. Table 1 gives the functions of each key or key type.<br />
<strong>English</strong> 11
Figure 6 Keypad<br />
1 Power On/Off 6 Main Menu<br />
2 OK 7 Underscore or decimal<br />
3 Up and Down arrows 8 Backspace<br />
4 Quick Jump 9 Alpha-numeric<br />
5 Right and Left arrows 10 Previous menu<br />
Table 1 Key description<br />
Key<br />
Power On/Off<br />
OK<br />
Up and Down arrows<br />
Quick Jump<br />
Right and Left arrows<br />
Main Menu<br />
Underscore or decimal<br />
Backspace<br />
Alpha-numeric<br />
Previous menu<br />
Description<br />
Energizes and de-energizes the meter.<br />
Confirms an entry or highlighted menu option.<br />
Moves up or down in the display. If the cursor is at the top or bottom of the display, the<br />
cursor wraps to the bottom or top when the UP or DOWN arrow is pushed.<br />
In normal operation, this key jumps to the Select conduit shape screen.<br />
If the auto-zero feature is disabled, hold this key for five seconds to do a manual zero of<br />
the depth sensor.<br />
In Real-Time mode, the Quick Jump key toggles between the digital and graph views.<br />
Moves to the right or left in the display.<br />
Moves to the Main Menu from any submenu or screen.<br />
Puts in an underscore or decimal character. In numeric-only fields, this key automatically<br />
puts a decimal point in the cursor position.<br />
Moves the cursor back one space.<br />
Puts in the key alpha or numeric value. Values are put in the order shown on the key.<br />
After 2 seconds, the value shown in the display is stored and the cursor advances.<br />
Moves to the previous screen.<br />
Status bar<br />
A status bar is shown in the top of the display. Descriptions of the information in the status bar are<br />
given in Table 2.<br />
12 <strong>English</strong>
Table 2 Status bar indicators<br />
Indicator<br />
Time and Date<br />
USB<br />
Conductivity<br />
Battery<br />
File access<br />
Auto zero depth<br />
indicator<br />
Description<br />
Shows the current time and date.<br />
Shows when a USB cable is connected. If a USB cable is connected and this indicator<br />
does not show in the status bar, the USB cable is not fully engaged. Make sure that the<br />
USB cable is pushed in completely and makes full contact with the connection port.<br />
If the sensor is out of the water and non-conductive, a blue ring appears next to the<br />
battery icon. If the sensor is in the water and conductive, the indicator is a solid blue<br />
circle.<br />
A five-bar graph shows the level of charge in the battery.<br />
Shows while the meter gets access to a file.<br />
If the depth sensor was zeroed in the last 30 minutes, a solid green circle shows next to<br />
the Conductivity indicator. If the depth sensor was not zeroed in the last 30 minutes,<br />
this indicator flashes red.<br />
Navigation and Main Menu<br />
Push OK to confirm a selected menu option or a value shown in the display. Select More and push<br />
OK to see additional screens and options if available. Push the Main Menu button to go to the Main<br />
Menu from a submenu.<br />
Note: Some operations cannot be completed unless a sensor is connected to the meter. If these operations are<br />
tried when there is no sensor connected, the display shows an error message. Connect a sensor and try the<br />
operation again.<br />
1. Real time—Select this option to get real-time velocity and depth information. (A sensor with<br />
depth capability is necessary to read depth). An example of a Real Time screen for sensors with<br />
velocity only is shown in Figure 7. Real time screens for sensors with both velocity and depth is<br />
shown in . The format of the information and options shown depends on the type of sensor used.<br />
In Real Time mode, the Quick Jump key toggles between digital and graphic views of Real Time<br />
information. The velocity is updated in FPA filter mode according to fixed period averaging time.<br />
In RC filter mode, the velocity is updated continuously on the screen every 250 ms.<br />
Option<br />
Capture<br />
Save<br />
Done or OK<br />
Clear<br />
Description<br />
Stores the depth and velocity information shown in memory. The information is saved until<br />
power is cycled, the memory is saved to a non-volatile real-time file, or the user exits from realtime<br />
mode.<br />
Saves captured measurements in the volatile memory to a non-volatile real-time file. A<br />
message will show if the number of files is greater than the maximum possible. Files are<br />
stored in tab delimited (.tsv) format.<br />
Exits the real-time mode and returns to the Main Menu. If there is unsaved data in volatile<br />
memory, a confirmation message asks the user to confirm the exit without saving the data.<br />
Clears captured measurements from the volatile memory buffer. The user can choose from<br />
Clear Last, Clear All or Cancel options.<br />
<strong>English</strong> 13
Option<br />
Setup<br />
Files or<br />
View<br />
Description<br />
Allows the user to modify the main filter parameters and enable and program the Maximum<br />
Depth sensor positioning feature. The Maximum depth feature allows a user to enter system<br />
parameters for depth measurement in Real Time mode. The user can choose to enter a<br />
maximum depth value taken directly with a ruler measurement (manual), or taken indirectly<br />
with the depth measurement (automatic). Both methods enable the Maximum Depth sensor<br />
positioning feature.<br />
In automatic mode setup, the user directly enters the distance from the bottom of the channel<br />
to the bottom of the sensor mount (offset). The setup interface will continuously show the<br />
current depth value returned by the sensor plus the offset. The meter stores this value as the<br />
Maximum Depth when the OK button is pushed. In all other cases, the depth values shown do<br />
not include the offset.<br />
The Maximum depth feature requires a sensor with velocity plus depth.<br />
Shows a summary of each real-time file stored in non-volatile memory. Files can be<br />
individually viewed and deleted.<br />
Figure 7 Real time screen<br />
14 <strong>English</strong>
Figure 8 Real time screen for sensor with depth<br />
2. Profiler— Select this option to do stream or conduit velocity measurements. The meter shows<br />
prompts when user input is necessary. The meter saves up to 10 profiles with up to 32 stations<br />
per profile. This number can be greater if data acquisition time is less than the maximum. A<br />
percentage of the remaining memory is given in 1% resolution. Refer to the Appendix<br />
on page 31 for more information about profiles.<br />
Option<br />
Stream<br />
Conduit<br />
Files<br />
Setup<br />
Description<br />
This option is used to set up a profile for a stream or flowing channel. Do velocity measurements to<br />
calculate total discharge based on ISO 748 or USGS standards for Mid-section or Mean-section<br />
methods.<br />
This option is used to set up a profile for a conduit.<br />
This option is used to view or delete stored files. Files can be deleted all at once or individually.<br />
This option is used to set up or change the settings for filter parameters and the Maximum Depth<br />
feature.<br />
3. Set up—Select this option to change general system settings and preferences.<br />
Option<br />
Velocity<br />
calibration<br />
Description<br />
Calibrates the sensor. Adds a field offset to the factory calibration. Refer to the Appendix<br />
on page 31 for more information.<br />
<strong>English</strong> 15
Option<br />
Filter<br />
parameters<br />
Description<br />
Applies a data acquisition filter (Main filter or Pre-filter). The user can select the filter<br />
parameters.<br />
Main filter<br />
• Fixed Period Averaging (FPA)—Fixed Period Averaging averages data over a user<br />
selectable fixed period of time (1 to 480 seconds). The default is 10 seconds. If the FPA<br />
value is 5, the velocity value shown in the display is updated once every 5 seconds.<br />
• RCA time constant—The RC filter helps smooth out turbulence through the use of a<br />
selected time constant in the filter algorithm. This mode is useful when searching for a<br />
maximum velocity, for example in the common 0.9 x Vmax profile method. High RC filter<br />
time constants give higher degrees of smoothing. The time constant can be set from 2 to<br />
20 seconds, with a default value of 6. At 1 time constant, the filter settles to<br />
approximately 60% of the final value. At 5 time constants, the filter settles to 99.9% of<br />
the final value. Thus, if the RC value is set to 2, the final value shows after 10 seconds.<br />
Pre-filter<br />
• Median filter—The filtering process is done in the sensor. The feature can be disabled.<br />
However, the recommended (default) value is 5. Enable the feature to enter or change<br />
this value.<br />
Wet/dry<br />
threshold<br />
Auto zero<br />
depth<br />
EMI<br />
Clock<br />
USB<br />
Sets the sensor submersion threshold for wet and dry conditions. The default value is 20%.<br />
Refer to Wet/Dry threshold on page 33 for more information.<br />
Sets the Auto Zero feature to On or Off.<br />
If set to On, the instrument does an air calibration when the sensor is removed from the<br />
water and is in the air. To do the air calibration, the instrument automatically zeroes the<br />
sensor.<br />
If set to Off, the user can manually zero the sensor. To do this, remove the sensor from the<br />
flow, then push and hold the Quick Jump key for five seconds.<br />
When the sensor has been in the flow for 30 minutes, the green circle in the upper right<br />
corner goes from green to red. This is a prompt to the user to remove and zero the sensor<br />
again.<br />
Sets the local line frequency for ambient noise rejection to 50 Hz or 60 Hz (default).<br />
Sets the date and time of the portable meter in 24-hour format. Daylight savings time is not<br />
supported.<br />
Sets the USB mode.<br />
• Mass Storage (default)—This mode operates like a memory stick or hard drive. Files are<br />
read-only.<br />
• CDC—This mode is used to update firmware.<br />
Language<br />
Units<br />
Beeper<br />
Flow<br />
calculation<br />
Selects the language used in the menus.<br />
Sets the units for velocity, flow and depth measurements. Options are Metric or <strong>English</strong><br />
(default).<br />
On (default) or Off. If set to On, the meter makes an audible tone when the sensor is at the<br />
correct depth for applicable profile methods. The meter also makes an audible tone when<br />
an inactive button is pushed in any menu. This feature is available only with the optional<br />
depth sensor.<br />
Selects the method of flow calculation for open water segment (stream profiles only).<br />
Options are Mean-section or Mid-section. Refer to the Appendix on page 31 for more<br />
information.<br />
16 <strong>English</strong>
Option<br />
Station entry<br />
Restore<br />
defaults<br />
Description<br />
• Fixed—The operator puts in the width of the stream and the number of stations for<br />
measurements. The meter divides the cross-section into evenly spaced distances<br />
between the station verticals.<br />
• Non-fixed (default)—The operator selects the spacing between station verticals. This is<br />
the more commonly used option as it lets the operator include obstructions and other<br />
restrictions in the cross section.<br />
Sets all meter options to the factory default values.<br />
4. Diagnostics— Select this option to troubleshoot problems with the meter or an attached sensor.<br />
For more information about the Diagnostics options, refer to Diagnostics on page 28.<br />
Startup and self-test<br />
D A N G E R<br />
Chemical or biological hazards. If this instrument is used to monitor a treatment process and/or<br />
chemical feed system for which there are regulatory limits and monitoring requirements related to<br />
public health, public safety, food or beverage manufacture or processing, it is the responsibility of the<br />
user of this instrument to know and abide by any applicable regulation and to have sufficient and<br />
appropriate mechanisms in place for compliance with applicable regulations in the event of malfunction<br />
of the instrument.<br />
W A R N I N G<br />
Fire and explosion hazards. Do not use or store the instrument in direct sunlight, near a heat source or<br />
in high temperature environments such as a closed vehicle in direct sunlight. Failure to take this<br />
precaution can make the battery overheat and cause a fire or explosion.<br />
The battery must be installed in the meter and charged before use. For more information about<br />
battery installation and replacement, refer to Install or replace the battery on page 27. For<br />
information on how to charge the battery, refer to Charge the battery on page 28.<br />
Note: The meter is not operational while the battery charges.<br />
1. Push the meter power button until an audible beep is heard.<br />
The meter does a self test and the display shows the results. If the meter fails the self-test, the<br />
display shows FAIL next to the failed parameter. If the sensor fails, attach a different sensor if<br />
available.<br />
2. When the self test is complete, push OK to go to the Main Menu.<br />
3. To de-energize the meter, push the power button again. In the Confirmation screen, select Yes<br />
and push OK.<br />
If the portable meter becomes unresponsive, push and hold the power button for more than<br />
3 seconds to force the power off. Do not force off the power in normal operation or when the file<br />
access icon is visible.<br />
Sleep mode<br />
The meter backlight goes dim after 30 seconds of no activity and goes into sleep mode after<br />
60 seconds of no activity. These actions do not occur if the meter is in real-time mode or while the<br />
meter is measuring. After 30 minutes in sleep mode, the meter power goes off.<br />
To cancel the sleep mode, push any key. The display brightness goes back to the normal level and<br />
all keys go back to their normal functions.<br />
<strong>English</strong> 17
Operation<br />
Stream profiles<br />
Stations and station spacing<br />
For a well-chosen cross-section, division into 25 to 30 partial sections is typically sufficient. If the<br />
cross-section is very smooth and the velocity distribution very consistent, it is possible to decrease<br />
the number of stations.<br />
Make the distance between the partial stations so that no individual station contains more than 10%<br />
of the discharge. The ideal measurement is one in which each partial station contains 5% or less (≤<br />
5%) of the total discharge, but this is rarely possible when 25 stations are used. Partial stations<br />
should not have equal widths across the entire cross-section unless the discharge is well-distributed.<br />
Distances between stations are generally smaller where water depth and flow velocities change<br />
significantly. Places where depth and velocities frequently change significantly include bank areas,<br />
vertical or steep slopes, ledges in divided cross-sections and transitions from the main stream bed to<br />
the foreland. Stations should also be located at points of significant changes in the stream bed<br />
profile.<br />
The measurement cross-section must be set at right angles to the direction of flow. Cross-sections<br />
must not contain still areas, counter currents or eddies. Do not put the sensor in deep pools, below<br />
large inflows, or near ship moorings, ferries or sluices.<br />
Use Table 3 as a guide for the number of stations necessary for an acceptable measurement. The<br />
information is based on EN - ISO 748 standards.<br />
Table 3 Number of stations in relation to the waterway width<br />
Feet Meters Number of stations<br />
< 1.6 < 0.5 5 to 6<br />
> 1.6 and < 3.3 > 0.5 and < 1 6 to 7<br />
> 3.3 and < 9.8 > 1 and < 3 7 to 12<br />
> 9.8 and < 16.4 > 3 and < 5 13 to 16<br />
> 16.4 ≥ 5 ≥ 22<br />
Measure velocity<br />
Measurement quality is dependent on the correct selection of a measurement cross-section. Select a<br />
section of stream with the following characteristics:<br />
• The flow directions at each measurement point across the stream are parallel to the bank and<br />
perpendicular to the cross-section.<br />
• The streambed is stable and free of large rocks, weeds and protruding obstructions such as piers<br />
that cause turbulence.<br />
It is often not possible to completely satisfy all of these conditions. Use the criteria to select the best<br />
possible section and then select a cross-section.<br />
The general procedure to take velocity measurements in river and stream profiles is described below.<br />
Make the first measurement in a stream profile at the top. Make each subsequent measurement<br />
below the last one.<br />
• In fixed mode, divide the channel into stations of equal width.<br />
• Conduct a velocity measurement at each station. The portable meter shows and stores the depth<br />
and measured velocity information.<br />
• When the stream profile is completed, the meter automatically calculates the total flow.<br />
For accurate measurement results, stand to the side of the instrument. Refer to Figure 9.<br />
18 <strong>English</strong>
Figure 9 Position of user in the flow<br />
Measure velocities in a cross-section<br />
A typical stream cross-section is shown in Figure 10.<br />
Figure 10 Example of a typical cross section<br />
To measure velocities in a cross-section:<br />
1. In the Main Menu, select Profiler.<br />
2. Enter the Operator name. A list of options will show.<br />
Option<br />
Stream<br />
Conduit<br />
Description<br />
Used for measurements in a stream profile.<br />
Used for measurements in a conduit profile.<br />
<strong>English</strong> 19
Option<br />
Files<br />
Setup<br />
Description<br />
Used to view or delete files.<br />
Used to set up filter parameters and the Maximum depth feature.<br />
3. Select Setup > Maximum depth. Select <strong>Manual</strong> or Automatic.<br />
Option<br />
<strong>Manual</strong><br />
Automatic<br />
Description<br />
In this mode, the instrument prompts the user to manually enter the maximum depth of each<br />
vertical. This value is normally obtained from a wading rod.<br />
In this mode (available only on sensors with the depth option), the instrument uses the pressure<br />
transducer to measure the maximum depth at each vertical.<br />
a. If Automatic is selected, enter the distance from the bottom of the channel to the bottom of the<br />
sensor mount.<br />
b. Put the sensor at the lowest position on the wading rod.<br />
c. Enter the minimum depth (measured from the bottom) that the sensor can read. Refer to<br />
Figure 11.<br />
Figure 11 Minimum depth<br />
4. Select Top or Bottom for the measurement reference then push OK.<br />
5. If necessary, change or update the filter parameters in Profiler Setup.<br />
6. In the Profiler menu, select Stream.<br />
7. Enter a name for the stream profile. Make profile names alpha-numeric with a maximum of<br />
11 characters. Push OK to save the profile name or select Clear to delete all current stream<br />
profile data.<br />
8. Enter the stage reference. This is typically an elevation value from an immovable object such as a<br />
survey marker or bridge, etc.<br />
20 <strong>English</strong>
9. In the Station menu, select Edge/Obstruction. Select one of the options.<br />
Option<br />
Left<br />
Right<br />
Open water<br />
Description<br />
Select this option if the station is at the left edge of the water or an obstruction (i.e, sandbar,<br />
pylon or large boulder).<br />
Use this option if the station is at the right edge of water or an obstruction (i.e., sandbar, pylon<br />
or large boulder).<br />
Use this option to configure the edge as an open water environment (default).<br />
10. Select Distance to Vertical and enter the information.<br />
11. Select Set Depth and enter the information. If at an edge, the meter automatically sets this value<br />
to 0.00.<br />
a. If <strong>Manual</strong> mode was selected in the Profiler setup, enter the total depth of water at this vertical<br />
position.<br />
b. If Automatic mode was selected in the Profiler setup, push OK to set the maximum flow depth<br />
at the value shown.<br />
12. If Left or Right was selected in Step 9, enter an edge factor for the vertical. Select a factor from<br />
the list or <strong>User</strong>-defined. For <strong>User</strong>-defined values, enter a roughness factor between 0.50 (very<br />
rough) and 1.00 (smooth). The roughness factor is relevant only for right angled cross sections. It<br />
is used as a factor in the calculation of the discharge proportion of edge areas. For example:<br />
• Smooth edge with no vegetation (e.g., concrete, steel, cement)— 0.8 to 0.9<br />
• Brick sides with vegetation— 0.7<br />
• Rough walls with heavy vegetation—0.6 to 0.5<br />
13. Select Measure Velocity. Select the number of points on the vertical to collect.<br />
14. Select a measurement point from the list. Obey the instrument prompts and adjust the sensor to<br />
the correct depth. If the sensor has a depth option, adjust the sensor depth until the depth box is<br />
green. This means the sensor is in at the correct position.<br />
Note: Red indicates more adjustment is necessary. Yellow indicates the depth is close to the correct depth.<br />
15. Select Capture to start the measurement process.<br />
16. If necessary, the setup can be changed and the measurement can be repeated. When the<br />
measurement is complete, push OK to store the data.<br />
17. Repeat steps 13–16 for the other measurement points on the vertical.<br />
18. When all measurements for the station are complete, select Main or Verify. results. Push OK to<br />
return to the list of measurement points.<br />
Option<br />
Main<br />
Verify<br />
Description<br />
Returns to the station menu.<br />
Shows the average velocity reading for the station based on the measurement method.<br />
19. Select Next to go to the next station.<br />
20. Repeat steps 10–19 for the remaining stations.<br />
21. When all measurements for all stations in the profile are complete, select Channel Summary to<br />
view the results.<br />
Note: A warning flag will show if the discharge in one or more segments is > 5% of the total discharge.<br />
Insert or delete a station<br />
Prev, Next, Ins and Del options show at the bottom of the display in the Station screen. Prev and<br />
Next are used to navigate to a previous or subsequent station. Ins and Del are used to insert or<br />
delete a station.<br />
<strong>English</strong> 21
For example, after measurements have been done at 10 stations, a user may wish to insert a new<br />
station between stations 3 and 4. The steps below describe how to do this. These steps can be<br />
applied in similar situations.<br />
1. Select Prev and push OK until the display shows the information for Station 3.<br />
2. Select Ins and push OK.<br />
The instrument adds a new station named Station 4. Subsequent stations are automatically given<br />
new sequential numbers.<br />
3. To delete the current station (when in non-fixed mode), select Del and push OK.<br />
Conduit profiles<br />
It is possible to use all of the methods for conduit profiles in this section in sites with a typical profile<br />
shape and sufficient depth to measure 3-point velocities. The 0.9 x Vmax method can also be used<br />
when the depth is not sufficient for multi-point profiles.<br />
Note: In typical conduit profiles, the first measurement is made at the bottom. Subsequent measurements are<br />
made above the one made before. A different procedure may be necessary for some profiles.<br />
1. In the Main Menu, select Profiler.<br />
2. Enter the operator name.<br />
3. In the list of options, select Conduit.<br />
4. Enter a name for the new Conduit profile.<br />
5. Select the conduit shape.<br />
Note: The input screens that show next depend on the shape selected.<br />
6. Enter values at the screen prompts.<br />
When the necessary values have been entered, the display shows the Select Method menu.<br />
7. Select a profile method and do the steps for the method.<br />
Option<br />
Description<br />
0.9 x Vmax The meter calculates flow based on 90% of the fastest velocity. This is the recommended<br />
method when the depth is less than 12.7 cm (5 in.) or when the velocity is not stable.<br />
0.2/0.4/0.8 The meter calculates the flow value based on velocity measurements taken at 0.2, 0.4 and<br />
0.8 x the depth. One and two-point versions of this method are also possible.<br />
Vel./Lev. Integ.<br />
The meter integrates 10 separate velocity and level measurements to calculate the flow<br />
level.<br />
2D<br />
The sensor collects information while constantly moved through the flow in a specified<br />
pattern. The meter calculates the flow value when the user selects Save. This method is<br />
recommended for flows where a difference of 30% or more exists between the right and left<br />
side velocities.<br />
0.9 x Vmax measurement method<br />
The meter uses the maximum velocity measurement in the conduit and multiplies this value by 0.9 to<br />
calculate the total flow.<br />
Note: The RC filter mode with a value of 2 to 4 seconds is recommended for this method.<br />
1. In the Select Method menu, select 0.9 x Vmax.<br />
2. With the sensor in the flow, select Measure Velocity to get a velocity measurement.<br />
The measured values are shown on the graph.<br />
3. Move the sensor until a point of maximum velocity is found, then push OK.<br />
The meter calculates and shows the flow, maximum and average velocity values.<br />
4. Select Save.<br />
The information is saved to a data file.<br />
22 <strong>English</strong>
0.2/0.4/0.8 method<br />
Do measurements at one, two or three points to calculate an average velocity. Each point represents<br />
a percentage of the maximum depth as measured on the center line as shown in Figure 12.<br />
Figure 12 2-4-8 profile<br />
1. In the Select Method menu, select 0.2/0.4/0.8.<br />
2. Select one of the options.<br />
Option<br />
One point<br />
Two point<br />
Three point<br />
Description<br />
One-point measurement at 0.4 x maximum depth<br />
Two-point measurement at 0.2 and 0.8 x maximum depth<br />
Three-point measurement at 0.2, 0.4 and 0.8 x maximum depth<br />
3. For the selected option, select a measurement point. The meter shows the sensor adjustment<br />
information.<br />
4. If necessary, adjust the sensor as necessary.<br />
5. Select Capture.<br />
The meter gets information from the sensor and shows the velocity value in numerical and<br />
graphical form.<br />
6. If necessary, select Setup to change the Y-axis range or the data filter parameters.<br />
7. Push OK.<br />
8. Do steps 3–7 for all of the other measurement points then push OK to return to the list of<br />
measurement points.<br />
9. Select Flow.<br />
10. Select Save to save the information to a data file.<br />
Velocity/Level Integration measurement method<br />
Measurements are done at 10 different depths. The results from all segments are integrated to<br />
calculate the flow value.<br />
• Select Prev or Next to go to another measurement.<br />
• Select Main to return to the Select Method menu.<br />
1. In the Select method menu, select Vel./Lev. Integ.<br />
The display shows the first measurement screen.<br />
2. Select Measure Velocity.<br />
The sensor depth information is shown.<br />
<strong>English</strong> 23
3. If necessary, adjust the sensor depth as shown.<br />
4. Select Capture.<br />
The handheld unit gets information from the sensor and shows the average velocity value in<br />
numeric and graphical form.<br />
5. If necessary, select Setup to change the Y-axis range in FPA filtering mode, the X and Y-axis<br />
range when in RC filtering mode or the data filter parameters.<br />
6. Push OK to confirm the information.<br />
7. Select Next. The next measurement screen in the series appears.<br />
8. Do steps 2–7 for the other measurement depths.<br />
9. Select one of the options at the bottom of the screen.<br />
Option<br />
Save<br />
Units<br />
Description<br />
Calculates the current flow value and saves this information to a data file.<br />
Changes the unit type (<strong>English</strong> or Metric).<br />
2D measurement method<br />
Velocity is measured while the sensor is moved through the flow as shown in Figure 13.<br />
Select Cancel at any time to cancel the measurement and return to the Select Method menu.<br />
Note: The RC filter mode with a value of 2 to 4 seconds is recommended for this method.<br />
1. In the Select method menu, select 2D.<br />
The sensor depth information is shown.<br />
2. If necessary, adjust the sensor depth.<br />
3. Select Capture. While the sensor collects data, move the sensor through the entire cross-section<br />
in the pattern shown in Figure 13.<br />
4. If necessary, select Setup to change the Y-axis range in FPA filtering mode, the X and Y-axis<br />
range when in RC filtering mode or the data filter parameters.<br />
5. Push OK.<br />
6. Select one of the options shown at the bottom of the screen.<br />
Option<br />
Save<br />
Units<br />
Description<br />
Calculates the current flow value and saves this information to a data file.<br />
Changes the unit type (<strong>English</strong> or Metric).<br />
Figure 13 Path of the sensor in the flow<br />
1 Start 2 Finish<br />
24 <strong>English</strong>
Download data<br />
The meter directory is Read Only. In Windows, the meter operates as a mass storage device or<br />
removable hard drive.<br />
1. Set the meter to USB Mass Storage mode.<br />
2. To edit the data in a file, drag and drop the file to a laptop or PC. File names are limited to eight<br />
characters.<br />
3. Data files are kept in the tab separated variable (.TSV) format. To see files in Microsoft ® Excel,<br />
double or right-click a file and open the file with Excel.<br />
Real time files are stored in a directory called RT. Stream and conduit profile files are stored in a<br />
directory called P.<br />
Delete data files<br />
1. To delete all files from USB memory:<br />
a. Go to Main Menu > Diagnostics > Delete Files.<br />
b. In the confirmation window, select Yes.<br />
c. Push OK once to delete the files, then one more time to return to the previous screen.<br />
2. To delete Real Time files:<br />
a. Go to Main Menu > Real-Time > Files.<br />
b. Select Delete All or use the UP or DOWN arrow to select a file in the list.<br />
c. Push OK once to delete the files, then one more time to return to the previous screen.<br />
3. To delete Profiler files:<br />
a. Go to Main Menu > Profiler > Files.<br />
b. Select Delete All or use the UP or DOWN arrow to select a file in the list.<br />
c. Push OK once to delete the files, then one more time to return to the previous screen.<br />
Maintenance<br />
Download the PVM utility<br />
The PVM utility is used to update the firmware in the portable meter. The PVM Utility is available at<br />
http://www.hach.com or http://www.hachflow.com. Do the steps listed for the selected URL.<br />
1. Go to http://www.hach.com.<br />
2. Search for <strong>FH950</strong>.<br />
3. Select the product.<br />
4. Click the Downloads tab.<br />
5. Click the download link.<br />
6. Click PVMSetup.msi.<br />
7. Select Save or Run.<br />
1. Go to http://www.hachflow.com.<br />
2. Click Data Management.<br />
3. Click Software Download Center.<br />
4. Click the <strong>FH950</strong> link.<br />
5. Click PVMSetup.msi.<br />
6. Select Save or Run.<br />
Update the firmware<br />
Note: All data files in mass storage are lost when the firmware is updated. To download data, refer to Download<br />
data on page 25.<br />
<strong>English</strong> 25
The PVM Utility is necessary for this procedure. To download the PVM Utility, refer to Download the<br />
PVM utility on page 25.<br />
This is the general procedure to update firmware for the meter and sensor. To update the sensor<br />
firmware, the sensor must be connected to the meter.<br />
1. Double-click the PVM Utility desktop icon.<br />
2. Push the power button on the meter. When the meter self-test is complete, push OK.<br />
3. In the Main Menu, select Setup, then push OK.<br />
4. Select USB>CDC, then push OK.<br />
5. Connect the USB cable to the portable meter and the PC.<br />
6. In the PVM Utility window, select Connect.<br />
7. In the drop-down menu, select the PVM (COM X) port, where COM X is the virtual port number<br />
assigned to the PVM by Windows. Push OK.<br />
8. In the left-side panel, select Firmware Update, then select the Meter or Sensor tab.<br />
9. Select the correct firmware version, then click Start.<br />
The firmware download starts. A "Firmware update successful" message shows when the<br />
download is complete. For meter updates, the instrument display turns off until the instrument<br />
completes the update. Then, the instrument automatically resets and powers up again after a few<br />
minutes. Do not try to make the instrument power on or off before the update process is<br />
complete.<br />
10. In the Main Menu, select Diagnostics > About. Make sure that the firmware versions for both the<br />
Handheld Boot and the Handheld Application are correct.<br />
Clean the sensor<br />
W A R N I N G<br />
Chemical exposure hazard. Obey laboratory safety procedures and wear all of the personal protective<br />
equipment appropriate to the chemicals that are handled. Refer to the current material safety data<br />
sheets (MSDS) for safety protocols.<br />
Clean the sensor when unexpected increases or decreases in flow or level trends occur and after<br />
use in sandy or muddy waterways.<br />
For heavy contamination, soak the sensor in clear water for a few minutes to help make the<br />
contamination easy to remove.<br />
Disconnect the sensor from the meter before it is cleaned. Use only solutions listed as acceptable in<br />
Table 4 to clean the sensor. For sensors with a pressure cell (i.e., velocity plus depth sensors), make<br />
sure the holes for the pressure cell chambers are washed out and clear of contamination. Rinse the<br />
sensor with clean water before re-attaching the sensor to the assembly.<br />
Table 4 Acceptable and unacceptable cleaning solutions<br />
Acceptable<br />
Dish detergent and water<br />
Window cleaner<br />
Isopropyl alcohol<br />
Do not use<br />
Concentrated bleach<br />
Kerosene<br />
Gasoline<br />
Aromatic hydrocarbons<br />
26 <strong>English</strong>
Clean the meter<br />
1. Push the power button to de-energize the meter.<br />
2. Use a clean, moist cloth to clean the meter exterior. Mix the water with a mild detergent if<br />
necessary.<br />
3. Dry the meter exterior with a clean cloth. Let the meter dry in air completely before it is energized<br />
again.<br />
Note: Do not use paper-based cloths to clean the display. This type of cloth can cause damage to the display<br />
screen.<br />
Install or replace the battery<br />
W A R N I N G<br />
Personal injury hazard. This instrument contains one or more batteries. To prevent battery degradation,<br />
leakage or explosion, do not use or keep the instrument in places where the temperature is higher than<br />
the specified temperature limits of the instrument.<br />
W A R N I N G<br />
Fire and explosion hazards. Battery substitution is not permitted. Use only batteries that are supplied by<br />
the instrument manufacturer.<br />
W A R N I N G<br />
Multiple hazards. Do not disassemble the instrument for maintenance. If the internal components must<br />
be cleaned or repaired, contact the manufacturer.<br />
N O T I C E<br />
Discard used batteries promptly. Keep used batteries away from children. Do not disassemble the battery or<br />
discard the battery in fire.<br />
The instrument is shipped without the battery installed. Order new batteries from the instrument<br />
manufacturer. Refer to Replacement parts and accessories on page 29. Recycle or discard used<br />
batteries in accordance with local regulations.<br />
Note: If the instrument must be returned to the factory for repair or maintenance, remove the battery and put the<br />
battery in a protective cover before shipment.<br />
1. If necessary, remove the used battery as shown in Figure 14.<br />
2. Install a new battery in the same location and with the same orientation.<br />
3. Install the battery cover. Make sure that the cover is secure to keep the enclosure rating.<br />
4. Charge the battery if necessary. Refer to Charge the battery on page 28.<br />
<strong>English</strong> 27
Figure 14 Remove the battery<br />
Charge the battery<br />
Make sure that the correct plug-type for the geographic location is installed on the wall charger.<br />
Note: Battery charger substitution is not permitted. Use only the charger specified in the list of parts and<br />
accessories for the instrument. Refer to Replacement parts and accessories on page 29.<br />
A lithium ion battery in the meter supplies power to both the meter and the sensor. Install and charge<br />
the battery before the instrument is used.<br />
A full battery charge will supply power to the system for approximately 10–11 hours with constant<br />
use. When the level of battery charge drops to 3.4 V or less, the display shows a warning and the<br />
meter automatically powers off. The battery must be charged before the unit becomes functional<br />
again.<br />
1. Connect the round end of the charger cable to the power jack of the portable meter. Refer to<br />
Figure 3 on page 8.<br />
2. Connect the wall charger plug to a power outlet.<br />
A blue light shows around the charge port while the battery charges. When the charge process is<br />
complete, the blue light goes off. A discharged battery gets a full charge in about 8 hours.<br />
Note: The meter is not operational while the battery charges. The battery does not charge through the USB<br />
cable connection.<br />
Troubleshooting<br />
Diagnostics<br />
In the Main Menu, select Diagnostics to see information about the meter and do the diagnostic tests<br />
in Table 5.<br />
Table 5 Meter diagnostics<br />
Option<br />
About<br />
Delete files<br />
Sensor<br />
Self test<br />
Key pad test<br />
Description<br />
Shows information about the meter and the sensor. Includes the serial number and the firmware<br />
version.<br />
Deletes all files from memory to make space for new measurements. Make sure that the data is<br />
downloaded to a PC before this option is selected. The system automatically reformats the<br />
memory after file deletion.<br />
Shows diagnostic information about the sensor.<br />
Makes the meter do a diagnostic self test.<br />
Does a test of any button to make sure that the button is functional.<br />
28 <strong>English</strong>
Table 5 Meter diagnostics (continued)<br />
Option<br />
Display test<br />
Event log<br />
Description<br />
Does a test on the display to make sure that the display is functional.<br />
Lets the user see, delete or export the event log. Export the event log to make the contents<br />
available as an accessible file through USB mass storage. This option is used primarily by factory<br />
service.<br />
Troubleshoot errors<br />
The meter and sensor contain no user-serviceable parts. For the errors and messages listed, try the<br />
corrective action.<br />
If the problem does not go away or a problem occurs that is not in the list, contact the manufacturer.<br />
Message or problem<br />
Sensor is not connected<br />
Value is out of range<br />
Sensor data is known to be not correct<br />
or not accurate<br />
Sensor is not recognized<br />
Display is dim or is not visible<br />
Data is not available or access to the<br />
data is not possible<br />
Meter is unresponsive<br />
Solution<br />
Connect a sensor and try the action again.<br />
Change the measurement parameters or put in a different value, then<br />
try the action again.<br />
Clean the sensor and test.<br />
Check the sensor connection. Make sure that the lock nut on the<br />
connection port is tight (finger-tighten only).<br />
Push a key on the keypad.<br />
Make sure that the USB option (Main Menu) is set to Mass Storage.<br />
Push and hold the power button for at least 3 seconds. This deenergizes<br />
the meter. Energize the meter again.<br />
Note: Do not use this method to power off while in normal operation or if the file<br />
access icon is visible in the display.<br />
Replacement parts and accessories<br />
Note: Product and Article numbers may vary for some selling regions. Contact the appropriate distributor or refer to<br />
the company website for contact information.<br />
Replacement parts<br />
Table 6 Velocity only sensor<br />
Description<br />
Sensor with 1.5 m (5 ft) cable<br />
Sensor with 6.1 m (20 ft) cable<br />
Sensor with 12.2 m (40 ft) cable<br />
Sensor with 30.5 m (100 ft) cable<br />
Item no.<br />
EM950.0005<br />
EM950.0020<br />
EM950.0040<br />
EM950.0100<br />
Table 7 Velocity with depth sensor<br />
Description<br />
Sensor with 1.5 m (5 ft) cable<br />
Sensor with 6.1 m (20 ft) cable<br />
Item no.<br />
EM950.1005<br />
EM950.1020<br />
<strong>English</strong> 29
Table 7 Velocity with depth sensor (continued)<br />
Description<br />
Sensor with 12.2 m (40 ft) cable<br />
Sensor with 30.5 m (100 ft) cable<br />
Item no.<br />
EM950.1040<br />
EM950.1100<br />
Table 8 Handheld meter<br />
Description<br />
<strong>English</strong>/Metric<br />
Item no.<br />
<strong>FH950</strong>.1<br />
Accessories<br />
Table 9 Wading rods<br />
Description<br />
Item no.<br />
Standard wading rod kit, <strong>English</strong> 75002<br />
Standard wading rod kit, Metric (includes the bullet items below)<br />
75002M<br />
• Bottom section for wading rod, <strong>English</strong>/Metric 43000M/43001M<br />
• Intermediate section for wading rod, <strong>English</strong>/Metric 43010M/43011M<br />
• Base plate for wading rod, <strong>English</strong>/Metric 43015M<br />
• Double-end hanger for wading rod, <strong>English</strong>/Metric 43020M<br />
Top set wading rod kit, <strong>English</strong> 75013<br />
Top set wading rod kit, Metric<br />
75013M<br />
Table 10 General accessories<br />
Description<br />
Item no.<br />
Absorbent wipe 9073500<br />
Adjustable meter mount 9071700<br />
Battery charger 9072600<br />
Carrying case 9073400<br />
Lanyard, double ended loop 9072700<br />
Lithium ion battery 9113100<br />
Suspension cable kit (includes bulleted items below) 1 75003<br />
• Sensor mount 42033<br />
• Link connector 43025<br />
• Weight hanger 43030XX01<br />
30 <strong>English</strong>
Table 10 General accessories (continued)<br />
Description<br />
Item no.<br />
• Weight pin 43035M<br />
• 6.8 kg (15 lb) lead weight 43040<br />
Thumb screw kit (includes four thumb screws) 9073200<br />
Universal sensor mount 75015<br />
USB cable 9070800<br />
1 Cable is ordered separately by the foot.<br />
Appendix<br />
Mean-section and Mid-section methods<br />
The user can select the Mean-section or the Mid-section method for flow calculations. The Meansection<br />
method divides the cross-section into individual flow segments. Pairs of adjacent verticals are<br />
the limits of the segments. The two edges of the cross-section are given values of 0 for the velocity<br />
and depth. The total flow is the sum of the partial flows of all segments. Figure 15 shows the<br />
definitions and the equation for the Mean-section method.<br />
Figure 15 Mean-section method<br />
Where:<br />
V = velocity at vertical<br />
b = distance to vertical from bank<br />
h = depth at vertical<br />
q = flow at vertical<br />
The Mid-section method also divides the cross-section into individual flow segments. With the Midsection<br />
method, the segments are not between verticals but are defined by half of the distance to<br />
<strong>English</strong> 31
neighbor verticals in each case. For this reason, the first and last verticals should be as near to the<br />
edges as possible (i.e., left edge of water (LEW) and right edge of water (REW)). Boundary<br />
conditions dictate the proximity of the first and last vertical to the edge of water.<br />
Experience shows that the Mid-section method gives more exact results compared to the Meansection<br />
method so it is the default setting. Figure 16 shows the definitions and equation for the Midsection<br />
method.<br />
Figure 16 Mid-section method<br />
Where:<br />
m = station number<br />
n = total number of stations<br />
V = velocity at vertical<br />
b = distance to vertical from bank<br />
h = depth at vertical<br />
q = flow at vertical<br />
Profiles and measurements<br />
Profiles can be set up for streams or conduits. Figure 17 shows an example of a typical profile shape<br />
in a conduit. In a typical profile, velocity is less near a wall or edge than at the center and decreases<br />
near the surface. Multiple velocity measurements in the profile are averaged to calculate the total<br />
flow. Measurements for conduit profiles are made from the bottom up. Measurements for stream<br />
profiles are made from the top down.<br />
In the Main Menu, select Profiler. The meter prompts for the operator name, the type of profile<br />
(stream or conduit) and the profile name. Do the instructions for the selected profile type.<br />
32 <strong>English</strong>
Figure 17 Typical profile<br />
1 Depth 2 Velocity<br />
Site selection<br />
A site with the typical profile shape gives the most accurate results. Visual inspection is typically<br />
sufficient to identify problem sites. Use the information in these guidelines to help select the best site.<br />
These guidelines apply to conduit and stream profiles.<br />
• The channel should have as much straight run as possible. If the length of the straight run is<br />
limited, the length upstream from the profile should be two times the downstream length.<br />
• The channel should be free of flow disturbances. The site must not have protruding pipe joints,<br />
sudden changes in diameter, contributing side-streams, outgoing side-streams or obstructions.<br />
Remove all rocks, sediment or other debris from the bottom of the pipe.<br />
• The flow should not have visible swirls, eddies, vortices, back-flow or dead zones.<br />
• Do not select areas immediately downstream from sharp bends or obstructions.<br />
• Do not select areas with converging or diverging flow (approaches to a flume) or vertical drops.<br />
• Do not select areas immediately downstream from sluice gates or places where the channel spills<br />
into a body of stationary water.<br />
Do a velocity calibration<br />
Use this feature to remove a velocity offset if necessary. The velocity offset stays active until the<br />
meter power is switched off.<br />
1. Collect a bucket of water from the water in the profile area. The bucket must be non-metallic and<br />
at least 20.32 cm (8 in.). The water depth must be at least 15.24 cm (6 in.).<br />
2. Put the sensor in the center of the bucket so that it does not touch the sidewall or the bottom of<br />
the bucket.<br />
3. Let the water become still.<br />
4. Let the velocity reading stabilize.<br />
5. Select Zero Velocity.<br />
Wet/Dry threshold<br />
The wet/dry threshold is the trigger point for the meter to know when the sensor is in or out of the<br />
water. This information is important because if the meter does not know that the sensor is under the<br />
<strong>English</strong> 33
surface of the water, the meter sets the velocity value to zero. For a profile or real-time reading, the<br />
meter prompts the user to submerge the sensor in the water.<br />
If the specific conductivity of the water being measured is very low, adjust the threshold value for the<br />
best performance. Go to Setup Menu>Wet/Dry Threshold.<br />
For troubleshooting, the present reading is used as a guide to set a custom threshold. Get a reading<br />
in the water (wet) and then out of the water (dry). The threshold value must be between the wet and<br />
dry value. For example, if the actual wet value is 17 and the actual dry value is 2, put in a threshold<br />
value half way between 2 and 17. The default value is 20.<br />
34 <strong>English</strong>
HACH COMPANY World Headquarters<br />
P.O. Box 389, Loveland, CO 80539-0389 U.S.A.<br />
Tel. (970) 669-3050<br />
(800) 227-4224 (U.S.A. only)<br />
Fax (970) 669-2932<br />
orders@hach.com<br />
www.hach.com<br />
HACH LANGE GMBH<br />
Willstätterstraße 11<br />
D-40549 Düsseldorf, Germany<br />
Tel. +49 (0) 2 11 52 88-320<br />
Fax +49 (0) 2 11 52 88-210<br />
info@hach-lange.de<br />
www.hach-lange.de<br />
HACH LANGE Sàrl<br />
6, route de Compois<br />
1222 Vésenaz<br />
SWITZERLAND<br />
Tel. +41 22 594 6400<br />
Fax +41 22 594 6499<br />
© Hach Company/Hach Lange GmbH, 2012.<br />
All rights reserved. Printed in Germany.