Flo-Ware Manual - Hachflow
Flo-Ware Manual - Hachflow
Flo-Ware Manual - Hachflow

Create successful ePaper yourself
Turn your PDF publications into a flip-book with our unique Google optimized e-Paper software.
DOC026.53.80112<br />
<strong>Flo</strong>-<strong>Ware</strong> 4 Software<br />
User <strong>Manual</strong><br />
01/2013, Edition 3
Table of Contents<br />
Section 1 General information.........................................................................................................3<br />
1.1 Use of hazard information............................................................................................................3<br />
1.2 Product overview..........................................................................................................................3<br />
1.3 PC requirements .........................................................................................................................4<br />
Section 2 Installation..........................................................................................................................5<br />
2.1 Install the files..............................................................................................................................5<br />
2.2 Install updates..............................................................................................................................5<br />
Section 3 Operation............................................................................................................................7<br />
3.1 User interface .............................................................................................................................7<br />
3.2 Raw data......................................................................................................................................7<br />
3.2.1 Edit data .............................................................................................................................8<br />
3.2.2 Export data..........................................................................................................................8<br />
3.2.3 Open data or project files....................................................................................................9<br />
3.2.3.1 Change file properties..............................................................................................11<br />
3.2.3.2 Make a new data file................................................................................................11<br />
3.2.3.3 Delete files................................................................................................................11<br />
3.2.3.4 Copy files to a new location......................................................................................12<br />
3.3 Themes......................................................................................................................................12<br />
3.3.1 Set up themes...................................................................................................................12<br />
3.3.2 Edit site information...........................................................................................................12<br />
3.3.3 Delete a theme..................................................................................................................13<br />
3.3.4 Make a custom theme.......................................................................................................13<br />
3.4 Charts.........................................................................................................................................13<br />
3.4.1 About charts......................................................................................................................13<br />
3.4.2 Set up charts.....................................................................................................................14<br />
3.4.2.1 Change the data range.............................................................................................14<br />
3.4.2.2 Make a template for charts.......................................................................................15<br />
3.4.2.3 Use a chart template................................................................................................15<br />
3.4.3 Print a chart.......................................................................................................................16<br />
3.5 Reports.......................................................................................................................................16<br />
3.5.1 Make a report....................................................................................................................16<br />
3.5.2 Print a report......................................................................................................................16<br />
3.6 Data reconstruction....................................................................................................................16<br />
3.6.1 About data reconstruction.................................................................................................17<br />
3.6.2 Use a reconstruction table.................................................................................................17<br />
3.6.3 Use the scatter plot...........................................................................................................18<br />
Section 4 Device communication ................................................................................................21<br />
4.1 FL900 series logger .................................................................................................................21<br />
4.1.1 Initial setup........................................................................................................................21<br />
4.1.1.1 Install the <strong>Flo</strong>-<strong>Ware</strong> FL900 Driver............................................................................21<br />
4.1.1.2 Attach the logger to the computer............................................................................21<br />
4.1.1.3 Attach a sensor or external devices to the logger....................................................22<br />
4.1.2 User interface and navigation............................................................................................23<br />
4.1.2.1 Driver window description........................................................................................23<br />
4.1.2.2 Connection status.....................................................................................................24<br />
4.1.2.3 Toolbar.....................................................................................................................24<br />
4.1.2.4 Menu tabs.................................................................................................................25<br />
4.1.3 Connect to the logger........................................................................................................25<br />
4.1.4 Make a logger program.....................................................................................................26<br />
4.1.4.1 Site information........................................................................................................27<br />
4.1.4.2 Communications settings—local..............................................................................27<br />
1
Table of Contents<br />
4.1.4.3 Communications settings—remote..........................................................................28<br />
4.1.4.4 Datalog setup...........................................................................................................29<br />
4.1.4.5 <strong>Flo</strong>-Dar setup—Cal Wizard......................................................................................30<br />
4.1.4.6 <strong>Flo</strong>-Dar setup—manual............................................................................................31<br />
4.1.4.7 <strong>Flo</strong>-Tote setup—Cal Wizard.....................................................................................36<br />
4.1.4.8 <strong>Flo</strong>-Tote setup—manual...........................................................................................36<br />
4.1.4.9 Ultrasonic setup—Cal Wizard..................................................................................37<br />
4.1.4.10 Ultrasonic setup—manual......................................................................................39<br />
4.1.4.11 Ultrasonic sensor—application settings.................................................................40<br />
4.1.4.12 AV9000 Analyzer Module setup—Cal Wizard.......................................................41<br />
4.1.4.13 AV9000 Analyzer Module setup—manual.............................................................42<br />
4.1.4.14 IM9001 module setup.............................................................................................44<br />
4.1.4.15 Set up alarms.........................................................................................................45<br />
4.1.4.16 Set sampler options................................................................................................46<br />
4.1.5 View data...........................................................................................................................47<br />
4.1.5.1 Download data.........................................................................................................47<br />
4.1.5.2 Open a site file.........................................................................................................47<br />
4.1.5.3 Tabular view ...........................................................................................................47<br />
4.1.5.4 Graph view .............................................................................................................48<br />
4.1.5.5 Sample log .............................................................................................................49<br />
4.1.6 Troubleshooting.................................................................................................................50<br />
4.1.6.1 View diagnostic information......................................................................................50<br />
4.1.6.2 <strong>Manual</strong> USB driver installation.................................................................................50<br />
4.1.6.3 Restore factory settings............................................................................................50<br />
4.1.7 Update the firmware..........................................................................................................51<br />
4.1.A Modbus communication....................................................................................................51<br />
4.1.A.1 Overview..................................................................................................................51<br />
4.1.A.2 Communications setup............................................................................................51<br />
4.1.A.3 Communication with the logger................................................................................52<br />
4.1.A.4 Modbus registers.....................................................................................................52<br />
2
Section 1<br />
General information<br />
1.1 Use of hazard information<br />
1.2 Product overview<br />
D A N G E R<br />
Indicates a potentially or imminently hazardous situation which, if not avoided, will result in death<br />
or serious injury.<br />
W A R N I N G<br />
Indicates a potentially or imminently hazardous situation which, if not avoided, could result in<br />
death or serious injury.<br />
C A U T I O N<br />
Indicates a potentially hazardous situation that may result in minor or moderate injury.<br />
N O T I C E<br />
Indicates a situation which, if not avoided, may cause damage to the instrument. Information that<br />
requires special emphasis.<br />
<strong>Flo</strong>-<strong>Ware</strong> is a software system for communication with supported instruments. The<br />
system uses a modular format, where "plug-in" file drivers are installed for each<br />
instrument type that is used.<br />
Additionally, data can be processed from supported instruments at the same time. For<br />
example, data can be plotted from the <strong>Flo</strong>-Tote system and from the <strong>Flo</strong>-Dar system in<br />
the same chart or text report.<br />
<strong>Flo</strong>-<strong>Ware</strong> options:<br />
• Data charts<br />
• Data reports<br />
• Data reconstruction and edit functions<br />
• International language support<br />
• Custom formats for data reports<br />
File Driver options:<br />
• International language support<br />
• Communications with devices directly or via modem<br />
• Original file-type reading<br />
• Data calculations<br />
• Other instrument services<br />
Compatible programs:<br />
• Report Designer—the Report Designer is used to change the design of text reports.<br />
The reports can be saved as templates for easy reuse.<br />
• Instrument-specific drivers—these "plug-ins" are designed for each instrument type<br />
that operates with <strong>Flo</strong>-<strong>Ware</strong>. After the driver is installed, <strong>Flo</strong>-<strong>Ware</strong> will automatically<br />
communicate with and record data from the associated instrument.<br />
Table 1 Instrument-specific drivers<br />
Driver<br />
FL900 Series<br />
<strong>Flo</strong>-Dar<br />
Instrument<br />
FL900 Series Logger and attached sensors or modules<br />
Marsh McBirney Logger and <strong>Flo</strong>-Station with a <strong>Flo</strong>-Dar Sensor<br />
3
General information<br />
Table 1 Instrument-specific drivers (continued)<br />
Driver<br />
<strong>Flo</strong>-Tote 3<br />
<strong>Flo</strong>-Tote<br />
Sigma<br />
Instrument<br />
Marsh McBirney Logger and <strong>Flo</strong>-Station wtih a <strong>Flo</strong>-Tote 3 Sensor<br />
Marsh McBirney Logger and <strong>Flo</strong>-Station wtih a <strong>Flo</strong>-Tote Sensor<br />
Sigma 910/911 Logger with a Submerged Area/Velocity Sensor<br />
1.3 PC requirements<br />
The computer must have the following minimum requirements:<br />
• Windows ® 2000 or XP operating system<br />
• Pentium class processor or equivalent, 90 MHz<br />
• 16 MB RAM<br />
• Video adapter card for 1024 x 768, 96 dpi resolution, 16-bit color<br />
4
Section 2<br />
Installation<br />
2.1 Install the files<br />
2.2 Install updates<br />
Two installations are necessary:<br />
• <strong>Flo</strong>-<strong>Ware</strong>—contains the main application, the Language Editor and the Report<br />
Designer.<br />
• File Drivers—must be installed for communication with devices.<br />
1. Find the link for the <strong>Flo</strong>-<strong>Ware</strong> 4 installation from the website or from the CD:<br />
• Go to http://www.hachflow.com/p_soft_floware_down.html.<br />
• Put the CD in the computer. If the main window does not open automatically, find<br />
and open the startcd.exe file on the CD.<br />
2. Follow the on-screen instructions to install the software. When the installation is<br />
complete, a <strong>Flo</strong>-<strong>Ware</strong> shortcut icon is shown on the desktop.<br />
3. Find and install the <strong>Flo</strong>-<strong>Ware</strong> Help File. Follow the on-screen instructions to install the<br />
file.<br />
4. Find and install the File Driver for each instrument that is used. Follow the on-screen<br />
instructions to install the file.<br />
5. Install any associated files that are shown for the instrument, such as a USB driver. If<br />
the USB driver install wizard does not appear, go to C:\Program Files\<strong>Flo</strong>-<strong>Ware</strong><br />
\FL9xx\USB Driver.<br />
The application and drivers are updated regularly for continued improvement. Install the<br />
updated files for best results.<br />
1. Make sure that the computer is connected to the internet.<br />
2. Open <strong>Flo</strong>-<strong>Ware</strong> and click on the HELP button. The Help, About window opens.<br />
3. Find the version of the application and drivers that are in use.<br />
4. Click on the CHECK FOR UPDATES button. An internet browser opens and the<br />
download center is shown.<br />
5. Compare the version number of the installation files on the download page to the<br />
version of the application and drivers that are in use.<br />
6. If a newer file is available, close the application and install the updated files.<br />
5
Installation<br />
6
Section 3<br />
Operation<br />
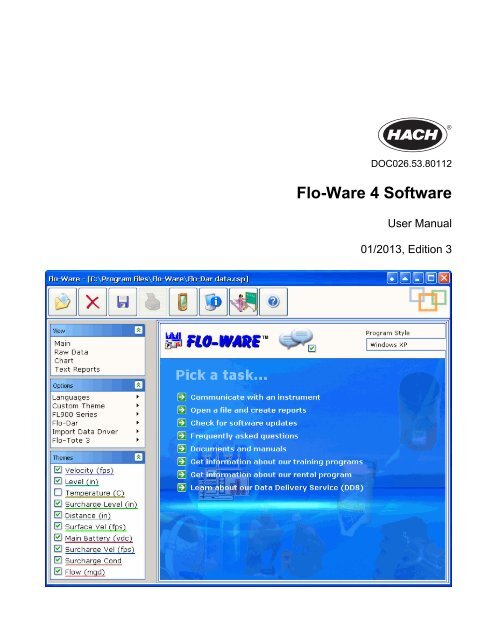
3.1 User interface<br />
Figure 1 Main window<br />
Main window<br />
Double-click the FLO-WARE icon on the desktop to open the main window (Figure 1).<br />
1 Themes panel—measurement channels 5 Balloon help—descriptions of icons and links<br />
2 Options panel—language options and device drivers 6 Program style—color and style options for <strong>Flo</strong>-<strong>Ware</strong><br />
3 View panel—main view and data views 7 Main view—changes with the selected menu<br />
4 Main toolbar—icons shown in all windows 8 Main-view tasks—links for basic tasks and information<br />
3.2 Raw data<br />
The Raw Data view shows the data or project file in a spreadsheet. The columns<br />
correspond to the themes that are shown in the Themes panel. The maximum number of<br />
records is limited only by the computer memory.<br />
Navigation in the Raw Data view is similar to navigation in common spreadsheet<br />
software. Use the arrow keys on the computer keyboard to move up, down, left or right.<br />
Use hot keys such as Ctrl + End to move the cursor to the last cell in the spreadsheet.<br />
Use Ctrl + Home to move the cursor to the first cell in the spreadsheet.<br />
7
Operation<br />
3.2.1 Edit data<br />
Data can be adjusted in the raw data view to change incorrect values. For example, if a<br />
value for the level measurement indicates 0 volume, the corresponding velocity value<br />
should also be 0. If the velocity value is not 0, a velocity value of 0 can be entered.<br />
1. Click to select a data cell in the raw data view.<br />
2. Use a method to change the values:<br />
Option<br />
<strong>Manual</strong><br />
Description<br />
Use the computer keyboard to change the value. Any calculated values, such<br />
as flow, are automatically recalculated. For example, if the velocity value is<br />
doubled, the flow is automatically recalculated.<br />
Find/Replace Use the FIND/REPLACE button to search for data and replace the value.<br />
Calculator<br />
Select one or more data cells and and select add, subtract, multiply or divide<br />
from the Operator field on the toolbar. Enter a value and click the<br />
RECALCULATE SPREADSHEET button.<br />
Note: To highlight multiple cells, click in a data cell and drag down.<br />
Alternatively, click in a data cell, press the shift key and click in another cell.<br />
3.2.2 Export data<br />
Data can be saved in a .txt or .csv file format for use in common applications such as<br />
Microsoft ® Excel ® spreadsheet software.<br />
1. Open a data or project file in the Raw Data view.<br />
2. Click the EXPORT button from the toolbar of the Raw Data view. The Export window<br />
opens.<br />
8
Operation<br />
3. To change the date and time range, click on the start time or end time that is shown.<br />
The Date/Time window opens. Select a new date and time range and click OK.<br />
4. Select a Data Interval. The intervals in the exported data file can be different from the<br />
intervals in the raw data file. For example, the raw data file can have 15 minute<br />
intervals and the exported data can have hourly or daily intervals.<br />
5. Click EXPORT. The Save Export File As window opens.<br />
6. Enter a file name and location.<br />
7. Select either the tabbed text (.txt) or comma separated values (.csv) file format and<br />
click SAVE.<br />
3.2.3 Open data or project files<br />
A data file is created whenever data is transferred from an instrument to the computer.<br />
Open these files to view and analyze the data. When data files are opened in <strong>Flo</strong>-<strong>Ware</strong>, a<br />
project file is automatically created.<br />
The project file contains the charts, text reports, themes and analysis for the data. Save<br />
the project to retain the changes that were made. When the project file is opened at a<br />
later date, the project opens up at the point where it was last saved.<br />
1. Click on the FILE OPEN button on the main toolbar. The Open File window opens<br />
(Figure 2).<br />
2. In the Type section, select a file type:<br />
• <strong>Flo</strong>-<strong>Ware</strong> Project Files—previously-opened files that were saved as a project.<br />
• Instrument Files—available for an instrument if the file driver for that instrument<br />
was installed.<br />
3. In the Look In section, click BROWSE to select the folder where the data files are<br />
located. Once a path is selected, it will be available from the drop-down list.<br />
4. In the File Name section, click to highlight the data file to open. To highlight more<br />
than one file, press and hold the shift key and then click additional files.<br />
5. If a project is currently open, the Import Options section is shown. Select whether to<br />
start a new project or import the data into the current project.<br />
9
Operation<br />
Figure 2 Open file window<br />
1 Options for highlighted files 4 File type (dependent on installed file drivers)<br />
2 Data or project files 5 Options for multiple files<br />
3 Path to file location on PC or network 6 Options for checked files<br />
6. Click OK. The Data Interval window opens.<br />
7. Select the time span and data interval.<br />
Option<br />
Start Time<br />
End Time<br />
Description<br />
The start time of the data file is shown initially. A different date and time can<br />
be selected.<br />
The end time of the data file is shown initially. A different date and time can be<br />
selected.<br />
Data Interval The data interval that is set for the instrument is shown initially. A different<br />
interval can be selected and the data will be averaged.<br />
Note: Some intervals are not compatible with the intervals set for the<br />
instrument. For example, if the instrument is set to record in 3- or 15-minute<br />
intervals, the 1- and 5-minute intervals in <strong>Flo</strong>-<strong>Ware</strong> are not available.<br />
10
Operation<br />
8. Click OK. The file, if a single file and a new project, opens in the Raw data view.<br />
9. If the file is imported into the current project, or if multiple files are opened, the Theme<br />
Data window opens. Select Import (side by side) or Append (string the data together)<br />
and click OK.<br />
Option<br />
Import Data<br />
Description<br />
A side-by-side presentation is useful when the data from many different sites<br />
is plotted in one project. This presentation is useful, for example, when<br />
comparing upstream and downstream sites within the same project.<br />
Append Data Data files from the same site can be appended to create long continuous<br />
projects that are several months or several years long. Make sure to append<br />
data only from the same site.<br />
The data file will open in the Raw data view. <strong>Flo</strong>-<strong>Ware</strong> copies the selected data file(s)<br />
and imports it into the project, leaving the original raw data file unchanged and intact<br />
for archival purposes.<br />
3.2.3.1 Change file properties<br />
In the Open File window, the properties of a data file can be changed. For example, if the<br />
wrong year was assigned to a connected flow meter during installation, the start date for<br />
the file can be changed. Each supported instrument has a unique set of file properties.<br />
Note: The file properties cannot be changed for project files.<br />
1. Click the FILE OPEN button and select the file type and path in the Open File<br />
window.<br />
2. Highlight the file name and click Properties. The File Properties window opens.<br />
3. For FL900 Series files, select a port/sensor.<br />
4. Click in one of the fields, edit the information and click OK.<br />
3.2.3.2 Make a new data file<br />
The user can make a new data file from one or more highlighted data files. This can be<br />
useful when several data files exist for one month of data, for example. The first data file<br />
may not start exactly on the first day of the month at 0:00 hours, and the last file may not<br />
end exactly on the last day of the month at 24:00 hours. These data files can be<br />
combined into one data file that is exactly one month long.<br />
Note: Some instruments that are supported by <strong>Flo</strong>-<strong>Ware</strong> allow the user to select the exact span of<br />
data. In this case, a data file can be created with the exact span that is needed.<br />
1. Click the FILE OPEN button and select the file type and path in the Open File<br />
window.<br />
2. Highlight one or more file names and click Create data file. The Select Data Span<br />
window opens.<br />
Note: To open multiple files, highlight the first file, then hold down the Ctrl or Shift key and<br />
highlight additional files.<br />
3. Select or enter the start date and time, the end date and time and click OK. The Save<br />
File window opens.<br />
4. Enter a name for the file and click Save.<br />
3.2.3.3 Delete files<br />
Data and project files can be deleted if necessary.<br />
1. Click the FILE OPEN button and select the file type and path in the Open File<br />
window.<br />
2. Highlight the file name to delete and click Delete. A confirmation window opens.<br />
3. Click YES to delete the file.<br />
11
Operation<br />
3.2.3.4 Copy files to a new location<br />
A data or project file can be copied and pasted to a different location on the computer or<br />
network.<br />
3.3 Themes<br />
1. Click the FILE OPEN button and select the file type and path in the Open File<br />
window.<br />
2. Click the check box next to one or more file names.<br />
3. Click Copy Checked files to. Select the new location on the computer or network<br />
and click OK. The files are copied and pasted to the new location.<br />
Themes are shown as data columns in the Raw Data view. Each theme name is also<br />
shown in the Themes panel (refer to Figure 1 on page 7).<br />
The available themes correspond to the channels that were selected for logging during<br />
the site setup of the associated instrument. For example, the level and velocity themes<br />
are shown when a <strong>Flo</strong>-Tote 3 sensor is set up with level and velocity logging. A flow<br />
theme is also calculated and added.<br />
The check boxes in the themes panel allow the user to show or remove a theme in charts<br />
and text reports. Themes are always shown in the raw data view. To change the order of<br />
a theme, click and drag the theme up or down in the Themes panel.<br />
3.3.1 Set up themes<br />
Themes can be shown in a chart with different colors and attributes such as line width or<br />
style. For example, the velocity theme can have one color and the level theme can have a<br />
different color.<br />
1. Right-click a theme name from the Themes panel and select Theme Setup. The<br />
Properties window for the theme opens.<br />
2. Change the attributes that are shown on each of the tabs and click OK.<br />
Option<br />
General<br />
Marks<br />
Line, Bar or<br />
Area<br />
Description<br />
Changes the basic attributes of a theme such as the name and units. The<br />
available attributes change with the type of chart that is selected in the View<br />
panel.<br />
Changes the appearance of the marks or labels on a chart that shows<br />
individual data points. The changes affect only the theme that is selected on<br />
the General tab.<br />
Changes the appearance of the theme in a line, bar or area, pie or scatter<br />
chart. The available attributes change with the theme that is selected on the<br />
General tab.<br />
3.3.2 Edit site information<br />
The user can view and edit information about the site that is associated with the data file.<br />
Each supported instrument has a unique set of site information attributes.<br />
Edit the attributes when information was entered incorrectly during setup. For example, if<br />
an incorrect pipe diameter were entered, the flow data in the site file will be incorrect. The<br />
pipe diameter can be changed in the Site Information window. The flow data is then<br />
calculated correctly in the site file.<br />
1. Open the site file.<br />
2. Right-click the theme name from the Themes panel.<br />
3. Select Site Information. The Site Information window opens.<br />
4. Edit the site information and click OK.<br />
12
Operation<br />
Note: Refer to the help system for the associated instrument for more details about Site<br />
Information.<br />
3.3.3 Delete a theme<br />
A theme can be removed from a project at any time.<br />
1. Right-click the theme name to be removed from the Themes panel.<br />
2. Select Delete Theme. A confirmation window opens.<br />
3. Click YES to delete the theme.<br />
3.3.4 Make a custom theme<br />
A Custom Theme adds a new column in the raw data view for user data such as<br />
infiltration/inflow, temperature, pH or maximum allowable flow.<br />
3.4 Charts<br />
1. Click Custom Theme in the Options view and select New. The Data Interval window<br />
opens.<br />
2. Enter the start time and end time. If the project is new, select the data interval.<br />
Note: If in an existing project, the interval that was set when the first file was added to the<br />
project is used for the data interval.<br />
3. Click OK. The Custom Unit Editor window opens.<br />
4. Define the units of measure for the chart and report labels:<br />
• Standard unit of measurement—enter the units and abbreviation.<br />
• Unit of measurement for totals—enter the units and abbreviation to use for totals.<br />
If the standard unit involves a rate, select the rate of measurement.<br />
5. Click OK. The Custom Properties window opens.<br />
6. Enter a name for the custom theme.<br />
7. Make selections on the General, Marks and Attributes tabs to define all of the<br />
attributes for the new custom theme. Click OK.<br />
8. To add data, select the Raw Data view. Type the data in the new column or paste<br />
data from a program such as Microsoft Excel spreadsheet software.<br />
All charts and text reports will reflect the selections that were made for the custom<br />
theme.<br />
To view data in a chart, open a data file and click Chart in the View panel.<br />
3.4.1 About charts<br />
Charts allow the user to see the data in a graphical format. Charts can show trends,<br />
anomalies, maximums, minimums and totals. Data can be shown in 4 different types of<br />
charts:<br />
• Combination—shows data as a line, a bar or an area. One theme can be shown as<br />
a data line, for example, and another theme can be shown as a bar<br />
• Bar—shows data as vertical bars. The summary type for the theme must be set to<br />
show total values. The total values are calculated based on the data interval. Each<br />
theme is shown as a portion of each bar.<br />
• Pie—shows data as a area. The summary type for the theme must be set to show<br />
total values. The total values are calculated based on the data interval. Each theme is<br />
shown as a section of the pie. The pie chart should only be used with the same type<br />
of data, for example flow data.<br />
• Scatter plot—shows data as (x, y) data pairs for two different themes. The first two<br />
checked themes are shown on the chart. The first checked theme is shown on the x-<br />
axis and the second checked theme is shown on the y-axis. To show the data for<br />
13
Operation<br />
different themes, select or deselect the check box next to the theme name or change<br />
the order of the themes.<br />
Use the buttons on the chart toolbar to navigate in the chart. To move the chart to the<br />
right or to the left, click on the PAN button, then right-click on the chart and drag the<br />
mouse to the left or right. The ZOOM IN and ZOOM OUT buttons allow the user to<br />
increase or decrease the amount of data that is shown in the chart view. The chart length<br />
can be increased up to 1 year.<br />
Charts can have multiple pages. The page navigator in the main window shows the total<br />
number of pages and the page number that is currently shown. Click the right or left<br />
arrows to go forward or back, or enter a number in the edit box and press ENTER on the<br />
computer keyboard.<br />
3.4.2 Set up charts<br />
The appearance of charts can be configured for attributes such as background color,<br />
titles, legends and 3-dimensional effects. The changes affect all of the themes in a<br />
project. After a chart is configured, the settings can be saved to a template for use with<br />
other data files.<br />
1. Open a data or project file.<br />
2. Click Chart from the View panel.<br />
3. Select a chart type (Combination, Bar, Pie or Scatter).<br />
4. Click the CHART SETUP button from the Chart toolbar. The Chart Setup window<br />
opens.<br />
5. Change the attributes that are shown on each of the tabs and click OK.<br />
Option<br />
General<br />
Description<br />
Changes the data span per chart page and sets 3D effects.<br />
Background Changes the background color of the chart and adds a background image or<br />
frame.<br />
Legend<br />
Axes<br />
Titles<br />
Walls<br />
Changes the location and style of the legend.<br />
Changes the settings for any axis of the chart. Select one of the axes from the<br />
left panel and then change the attributes for that axis.<br />
Adds up to 9 different titles in a chart. Select one of the options from the left<br />
panel and then change the title attributes for that option.<br />
Change the appearance the 3-dimensional walls that make up a 3D chart. The<br />
3D Charting option must be enabled in the General tab of the Chart Setup<br />
window. Select one of the walls from the left panel and then change the<br />
attributes for that wall.<br />
3.4.2.1 Change the data range<br />
The data span for the chart is shown in the Report Settings panel. The data span, chart<br />
length and data interval can be changed and the updates can then be seen in the chart<br />
view. Changes that are made to the span, chart length and data interval will change the<br />
number of chart pages.<br />
14
Operation<br />
1. Select the check box next to Custom Data Span in the Report Settings panel. The<br />
start and end dates are shown.<br />
2. To change the date and time range, click on the start time or end time. The<br />
Date/Time window opens. Select a new date and time range and click OK.<br />
3. Select a chart length to be shown on each page of the chart.<br />
4. Select the data interval to be shown. The chart view is updated to show the changes.<br />
3.4.2.2 Make a template for charts<br />
The settings that are made in the Chart Setup window can be saved as a template file for<br />
use with other data files.<br />
1. Click on the CHART TEMPLATE button on the Chart toolbar. The Template Set<br />
Options window opens.<br />
2. Select Save Template Set and click Next. The Save Template Set Options window<br />
opens.<br />
3. Select one of the options:<br />
• Save as Default Template—the current chart settings are used automatically<br />
each time a chart is viewed. Click Finish and YES.<br />
• Save Template Set to File—the current chart settings can be saved and loaded<br />
into a project at any time. Click Next. Enter a file name and description for the<br />
new template. Click Finish.<br />
3.4.2.3 Use a chart template<br />
A chart template can be used as the default setup for charts, or it can be imported at any<br />
time.<br />
1. Click on the CHART TEMPLATE button on the Chart toolbar. The Template Set<br />
Options window opens.<br />
2. Select Load Template Set and click Next. The Load Template Set Options window<br />
opens.<br />
3. Select one of the options:<br />
• Load Default Template Set—use the default template to make a new chart. Click<br />
Finish.<br />
• Load Template Set from File—use a previously saved template for the current<br />
project. Click Next. Select a template file from the drop-down box. Click Finish.<br />
15
Operation<br />
3.4.3 Print a chart<br />
A paper copy of a chart can be made from a local or network printer.<br />
3.5 Reports<br />
1. From the View panel, select Chart.<br />
2. Click the PRINT button. The Print window opens.<br />
3. Select the printer, the number of pages to be printed and make any necessary<br />
changes to the properties. Click OK. The chart is sent to the printer.<br />
Reports of raw data can be shown for different time intervals or as a summary of<br />
maximum, minimum, average and total values.<br />
3.5.1 Make a report<br />
Use the Text Report toolbar to make a text report.<br />
1. Open a data or project file.<br />
2. From the View panel, select Text Reports.<br />
3. Select a report type from the Available Reports drop-down list on the Text Report<br />
toolbar. The report is shown in the view window. Use the page navigator on the main<br />
toolbar to view additional pages.<br />
Note: After a report type is selected, it is available in the Installed Reports list.<br />
4. To add or remove a theme (column), go to the Themes panel and select or deselect a<br />
theme.<br />
5. To change the order of themes, go to the Themes panel and click and drag the theme<br />
name up or down.<br />
6. To change the date range:<br />
a. Go to the Report Settings panel.<br />
b. Select the check box next to Custom Data Span. The start and end dates and<br />
times are shown.<br />
c. Click on the start or the end date and time. The Date/Time window opens.<br />
d. Select a new date and time and click OK. The report will update and show the<br />
new date and time.<br />
3.5.2 Print a report<br />
A paper copy of a report can be made from a local or network printer.<br />
1. Open a text report.<br />
3.6 Data reconstruction<br />
2. Click the PRINT button. The Print window opens.<br />
3. Select the printer, the number of pages to be printed and make any necessary<br />
changes to the properties. Click OK. The report is sent to the printer.<br />
The data reconstruction workspace gives the user the flexibility to analyze data and, if<br />
necessary, repair or reconstruct the data. The example in this section describes the<br />
removal of an error in the velocity theme from a flow meter.<br />
16
3.6.1 About data reconstruction<br />
When a set of data suddenly shows a large change from a stable pattern, the data should<br />
be examined to find the cause for the change. As an example, imagine that the flow and<br />
velocity themes suddenly become erratic and go to very low values for approximately<br />
1 day. This change can be due to a true decrease in the flow, or to a condition such as<br />
debris that collected on the sensor.<br />
Upon examination, the level theme shows a stable pattern for this day. If the flow actually<br />
did decrease, the level data is expected to decrease also. The conclusion can then be<br />
made that the velocity data has an error on that day.<br />
This error can be removed with the reconstruct option. The span of inaccurate data can<br />
be replaced with a span of data that is known to be accurate. The result will be more<br />
accurate data, better flow balances and a higher level of statistical confidence.<br />
The line chart or the scatter plot can be used to remove errors from most data files. The<br />
line chart is used to repair sections of data (Use a reconstruction table on page 17). The<br />
scatter plot can be used to reconstruct an entire set of data (Use the scatter plot<br />
on page 18).<br />
3.6.2 Use a reconstruction table<br />
The example that follows shows the removal of an error in the velocity theme based on<br />
the level data. The level data is referred to as the Base Theme. Before reconstruction,<br />
find a span of data that is considered to be accurate and that follows a noticeable pattern.<br />
1. Open the data or project file and select View>Chart. Select the Combination Chart<br />
from the toolbar.<br />
2. Right-click the Velocity theme in the Themes panel and select Reconstruct. The<br />
Reconstruct Velocity window opens.<br />
3. Select the Level theme from the drop-down box as the basis for the reconstruction<br />
and click OK. The Data Reconstruct panel is shown.<br />
4. In the Data Reconstruct panel, select Table > New. The Reconstruction Table<br />
Properties window opens.<br />
Note: To edit a reconstruction table that was previously saved from the same site, select Table<br />
> Open.<br />
5. Update the options as follows:<br />
• Decimal Precision—set the decimal precision for the 2 themes. The higher the<br />
precision for the base theme, the longer it will take to populate the table with<br />
data.<br />
• Base Theme Data Range—select the approximate minimum and maximum<br />
values of good data for the base theme (as seen in the line chart).<br />
• Notes—enter a comment about the site for future use.<br />
6. Click OK. A data reconstruction table is added to the Data Reconstruct panel.<br />
The left column of the table shows the Base Theme. The right column of the table<br />
shows the theme to be reconstructed.<br />
7. In the chart, select a span of data that is known to be accurate. First, left-click the<br />
start of the data, then right-click the end of the data span. The selected data for both<br />
themes will change color. Make sure that the selected span includes only accurate<br />
data.<br />
Note: If the Pan or Zoom buttons are enabled, the data cannot be selected.<br />
8. In the Data Reconstruct panel, select Table > Populate with Data. The velocity data<br />
will be added to the velocity column. Some of the data cells will be empty.<br />
9. Use one of the options that follow to fill in the empty data cells:<br />
• Select additional data spans to populate the table with more data.<br />
• Enter a reasonable value for the velocity using the keyboard.<br />
Operation<br />
17
Operation<br />
• Interpolate over blank cells: click and drag to highlight data from above the first<br />
empty data cell to below the last empty data cell. Select Edit > Interpolate. The<br />
table is updated with the linear interpolated data. The start and end cells are used<br />
as reference points.<br />
• Change to the Scatter Plot view and click in the scatter plot where the data<br />
should likely be (refer to Use the scatter plot on page 18).<br />
10. Select a span of inaccurate data in the chart. First, left-click the start of the data, then<br />
right-click the end of the inaccurate data span. The selected data for both themes will<br />
change color. Make sure that the selected span includes the data to be<br />
reconstructed.<br />
Note: If the Pan or Zoom buttons are enabled, the data cannot be selected.<br />
11. In the Data Reconstruct panel, select Table > Reconstruct. The theme is updated to<br />
show the correction (Figure 3).<br />
12. Select Table > Save to save the table. Enter a file name and location to store the file.<br />
Note: This table can be used for future data reconstruction at the same site.<br />
13. Close the Data Reconstruct panel to exit the reconstruction session.<br />
Figure 3 Data before and after reconstruction<br />
Note: To reverse the reconstruction, select the Raw Data view and click the undo button.<br />
1 Valid data 2 Incorrect data 3 Repaired data<br />
3.6.3 Use the scatter plot<br />
Use the scatter plot when it is necessary to reconstruct the entire set of data. First, select<br />
a span of accurate data with the line chart to populate the reconstruction table. Then<br />
change to the scatter plot view to reconstruct the data.<br />
1. Complete 1 to 9 to in Use a reconstruction table on page 17.<br />
2. Click on the SCATTER PLOT button. The data from the reconstruction table is shown<br />
in the scatter plot in a different color from the rest of the data set (Figure 4).<br />
3. If necessary, edit the data in the reconstruction table. The data points on the scatter<br />
plot are updated to show the new values.<br />
4. In the Data Reconstruct panel, select Table > Reconstruct. The entire set of data is<br />
updated to match the table data (Figure 4).<br />
5. Save the reconstruction file and close the Data Reconstruct panel.<br />
Note: To reverse the reconstruction, select the Raw Data view and click the UNDO button.<br />
18
Operation<br />
Figure 4 Data before and after reconstruction<br />
19
Operation<br />
20
Section 4<br />
Device communication<br />
4.1 FL900 series logger<br />
4.1.1 Initial setup<br />
4.1.1.1 Install the <strong>Flo</strong>-<strong>Ware</strong> FL900 Driver<br />
4.1.1.2 Attach the logger to the computer<br />
C A U T I O N<br />
Refer to the safety information in the user manual for the device before any connections are made<br />
to the device.<br />
When the driver for a device is installed, <strong>Flo</strong>-<strong>Ware</strong> can communicate directly with the<br />
device for various purposes such as data collection and site configuration.<br />
Note: During driver installation this message will appear: "The following device has not passed the<br />
Windows Logo testing to verify its compatibility with Windows. Continuing your installation of this<br />
software may impair the correct operation of your system either immediately or in the future.<br />
Microsoft strongly recommends that you stop this installation now and contact the hardware vendor<br />
for software that has passed Windows Logo testing." Hach engineers have fully tested this product<br />
and determined that it is compatible with Windows. Press the "Continue anyway" button to finish the<br />
installation.<br />
Pre-requisite: Before the FL900 logger is attached to a computer, make sure that <strong>Flo</strong>-<br />
<strong>Ware</strong> is installed on the computer.<br />
The FL900 Series Driver must be installed on the PC to communicate with the logger.<br />
1. Find the link for the FL900 Series Driver on the <strong>Flo</strong>-<strong>Ware</strong> CD or from the website<br />
http://www.hachflow.com/p_soft_floware_down.html<br />
2. Click on the link and run the application. The install wizard starts.<br />
3. Follow the on-screen instructions to install the driver. Use the recommended settings.<br />
Pre-requisite: Make sure that the FL900 driver is installed on the computer.<br />
Connect only one logger to the computer.<br />
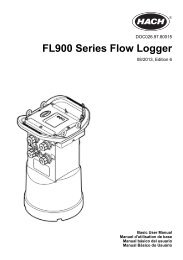
1. Attach the logger to the computer (Figure 5).<br />
2. When a USB cable is attached for the first time, the Found New Hardware wizard<br />
opens. Run the new hardware wizard to install the USB driver for the logger. When<br />
finished, the message “Your new hardware is installed and ready to use” is shown. In<br />
the event the wizard does not run or the install fails, contact Hach <strong>Flo</strong>w Tech Support<br />
to assist with trouble shooting your specific operating system.<br />
21
Device communication<br />
Figure 5 Attach the logger to a computer<br />
4.1.1.3 Attach a sensor or external devices to the logger<br />
Pre-requisite: Make sure that the connection status is offline.<br />
W A R N I N G<br />
Sensor Hazardous Locations and RF Exposure Hazards. Some sensors have RF radiation<br />
exposure hazards and are used in explosive atmospheres. See sensor manual warnings and<br />
instructions before connecting a sensor to the logger.<br />
The number of sensors that can attach to the logger varies with the model of the logger.<br />
Some sensors must attach to an external module that is used as an interface between the<br />
sensor and the logger. Figure 7 shows the AV9000 Area Velocity Analyzer module on the<br />
side of the logger and the connection to a submerged area/velocity sensor.<br />
1. If the sensor cable has connectors on both ends, attach the cable to the sensor first.<br />
2. Attach the sensor (or module) to any SENSOR port on the logger (Figure 6 or<br />
Figure 7). Tighten the connector by hand.<br />
Note: For rain gauges, attach the sensor to the RAIN connector.<br />
3. If the sensor uses an external module, attach the module to the logger, then attach<br />
the sensor to the module (Figure 7).<br />
4. If the sensor cable has a desiccant hub, align the desiccant hub vertically and make<br />
sure that the air port points down (Figure 6).<br />
22
Device communication<br />
Figure 6 Attach a sensor to the logger<br />
Figure 7 Attach a sensor to an external module<br />
4.1.2 User interface and navigation<br />
4.1.2.1 Driver window description<br />
From the Options panel in <strong>Flo</strong>-<strong>Ware</strong>, select FL900 Series>Communications. The<br />
FL900 Series Driver window opens (Figure 8). The FL900 Series Driver window has tabs<br />
and buttons to complete tasks or access menus. The connection status is shown on the<br />
bottom bar (Connection status on page 24).<br />
23
Device communication<br />
Figure 8 FL900 Series Driver window<br />
1 Menu tabs 5 Connection status—online or offline<br />
2 Menu options 6 Read/Write buttons (online only)<br />
3 Toolbar buttons 7 Connection details<br />
4 Main section 8 Load/Save/Clear buttons<br />
4.1.2.2 Connection status<br />
The connection status shows when a communication session is open:<br />
• Online—a communication session with the logger is open. Any attached sensors are<br />
shown in the driver window. The user can download and view data from the logger<br />
and write a program to the logger.<br />
• Offline—the FL900 driver is not connected to the logger. The user can open a site file<br />
or make a logger program for later use.<br />
4.1.2.3 Toolbar<br />
The toolbar buttons are always shown, but some buttons are enabled only when the<br />
connection status is online or offline.<br />
24
Device communication<br />
Table 2 FL900 Series Driver toolbar<br />
Connect—starts a communication session with<br />
the logger.<br />
Download since last—downloads only the data<br />
that was logged since the previous download.<br />
Disconnect—stops the communication session<br />
with the logger.<br />
Open a file—opens a site file or sensor<br />
diagnostics file from the default file path.<br />
Global settings—opens the settings window<br />
where various default settings such as file paths<br />
can be changed.<br />
Help—opens the help window.<br />
Download all data—downloads all data from the logger.<br />
4.1.2.4 Menu tabs<br />
Use the tabs to access the various menu options:<br />
• Programming—sets all of the user-adjustable parameters in the logger.<br />
• Data—allows the user to view data (tabular and graph) and get sample history from a<br />
site file that has been downloaded from the logger.<br />
• Diagnostics—contains the event log, alarm log, current status of the logger and realtime<br />
modem and sensor diagnostics.<br />
• Utilities—contains tools such as firmware updates.<br />
4.1.3 Connect to the logger<br />
When a communications session is started, the connection status changes from offline to<br />
online.<br />
1. In the FL900 Series Driver window, click the CONNECT button. The Communications<br />
window opens.<br />
2. Select the computer port (COM or USB) from the drop-down list. For COM ports,<br />
select the communications protocol for the computer.<br />
Note: When a USB cable is attached to the computer, a virtual serial port (e.g. USB:COM3) is<br />
assigned.<br />
3. Click OK. The driver reads the logger program and looks for sensors that are<br />
specified in the program.<br />
A Sensor Mismatch message is shown for the following situations:<br />
• The current logger program does not include an attached sensor<br />
• The current logger program includes a sensor that is not attached<br />
• The current logger program includes a sensor that is attached to an incorrect port<br />
4. If the Sensor Mismatch message is shown, select one of the options and click OK:<br />
• Use existing logger program—ignore the attached sensors and import the<br />
program from the logger.<br />
• Create new logger program based on detected sensors—include the attached<br />
sensors in a new program. The new program can then be written to the logger.<br />
25
Device communication<br />
4.1.4 Make a logger program<br />
The logger must have a program to specify all of the necessary parameters for data<br />
collection. The program can be made when the logger is online or offline. When made<br />
offline, the program is saved to a file and later written to the logger.<br />
The logger can have only one program. When a new program is written to the logger, the<br />
previous program is erased.<br />
1. From the Options panel in <strong>Flo</strong>-<strong>Ware</strong>, select FL900 Series>Communications to open<br />
the driver window.<br />
2. Start a communication session.<br />
3. Click the Programming tab.<br />
4. Complete each menu option:<br />
Option<br />
Site information on page 27<br />
Communications settings—<br />
remote on page 28<br />
Communications settings—local<br />
on page 27<br />
Datalog setup on page 29<br />
<strong>Flo</strong>-Dar setup—Cal Wizard<br />
on page 30<br />
<strong>Flo</strong>-Dar setup—manual<br />
on page 31<br />
<strong>Flo</strong>-Tote setup—Cal Wizard<br />
on page 36<br />
<strong>Flo</strong>-Tote setup—manual<br />
on page 36<br />
Ultrasonic setup—Cal Wizard<br />
on page 37<br />
Ultrasonic setup—manual<br />
on page 39<br />
Description<br />
Specifies general settings such as the model number,<br />
site ID, time zone, memory mode and GPS coordinates.<br />
Contains the remote communication settings for the<br />
logger.<br />
Contains the local communication settings for the<br />
logger.<br />
Specifies which measurements will be recorded, what<br />
values trigger an alarm and what actions will occur<br />
during an alarm condition.<br />
Sets the sensor units, flow channel geometry and the<br />
sensor calibration with the calibration wizard.<br />
Sets the sensor units, flow channel geometry and the<br />
sensor calibration manually.<br />
Sets the sensor units, flow channel geometry and the<br />
sensor calibration with the calibration wizard.<br />
Sets the sensor units, flow channel geometry and the<br />
sensor calibration manually.<br />
Sets the sensor units, flow channel geometry and the<br />
sensor calibration with the calibration wizard.<br />
Sets the sensor units, flow channel geometry and the<br />
sensor calibration with the calibration manually.<br />
26
Device communication<br />
Option<br />
AV9000 Analyzer Module setup—<br />
Cal Wizard on page 41<br />
AV9000 Analyzer Module setup—<br />
manual on page 42<br />
IM9001 module setup<br />
on page 44<br />
Set up alarms on page 45<br />
Set sampler options on page 46<br />
Description<br />
Sets the sensor units, flow channel geometry and the<br />
sensor calibration with the calibration wizard.<br />
Sets the sensor units, flow channel geometry and the<br />
sensor calibration manually.<br />
Contains the communication settings for a Sigma <strong>Flo</strong>w<br />
Meter.<br />
Sets the system alarms and specifies the address or<br />
number for email or text message notification.<br />
Specifies the time interval that triggers the sampler to<br />
collect samples.<br />
4.1.4.1 Site information<br />
The site information menu contains the identification information for the site.<br />
1. Click the Programming tab.<br />
2. Complete the information in the Site Information menu:<br />
Option<br />
Model Number<br />
Description<br />
If online, the model number is selected automatically. If offline, select the<br />
model number of the logger that will be programmed.<br />
Site Identification Enter a unique name for the site (mandatory, maximum 16 characters).<br />
When telemetry is used for remote monitoring, a site repository is made<br />
on the server with this name.<br />
Site Location<br />
Time Zone<br />
Memory Mode<br />
Site Notes<br />
GPS Coordinates<br />
The optional location description (maximum 30 characters).<br />
Select the correct time zone for the site. When telemetry is used, the<br />
server uses this time zone to synchronize the clock.<br />
The memory mode specifies how the datalog operates when the memory<br />
becomes full. Wrap (default): the oldest data points are deleted as new<br />
data is added. Slate: data collection stops.<br />
Click the note icon to enter optional comments. Click the save icon to<br />
save the comments. The note file is saved as a .sn file in the default file<br />
path location.<br />
Enter the GPS coordinates for the site (optional). Use Datum WGS84 as<br />
the reference location and the format that is shown for Latitude and<br />
Longitude. When telemetry is used, these coordinates are shown on the<br />
map in FSDATA.<br />
4.1.4.2 Communications settings—local<br />
Local settings apply when the logger is connected to a computer with a communications<br />
cable. These settings are stored in the logger. When a communication session is started,<br />
the settings in the computer must be the same as the settings in the logger. The default<br />
local settings are sufficient for most applications. Change the settings only for specific<br />
communication requirements such as connection to a third-party device.<br />
1. Click the Programming tab.<br />
2. Click on the Communications menu.<br />
3. Change any of the options:<br />
Option<br />
Description<br />
Modbus Address The address that is used for network communication with the logger<br />
(default address: 2).<br />
27
Device communication<br />
Option<br />
Baud Rate<br />
Parity<br />
Protocol<br />
Description<br />
The baud rate assigned to the logger.<br />
Even, odd or none.<br />
Modbus RTU (default) or Modbus ASCII.<br />
4.1.4.3 Communications settings—remote<br />
A modem can be used to transmit data to a server or to send email or text messages<br />
from the logger. The modem can be for wireless or landline (dialup) communication.<br />
When a GPRS wireless modem is used, the user must first install the SIM card from the<br />
mobile provider (refer to the documentation for the logger).<br />
For connection to the internet, the user must first configure the server for the instrument<br />
and get the Security Verification Code (SVC). Refer to the user manual for the<br />
FL900 logger for more information.<br />
1. Click the Programming tab.<br />
2. Click on the Communications menu. If online, most of the settings are completed<br />
automatically.<br />
3. Change any of the options for the modem:<br />
Option<br />
Enable Modem<br />
Modem Type<br />
Description<br />
Makes the modem active. If the modem is not used, deselect this<br />
option to save battery power.<br />
Selects the type of modem (refer to the label on the logger).<br />
Options: GPRS, Verizon, Sprint, Dialup.<br />
Modem Frequency GPRS only—sets the modem frequency to be used. Options: 850,<br />
900E, 1800, 1900, 850/1900 (North America), 900E/1800 (EU),<br />
900E/1900 MHz.<br />
Network Provider<br />
Access Point Name<br />
Username<br />
Password<br />
Programming Code<br />
Mobile Station ID<br />
Mobile Data Number<br />
Primary dial number<br />
Wireless only—selects the mobile provider. Options: EU Mobistar<br />
1, EU Mobistar 2, US AT&T, US TMobile.<br />
GPRS only—the access point name is entered automatically when<br />
the network provider is selected.<br />
If the network provider supplied a user name and password, enter<br />
the information.<br />
If the network provider supplied a user name and password, enter<br />
the information.<br />
Verizon or Sprint only—this information is supplied by the network<br />
provider.<br />
Verizon or Sprint only—this information is supplied by the network<br />
provider.<br />
Verizon or Sprint only—this information is supplied by the network<br />
provider.<br />
Dialup only—this information is supplied by the internet service<br />
provider.<br />
Secondary dial<br />
number<br />
4. Change any of the options for the server:<br />
Dialup only—this information is supplied by the internet service<br />
provider.<br />
Option<br />
Server IP Address<br />
Port Number<br />
Description<br />
Internet server address, supplied by the manufacturer.<br />
Internet connection information, supplied by the manufacturer.<br />
28
Device communication<br />
Option<br />
Primary Call Interval<br />
Secondary Call Interval<br />
SMS to E-mail Gateway<br />
SMS Service Center<br />
Server Verification<br />
Code<br />
Description<br />
The frequency that the logger calls the server, not to exceed the<br />
logging interval. Options: 5, 6, 10, 12, 15, 30, 60 minutes; 2, 3, 4,<br />
6, 12, 24 hours.<br />
The frequency that the logger calls the server during an alarm<br />
condition. Options: 5, 6, 10, 12, 15, 30, 60 minutes; 2, 3, 4, 6, 12,<br />
24 hours.<br />
GPRS only—completed automatically when the provider is<br />
selected.<br />
GPRS only—completed automatically after the provider is<br />
selected.<br />
The customer-specific ID that connects an instrument to the<br />
customer account during telemetry.<br />
4.1.4.4 Datalog setup<br />
Use the datalog setup menu to specify which channels will be recorded in the datalog. A<br />
channel can be a reading from an attached sensor, the battery voltage from the logger or<br />
a statistical value based on a sensor reading. A channel must be selected before any<br />
data can be saved. A maximum of 16 channels can be selected.<br />
Note: If channels are added to or removed from an existing program, all data in the logger will be<br />
erased. Be sure to download the data from the logger to a safe location before the modified<br />
program is written to the logger.<br />
1. Click on the Programming tab in the FL900 Series Driver window. If online, the<br />
attached sensors and ports are shown.<br />
2. If offline, click on the Datalog Setup menu. Select the sensor(s) from the drop-down<br />
list in the Port Assignments section that agree with the sensor and port configurations<br />
on the logger.<br />
3. Click on the Datalog Setup menu.<br />
4. Select the channels to be logged in the Select Datalog Channels section:<br />
a. Expand the tree for the Logger channel group. The Power Supply channel is<br />
always shown in this group. Logging the power supply value is useful in order to<br />
know when the batteries should be replaced. A low value alarm can be set to<br />
send an email or SMS when a specified voltage value is reached. If the logger<br />
contains a port for a rain gauge, the Rain channel is also shown. To include a<br />
Logger channel in the datalog, select the check box next to the channel name.<br />
b. Expand the tree for each Port[1 ](Sensor Name) channel group to view the<br />
available channels for the sensor.<br />
c. To include a Sensor channel in the datalog, select the check box next to the<br />
channel name. The log channel count increases each time a channel is selected.<br />
Note: For loggers with multiple sensor ports, the port number is added to the channel<br />
name. For example, Velocity 3 is the velocity channel name for sensor port 3.<br />
5. To set the logging interval for a channel group:<br />
29
Device communication<br />
a. Click on the channel group name, for example Port1 (<strong>Flo</strong>-Dar). The logging<br />
intervals are shown.<br />
b. Select the interval from the drop-down list. The primary logging interval is used<br />
for normal operation. The secondary logging interval is used during alarm<br />
conditions.<br />
Note: The logging interval cannot be set for an individual sensor channel.<br />
6. To change the units for a channel, click on the channel name. The units are shown.<br />
Select the units from the drop-down list.<br />
4.1.4.5 <strong>Flo</strong>-Dar setup—Cal Wizard<br />
The sensor can be configured and calibrated with the calibration wizard. The sensor must<br />
be installed in the process and the connection status must be online for calibration.<br />
1. Click on the Programming tab in the FL900 Series Driver window. If online, the<br />
attached sensors and ports are shown.<br />
2. Click on Sensor Port[1] (sensor name).<br />
3. Select the units in the Unit Preferences section. These units can be different from the<br />
logged units that are specified in the Datalog Setup menu.<br />
4. Click on the CAL WIZARD button. The Calibration Wizard window opens.<br />
5. Select the options on each screen and click NEXT:<br />
Option<br />
Number of<br />
samples<br />
<strong>Flo</strong>w parameters<br />
Ultrasonic<br />
transducer<br />
Surcharge velocity<br />
Sensor height<br />
Calibration screen<br />
Actual level<br />
Actual velocity<br />
Description<br />
The number of times the sensor is sampled for the calibration<br />
measurements (1, 2 or 3).<br />
The shape and dimensions of the flow channel (circular, rectangular,<br />
trapezoidal or U-shaped).<br />
The level (depth) sensor that is used during non-surcharge conditions<br />
(standard or extended range).<br />
The SVS sensor for velocity measurements during surcharge<br />
conditions (yes, no. If yes, select the sensor port where the SVS is<br />
attached).<br />
The distance from the bottom of the flow channel to the top of the<br />
sensor frame (direct—measured by user or indirect—measured by<br />
sensor. If indirect, the user must enter the liquid level after the<br />
measurement has been sampled from the sensor).<br />
The calibration measurements are taken.<br />
The liquid level (depth) measured by the user in the flow channel.<br />
The user can measure the velocity with a different instrument and enter<br />
the value (optional).<br />
6. When the Calibration Complete screen is shown, click FINISH. The Calibration<br />
Wizard window closes.<br />
30
Device communication<br />
Note: The Calibration Complete screen shows the values that were entered by the user and<br />
the values that were measured by the sensor. If the values are different, the calibration<br />
adjustment value or multiplier is shown.<br />
7. Click WRITE TO LOGGER to save the settings. A message window is shown:<br />
Option<br />
Warning: all data<br />
will be lost.<br />
Continue?<br />
Description<br />
All data that is stored in the logger is erased when a program is written to<br />
the logger. To save the data, select No and download the data to a safe<br />
location. Select Yes to erase all data and update the logger with the new<br />
program.<br />
Set Logger Clock Synchronize to Computer Clock—the logger uses the date and time<br />
settings of the computer. Set Logger Clock—the logger uses the date<br />
and time settings that are set by the user. If the unit has a modem, the<br />
logger automatically uses the date and time settings of the server.<br />
4.1.4.6 <strong>Flo</strong>-Dar setup—manual<br />
The Calibration Wizard is the easiest method to set up the sensor. Use the manual setup<br />
for odd-shaped flow channels or to adjust some of the calibration parameters. The sensor<br />
must be installed in the process and the connection status must be online for calibration.<br />
Be sure to complete the level calibration before the velocity calibration.<br />
1. Click on the Programming tab in the FL900 Series Driver window. If online, the<br />
attached sensors and ports are shown.<br />
2. Click on Sensor Port[1] (sensor name).<br />
3. Select the units in the Unit Preferences section. These units can be different from the<br />
logged units that are specified in the Datalog Setup menu.<br />
4. Click on the <strong>Flo</strong>w Settings tab and select the shape of the flow channel.<br />
5. Enter the dimensions of the flow channel. Be sure to enter the correct depth for noncircular<br />
channels.<br />
6. If the flow channel is odd-shaped, a table is shown. A cross-section of the shape can<br />
be divided into parts and the area of the parts can be entered into the table.<br />
7. Click WRITE TO LOGGER to save the settings. A message window is shown:<br />
Option<br />
Warning: all data<br />
will be lost.<br />
Continue?<br />
Description<br />
All data that is stored in the logger is erased when a program is written to<br />
the logger. To save the data, select No and download the data to a safe<br />
location. Select Yes to erase all data and update the logger with the new<br />
program.<br />
Set Logger Clock Synchronize to Computer Clock—the logger uses the date and time<br />
settings of the computer. Set Logger Clock—the logger uses the date<br />
and time settings that are set by the user. If the unit has a modem, the<br />
logger automatically uses the date and time settings of the server.<br />
8. If an SVS sensor if used, complete the following steps:<br />
a. Click on the Surcharge Settings tab.<br />
b. Select the Use SVS Sensor check box.<br />
c. Select the sensor port on the logger where the SVS is attached.<br />
d. Change any of the SVS settings if necessary:<br />
Option<br />
Reversed SVS Sensor<br />
Conductivity Trigger<br />
Distance Turn-On<br />
Description<br />
Select if the <strong>Flo</strong>-Dar sensor is installed in the reverse<br />
direction.<br />
The conductivity value that starts the <strong>Flo</strong>-Dar surcharge<br />
mode (secondary trigger).<br />
The distance that starts the SVS operation (primary trigger).<br />
31
Device communication<br />
Option<br />
Distance Switchover<br />
Description<br />
The distance that starts the <strong>Flo</strong>-Dar surcharge mode (primary<br />
trigger).<br />
Surcharge Level Trigger The surcharge level that starts the SVS operation (secondary<br />
trigger).<br />
SVS Velocity Multiplier<br />
The multiplier that is used to adjust the SVS measurements.<br />
Note: After the SVS port number is specified in the <strong>Flo</strong>-Dar setup, the menus are the<br />
same for the Sensor Port[1] (<strong>Flo</strong>-Dar) and the Sensor Port[2] (SVS) screens.<br />
If an SVS is not used, make sure that the Use SVS Sensor check box is not<br />
selected.<br />
4.1.4.6.1 Calibrate the <strong>Flo</strong>-Dar surcharge level<br />
Calibration of the surcharge level sensor is usually not necessary when the auto<br />
calibration function is enabled. The value for the surcharge level should be zero during<br />
normal flow conditions. If the value is high or drifts, replace the desiccant cartridge.<br />
1. Click on the Advanced Settings tab in the Sensor Port[1] (<strong>Flo</strong>Dar) menu and click<br />
CALIBRATE. The Surcharge Level Calibration window opens.<br />
2. Click TAKE SAMPLE. The sensor measures the surcharge level. When complete,<br />
the value is shown in the Sensor field.<br />
3. If the measured depth is not zero (or the measured value), enter zero (or the<br />
measured value) in the Actual field. The offset is calculated and shown. The offset is<br />
used to adjust the measured value to the correct value.<br />
4. Click OK.<br />
5. Change any of the surcharge level settings if necessary:<br />
Option<br />
Level Calibration<br />
Stability Variance<br />
Trigger Count<br />
Description<br />
Shows the current value for the level calibration.<br />
Changes the required stability for auto calibration.<br />
Changes the required number of stable readings for auto calibration.<br />
32
Device communication<br />
Option<br />
Auto Range Min<br />
Description<br />
Negative value limit for auto calibration.<br />
Auto Range Max<br />
Positive value limit for auto calibration.<br />
6. Click WRITE TO LOGGER to save the settings. A message window is shown:<br />
Option<br />
Warning: all data<br />
will be lost.<br />
Continue?<br />
Description<br />
All data that is stored in the logger is erased when a program is written to<br />
the logger. To save the data, select No and download the data to a safe<br />
location. Select Yes to erase all data and update the logger with the new<br />
program.<br />
Set Logger Clock Synchronize to Computer Clock—the logger uses the date and time<br />
settings of the computer. Set Logger Clock—the logger uses the date<br />
and time settings that are set by the user. If the unit has a modem, the<br />
logger automatically uses the date and time settings of the server.<br />
The level calibration is complete.<br />
Note: The data in the Quality Parameters section should not be changed unless recommended by<br />
technical support.<br />
4.1.4.6.2 Calibrate the <strong>Flo</strong>-Dar ultrasonic level sensor<br />
Calibrations must be done at the location where the sensor is installed. The sensor does<br />
not need to be calibrated again unless it is moved.<br />
1. Click on the General Settings tab.<br />
2. In the <strong>Flo</strong>-Dar U-Sonic Level Settings section, select the Transducer Type (standard<br />
or extended range).<br />
3. If the sensor height is known, enter the value in the sensor height field. The sensor<br />
height is the distance from the bottom of the flow channel to the top of the sensor<br />
frame. If the sensor height is not known, do the following:<br />
a. Click ENTER. The U-Sonic Height window opens.<br />
b. Click TAKE SAMPLE. The sensor measures the distance to the liquid surface.<br />
c. In the Measured Level field, enter the depth of the liquid in the channel. The<br />
sensor height is then calculated and shown in the Sensor Height field.<br />
4. Click OK. The U-Sonic Height window closes.<br />
5. If there is sediment in the flow channel, enter the amount in the Sediment field.<br />
6. Click the CALIBRATE button. The U-Sonic Level Calibration window opens.<br />
33
Device communication<br />
7. Click TAKE SAMPLE. The sensor measures the distance to the liquid surface and<br />
uses the sensor height information to calculate the liquid level. After approximately<br />
45 seconds, the level measurement is shown.<br />
8. If the measured depth is different, enter the measured value in the Actual field. The<br />
offset is calculated and shown. The offset is used to adjust the measured value to the<br />
correct value.<br />
9. Click OK.<br />
10. Click WRITE TO LOGGER to save the settings. A message window is shown:<br />
Option<br />
Warning: all data<br />
will be lost.<br />
Continue?<br />
Description<br />
All data that is stored in the logger is erased when a program is written to<br />
the logger. To save the data, select No and download the data to a safe<br />
location. Select Yes to erase all data and update the logger with the new<br />
program.<br />
Set Logger Clock Synchronize to Computer Clock—the logger uses the date and time<br />
settings of the computer. Set Logger Clock—the logger uses the date<br />
and time settings that are set by the user. If the unit has a modem, the<br />
logger automatically uses the date and time settings of the server.<br />
The level calibration is complete.<br />
4.1.4.6.3 Calibrate the <strong>Flo</strong>-Dar velocity<br />
Calibrations must be done at the location where the sensor is installed. The sensor does<br />
not need to be calibrated again unless it is moved. Be sure to complete the level<br />
calibration before the velocity calibration is started.<br />
1. Click on the General Settings tab.<br />
2. In the <strong>Flo</strong>Dar Velocity Settings section, select a Velocity Method:<br />
• Mean Vel—use for circular flow channels.<br />
• Vel Multiplier—use for non-circular flow channels.<br />
3. If the velocity and flow are known, enter a site multiplier.<br />
a. Click the GENERATE button. The Velocity Multiplier window opens.<br />
34
Device communication<br />
b. Click TAKE SAMPLE. After approximately 45 seconds, the measured velocity is<br />
shown.<br />
c. In the Actual Velocity field, enter the known velocity. The multiplier value is<br />
calculated and the value is shown in the Multiplier field.<br />
d. Click OK.<br />
e. Repeat steps a–d to make sure the velocity is stable.<br />
4. If the average velocity is not known, a velocity profile should be completed.<br />
a. Click on the Diagnostics tab and then the Current Status menu.<br />
b. Record several real-time velocity readings from the Channel Info section.<br />
c. Calculate the average of the real-time velocity readings.<br />
d. Complete a velocity profile. The Open Channel Profiling Handbook is a good<br />
reference on velocity profiling.<br />
e. After the velocity profile is completed, repeat steps a–c.<br />
f. Compare the average velocity from the real-time readings to the velocity profile.<br />
g. Calculate the multiplier to convert the <strong>Flo</strong>-Dar velocity to the profiled velocity.<br />
h. Click on the Programming tab and go to the <strong>Flo</strong>-Dar sensor port menu.<br />
i. Enter the multiplier in the Site Multiplier field in the General Settings tab.<br />
5. Change any of the velocity settings if necessary:<br />
Option<br />
Site Multiplier<br />
Min FFT Limit<br />
Max FFT Limit<br />
Min Velocity Cutout<br />
Description<br />
Adjusts the <strong>Flo</strong>-Dar velocity to the profiled or known value.<br />
Narrows the processing window of the velocity measurement.<br />
Narrows the processing window of the velocity measurement.<br />
Forces the velocity to a substitute value when the measurement is<br />
outside of a user-specified range.<br />
Max Velocity Cutout Forces the velocity to a substitute value when the measurement is<br />
outside of a user-specified range.<br />
6. Click WRITE TO LOGGER to save the settings. A message window is shown:<br />
Option<br />
Warning: all data<br />
will be lost.<br />
Continue?<br />
Description<br />
All data that is stored in the logger is erased when a program is written to<br />
the logger. To save the data, select No and download the data to a safe<br />
location. Select Yes to erase all data and update the logger with the new<br />
program.<br />
Set Logger Clock Synchronize to Computer Clock—the logger uses the date and time<br />
settings of the computer. Set Logger Clock—the logger uses the date<br />
and time settings that are set by the user. If the unit has a modem, the<br />
logger automatically uses the date and time settings of the server.<br />
35
Device communication<br />
The velocity calibration is complete.<br />
4.1.4.7 <strong>Flo</strong>-Tote setup—Cal Wizard<br />
The sensor can be configured and calibrated with the calibration wizard. The sensor must<br />
be installed in the process and the connection status must be online for calibration. If the<br />
flow channel is odd-shaped, refer to <strong>Flo</strong>-Tote setup—manual on page 36.<br />
1. Click on the Programming tab in the FL900 Series Driver window. If online, the<br />
attached sensors and ports are shown.<br />
2. Click on Sensor Port[1] (<strong>Flo</strong>Tote).<br />
3. Select the units in the Unit Preferences section. These units can be different from the<br />
logged units that are specified in the Datalog Setup menu.<br />
4. Click on the CAL WIZARD button. The Calibration Wizard window opens.<br />
5. Select the options on each screen and click NEXT:<br />
Option<br />
Description<br />
Number of samples The number of times the sensor is sampled for the calibration<br />
measurements (1, 2 or 3).<br />
<strong>Flo</strong>w parameters<br />
Sensor offset<br />
Sediment value<br />
Actual level<br />
Actual velocity<br />
The shape and dimensions of the flow channel (circular, rectangular,<br />
trapezoidal or U-shaped).<br />
The difference between the measured level and the actual level.<br />
The amount of sediment in the flow channel.<br />
The liquid level (depth) in the flow channel. If the sensor height was<br />
measured indirectly, the liquid level must be measured manually.<br />
The user can measure the velocity with a different instrument and enter<br />
the value (optional).<br />
6. When the Calibration Complete screen is shown, click FINISH. The Calibration<br />
Wizard window closes.<br />
Note: The Calibration Complete screen shows the values that were entered by the user and<br />
the values that were measured by the sensor. If the values are different, the calibration<br />
adjustment value or multiplier is shown.<br />
7. Click WRITE TO LOGGER to save the settings. A message window is shown:<br />
Option<br />
Warning: all data<br />
will be lost.<br />
Continue?<br />
Set Logger Clock<br />
Description<br />
All data that is stored in the logger is erased when a program is written to<br />
the logger. To save the data, select No and download the data to a safe<br />
location. Select Yes to erase all data and update the logger with the new<br />
program.<br />
Synchronize to Computer Clock—the logger uses the date and time<br />
settings of the computer. Set Logger Clock—the logger uses the date<br />
and time settings that are set by the user. If the unit has a modem, the<br />
logger automatically uses the date time settings of the server.<br />
4.1.4.8 <strong>Flo</strong>-Tote setup—manual<br />
The Calibration Wizard is the easiest method to set up the sensor. Use the manual setup<br />
for odd-shaped flow channels or to adjust some of the calibration parameters. The sensor<br />
must be installed in the process and the connection status must be online for calibration.<br />
36<br />
1. Click on the Programming tab in the FL900 Series Driver window. If online, the<br />
attached sensors and ports are shown.<br />
2. Click on Sensor Port[1] (<strong>Flo</strong>Tote).<br />
3. Select the units in the Unit Preferences section. These units can be different from the<br />
logged units that are specified in the Datalog Setup menu.<br />
4. Click on the <strong>Flo</strong>w Settings tab and select the shape of the flow channel.
Device communication<br />
5. Enter the dimensions of the flow channel. Be sure to enter the correct depth for noncircular<br />
channels.<br />
6. If the flow channel is odd-shaped, a table is shown. A cross-section of the shape can<br />
be divided into parts and the area of the parts can be entered into the table.<br />
7. Click WRITE TO LOGGER to save the settings. A message window is shown:<br />
Option<br />
Warning: all data<br />
will be lost.<br />
Continue?<br />
Description<br />
All data that is stored in the logger is erased when a program is written to<br />
the logger. To save the data, select No and download the data to a safe<br />
location. Select Yes to erase all data and update the logger with the new<br />
program.<br />
Set Logger Clock<br />
8. Click on the General Settings tab.<br />
Synchronize to Computer Clock—the logger uses the date and time<br />
settings of the computer. Set Logger Clock—the logger uses the date<br />
and time settings that are set by the user. If the unit has a modem, the<br />
logger automatically uses the date time settings of the server.<br />
9. In the velocity settings section, click the CALCULATE button. The Site Coefficient<br />
window opens.<br />
10. Click TAKE SAMPLE. The velocity measurement starts. When complete, the<br />
measured velocity is shown.<br />
11. Measure the velocity with a different instrument and enter the value in the Actual<br />
Velocity field. The multiplier value adjusts the sensor reading to be the same as the<br />
actual velocity value.<br />
12. Click OK.<br />
13. In the level settings section, click the CALIBRATE button. The Level Calibration<br />
window opens.<br />
14. Click TAKE SAMPLE. The level measurement starts. When complete, the measured<br />
level is shown.<br />
15. Measure the liquid level manually and enter the value in the Actual Level field. The<br />
offset value adjusts the sensor reading to be the same as the actual value.<br />
16. Click WRITE TO LOGGER to save the settings. A message window is shown:<br />
Option<br />
Warning: all data<br />
will be lost.<br />
Continue?<br />
Set Logger Clock<br />
Description<br />
All data that is stored in the logger is erased when a program is written to<br />
the logger. To save the data, select No and download the data to a safe<br />
location. Select Yes to erase all data and update the logger with the new<br />
program.<br />
Synchronize to Computer Clock—the logger uses the date and time<br />
settings of the computer. Set Logger Clock—the logger uses the date<br />
and time settings that are set by the user. If the unit has a modem, the<br />
logger automatically uses the date time settings of the server.<br />
4.1.4.9 Ultrasonic setup—Cal Wizard<br />
Make sure to calibrate the sensor in the operating environment at the typical ambient<br />
operating temperature. The temperature of the environment is included in calibration and<br />
measurement calculations. The sensor has a 60 minute thermal constant over a 20 °C<br />
(36 °F) change in temperature. Give the sensor time to adjust to a large temperature<br />
change before calibration.<br />
To calculate flow with level-area or head-flow tables, calibrate the sensor manually.<br />
37
Device communication<br />
Note: Only the level is calibrated unless an area velocity measurement is supplied by a velocity<br />
sensor on a separate sensor port of the FL900 series flow logger and that sensor port is selected in<br />
the Velocity Input field on the <strong>Flo</strong>w tab.<br />
1. Click the Programming tab in the FL900 Series Driver window. If online, the attached<br />
sensors and ports show.<br />
2. Select Sensor Port (US900X). The US900X Configuration screen shows.<br />
3. In the Level Unit field, select the measurement units for the level.<br />
Note: The level unit can be different from the logged units that are selected in the Datalog<br />
Setup tab.<br />
4. In the <strong>Flo</strong>w Unit field, select the measurement units for the flow rate.<br />
5. Select the options.<br />
Option<br />
Sensor Type<br />
Sediment<br />
Level Offset<br />
(optional)<br />
Description<br />
Select the sensor type—Downlooking or In-Pipe.<br />
Enter the level of sediment in the bottom of the channel.<br />
Enter the difference between the measured level and the actual level.<br />
Use to correct an offset error without having to do a calibration.<br />
6. Click CAL WIZARD. The Calibration Wizard window opens.<br />
7. Select the options on each screen and click NEXT.<br />
Option<br />
Sensor Type<br />
<strong>Flo</strong>w Method<br />
Dimensions<br />
Velocity Input<br />
Current Level<br />
Number of<br />
Measurements<br />
Description<br />
Select the sensor type—Downlooking or In-Pipe.<br />
Select the flow calculation method—area velocity, primary device or<br />
None. Select an area velocity option to calculate the flow rate based on<br />
the area velocity supplied by a velocity sensor that is connected to the<br />
flow logger. Select the type of primary device (e.g., flume or weir) to<br />
calculate the flow rate based on the type of primary device.<br />
Note: The ultrasonic sensor can be used as a level measurement<br />
device only. Select None to not calculate the flow rate.<br />
Enter the physical parameters of the selected flow calculation method.<br />
If the flow calculation method selected in the <strong>Flo</strong>w Method field is an<br />
area velocity option, select the source of the area velocity input. For<br />
example, if an ultrasonic sensor is connected to Port 1 and a<br />
submerged area velocity sensor is connected to Port 2, select Port 2 in<br />
the Velocity Input field.<br />
Note: If a primary device or None is selected in the <strong>Flo</strong>w Method field,<br />
the Velocity Input field is disabled.<br />
Enter the flow level in the channel by direct measurement.<br />
Select the number of measurements to do during calibration—1, 2 or 3.<br />
For more than 1 measurement, <strong>Flo</strong>-<strong>Ware</strong> shows the average.<br />
If the calibration was successful, a summary of values shows:<br />
• Distance (downlooking)—the distance from the face of the sensor to the water<br />
surface<br />
• Distance (in-pipe)—the distance from the sensor tube to the water surface<br />
• Temperature—the temperature of the operating environment measured by the<br />
sensor<br />
• Zero Level Distance—the distance from the face of the sensor or sensor tube to<br />
the bottom of the channel<br />
• Echo Loss—the percentage of the ultrasonic signal that was lost during send and<br />
receive<br />
8. Click NEXT. "Calibration Complete" shows.<br />
38
Device communication<br />
Note: If the calibration was not successful, an error message shows and the sensor takes<br />
another measurement.<br />
9. Click FINISH.<br />
10. Click WRITE TO LOGGER to save the settings. A window opens.<br />
11. Optional: Select the options.<br />
Option<br />
Set Logger<br />
Clock<br />
Erase Data<br />
Description<br />
Set the flow logger clock to the date and time setting of the computer<br />
connected to the flow logger. If the flow logger has a modem, the flow<br />
logger clock is set to the date and time of the server.<br />
Erase all the data that is kept on the flow logger.<br />
12. Click OK.<br />
13. Click the <strong>Flo</strong>w tab that is above the Level Settings section. The values entered during<br />
calibration show in the fields.<br />
4.1.4.10 Ultrasonic setup—manual<br />
The Calibration Wizard is the easiest method to set up the sensor. Use the manual setup<br />
for sites with level-area or head-flow tables. The sensor must be installed in the process<br />
and the connection status must be online for calibration.<br />
1. Click the Programming tab in the FL900 Series Driver window. If online, the attached<br />
sensors and ports show.<br />
2. Select Sensor Port (US900X). The US900X Configuration screen shows.<br />
3. In the Level Unit field, select the measurement units for the flow level.<br />
Note: The level unit can be different from the logged units that are selected in the Datalog<br />
Setup menu.<br />
4. In the <strong>Flo</strong>w Unit field, select the measurement units for the flow rate.<br />
5. Select the options.<br />
Option<br />
Sensor Type<br />
Sediment<br />
Level Offset<br />
(optional)<br />
Description<br />
Select the sensor type—Downlooking or In-Pipe.<br />
Enter the level of sediment in the bottom of the channel.<br />
Enter the difference between the measured level and the actual level.<br />
Use to correct an offset error without having to do a calibration.<br />
6. Click CALIBRATE. The selected sensor type shows.<br />
7. Click TAKE SAMPLE. The Distance field shows the distance measurement from the<br />
sensor.<br />
• Distance (downlooking)—the distance from the face of the sensor to the water<br />
surface<br />
• Distance (in-pipe)—the distance from the sensor tube to the water surface<br />
8. In the Actual Level field, enter the actual measured level of the water. The Zero Level<br />
Distance field shows the zero level.<br />
The zero level is the distance from the face of the sensor or sensor tube to the bottom<br />
of the channel.<br />
9. Click OK, then OK.<br />
10. Click WRITE TO LOGGER to save the settings. A window opens.<br />
39
Device communication<br />
11. Optional: Select the options.<br />
Option<br />
Set Logger<br />
Clock<br />
Erase Data<br />
Description<br />
Set the flow logger clock to the date and time setting of the computer<br />
connected to the flow logger. If the flow logger has a modem, the flow<br />
logger clock is set to the date and time of the server.<br />
Erase all the data that is kept on the flow logger.<br />
12. Click OK.<br />
13. Click the <strong>Flo</strong>w tab that is above the Level Settings section.<br />
14. Select the options.<br />
Option<br />
Primary<br />
Device<br />
Dimensions<br />
Velocity Input<br />
Description<br />
Select the flow calculation method—area velocity, primary device or None.<br />
Select an area velocity option to calculate the flow rate based on the area<br />
velocity supplied by a velocity sensor that is connected to the flow logger.<br />
Select the type of primary device (e.g., flume or weir) to calculate the flow<br />
rate based on the type of primary device.<br />
Note: The ultrasonic sensor can be used as a level measurement device<br />
only. Select None to not calculate the flow rate.<br />
Enter the physical parameters of the selected flow calculation method.<br />
If the flow calculation method selected in the <strong>Flo</strong>w Method field is an area<br />
velocity option, select the source of the area velocity input. For example, if<br />
an ultrasonic sensor is connected to Port 1 and a submerged area velocity<br />
sensor is connected to Port 2, select Port 2 in the Velocity Input field.<br />
Note: If a primary device or None is selected in the <strong>Flo</strong>w Method field, the<br />
Velocity Input field is disabled.<br />
15. Click WRITE TO LOGGER to save the settings.<br />
4.1.4.11 Ultrasonic sensor—application settings<br />
The application settings on the Application Settings tab supply more filtering options to<br />
manage difficult sites. For most flow conditions, the factory default settings on the<br />
Application Settings tab are correct. Contact technical support before changes are made<br />
to the application settings.<br />
1. Click the Programming tab in the FL900 Series Driver window. If online, the attached<br />
sensors and ports show.<br />
2. Select Sensor Port (US900X). The US900X Configuration screen shows.<br />
3. Click the Application Settings tab. Select the options.<br />
Option<br />
Filter Size<br />
Reject High<br />
Reject Low<br />
Number of<br />
Holds<br />
Description<br />
Select the number of readings the flow logger takes and averages for one<br />
data point—1–50 (default = 16).<br />
Select the number of the highest values that are discarded—0–49.<br />
For example, if the filter size is 16 and the reject high and reject low values<br />
are 4, the sensor collects 16 measurements and discards the highest 4 and<br />
the lowest 4 measurements. The other 8 values are used to calculate the<br />
average data point of level.<br />
Select the number of the lowest values that are discarded—0–49.<br />
Select the number of times the last recorded data point is saved to the log if<br />
a failed reading occurs due to echo loss (default = 5). For example, if the<br />
number of holds is 5, the last data point replaces the next 5 consecutive<br />
failed readings or until a successful reading occurs.<br />
40
Device communication<br />
Option<br />
Median Filter<br />
Description<br />
Select the number of data points that will be used in the flow logger median<br />
filter (default = None). The flow logger takes median of 3, 5, 7, 9 or 11 data<br />
points to decrease noise or outliers. Only the median values are logged.<br />
Raw data values are not logged.<br />
Sample Rate Select the number of samples taken per second—1–10 (default = 4).<br />
Minimum<br />
Distance<br />
Maximum<br />
Distance<br />
Select the minimum distance for the sensor. For the in-pipe sensor, the<br />
default is 0. For a downlooking sensor, the default is 5.25 in. Distances less<br />
than the minimum distance of the sensor are ignored.<br />
Select the maximum distance for the sensor. For the in-pipe sensor, the<br />
default is 150.75 in. For a downlooking sensor, the default is 156.00 in.<br />
Distances more than the maximum distance of the sensor are ignored.<br />
4. Click WRITE TO LOGGER to save the settings.<br />
Note: To change the configuration settings to the factory defaults, click RESTORE<br />
DEFAULTS.<br />
4.1.4.12 AV9000 Analyzer Module setup—Cal Wizard<br />
The sensor can be configured and calibrated with the calibration wizard. The sensor must<br />
be attached to the logger and online for calibration.<br />
Note: Only the level is calibrated with the Cal Wizard. The velocity value that is shown does not<br />
represent a velocity calibration. A calibration for velocity is not necessary, but can be completed<br />
manually ( AV9000 Analyzer Module setup—manual on page 42).<br />
1. Click on the Programming tab in the FL900 Series Driver window. If online, the<br />
attached sensors and ports are shown.<br />
2. Click on Sensor Port[1] (AV9000).<br />
3. Select the units in the Unit Preferences section. These units can be different from the<br />
logged units that are specified in the Datalog Setup menu.<br />
4. Click on the CAL WIZARD button. The Calibration Wizard window opens.<br />
5. Select the shape and dimensions of the flow channel (circular, rectangular,<br />
trapezoidal or U-shaped) and click NEXT.<br />
Note: If the flow channel is odd-shaped, refer to AV9000 Analyzer Module setup—manual<br />
on page 42.<br />
6. Select the type of calibration and click NEXT:<br />
Option<br />
Zero calibration in air<br />
Level adjust in flow<br />
Description<br />
The sensor is not installed in the flow channel.<br />
The sensor is installed in the flow channel.<br />
Note: It is recommended to do a zero calibration in air to get a reference each time a new<br />
sensor is deployed or a sensor is moved to a new site. If a calibration is done in the flow, also<br />
do a calibration in air.<br />
7. If the sensor is installed in the flow channel, select the options on each screen and<br />
click NEXT:<br />
Option<br />
Number of<br />
samples<br />
Actual level<br />
Description<br />
The number of times the sensor is sampled for the calibration<br />
measurements (Enter a value between 1 and 6. Only one value is entered<br />
regardless of the number of samples.)<br />
The liquid level (depth) in the flow channel. If the sensor height was<br />
measured indirectly, the liquid level must be measured manually.<br />
8. When the Calibration Complete screen is shown, click FINISH. The Calibration<br />
Wizard window closes.<br />
41
Device communication<br />
Note: The Calibration Complete screen shows the values that were entered by the user and<br />
the values that were measured by the sensor. If the values are different, the calibration<br />
adjustment value or multiplier is shown.<br />
9. Click WRITE TO LOGGER to save the settings. A message window is shown:<br />
Option<br />
Warning: all data<br />
will be lost.<br />
Continue?<br />
Set Logger Clock<br />
Description<br />
All data that is stored in the logger is erased when a program is written to<br />
the logger. To save the data, select No and download the data to a safe<br />
location. Select Yes to erase all data and update the logger with the new<br />
program.<br />
Synchronize to Computer Clock—the logger uses the date and time<br />
settings of the computer. Set Logger Clock—the logger uses the date<br />
and time settings that are set by the user. If the unit has a modem, the<br />
logger automatically uses the date time settings of the server.<br />
4.1.4.13 AV9000 Analyzer Module setup—manual<br />
The Calibration Wizard is the easiest method to set up the sensor. Use the manual setup<br />
for velocity calibration, odd-shaped flow channels or to adjust some of the calibration<br />
parameters. The sensor must be online for calibration.<br />
1. Click on the Programming tab in the FL900 Series Driver window. If online, the<br />
attached sensors and ports are shown.<br />
2. Click on Sensor Port[1] (AV9000).<br />
3. Select the units in the Unit Preferences section. These units can be different from the<br />
logged units that are specified in the Datalog Setup menu. If the sensor is mounted<br />
downstream in a reversed position, check "reversed sensor" to record flow with a<br />
positive value. If applicable, enter values for sensor offset, level or allowance for<br />
sediment in the channel.<br />
4. Calibrate the level in the level settings section.<br />
a. Click the CALIBRATE button. The Level Calibration window opens.<br />
b. Click TAKE SAMPLE. The level measurement starts. When complete, the<br />
measured level is shown.<br />
c. Measure the liquid level manually and enter the value in the Actual Level field.<br />
The offset value adjusts the sensor reading to be the same as the actual value.<br />
5. Click on the <strong>Flo</strong>w Settings tab and select the shape of the flow channel.<br />
6. Enter the dimensions of the flow channel. Be sure to enter the correct depth for noncircular<br />
channels.<br />
7. If the flow channel is odd-shaped, a table is shown. A cross-section of the shape can<br />
be divided into parts and the area of the parts can be entered into the table.<br />
8. Click on the Application Settings tab.<br />
9. Change the application settings if necessary.<br />
Option<br />
Repeat count<br />
Description<br />
The number of distinct target sets which are measured to determine velocity.<br />
Six is the factory default. The user may enter other values. For values<br />
greater than 8, a logging interval greater than one minute is necessary.<br />
Large repeat counts will shorten the battery life. If multiple sensors are<br />
attached, one-minute logging intervals are not recommended.<br />
42
Device communication<br />
Option<br />
Delay time<br />
Target sets<br />
(Target set<br />
averaging)<br />
Description<br />
The time paused between the repeats to assure distinct target sets are<br />
captured. The factory default is 2500 ms (2.5 sec). The user may enter other<br />
values. The optimal delay time value depends on the level and velocity.<br />
Deals with velocity measurement noise caused by the non-uniform<br />
distribution of moving targets in typical waste water flow streams. This target<br />
noise can be reduced by averaging several readings based on distinct target<br />
sets. There are several options for averaging:<br />
• Robust filtering–sorts velocity readings from highest to lowest and<br />
averages the middle values<br />
• Reject drops–excludes outliers at low absolute velocity<br />
• Reject spikes–excludes outliers at high absolute velocity<br />
• Lo Freq Rej–Low Frequency Rejection may be useful to eliminate noise<br />
in highly turbulent sites where swirling occurs at the nose of the sensor<br />
10. Click on the Advanced Settings tab.<br />
11. Change the application setting, if necessary.<br />
12. If the velocity and flow are known, a site multiplier can be generated to calibrate the<br />
velocity.<br />
a. Click the CALCULATE button. The Velocity Multiplier window opens.<br />
b. Click TAKE SAMPLE. The velocity measurement starts. When complete, the<br />
measured velocity is shown.<br />
c. Measure the velocity with a different instrument and enter the value in the Actual<br />
Velocity field. The multiplier value adjusts the sensor reading to be the same as<br />
the actual velocity value.<br />
d. Click OK.<br />
13. Change any of the settings for velocity if necessary:<br />
Option<br />
Site Multiplier<br />
Low Level<br />
Cutout<br />
Substitute<br />
Velocity<br />
Filter Size<br />
Salinity<br />
Description<br />
The value that adjusts the sensor velocity reading to be the same as the<br />
velocity reading from a different instrument. If not sure, use the default value<br />
of 1.0.<br />
Forces the velocity to a substitute value when the level measurement is<br />
below a user-specified value. The factory default is enabled at 0.8 inches.<br />
The value of the substitute velocity (typically 0).<br />
Select the type of filter and the filter size (factory default is none). Takes the<br />
average and/or median of 3, 5, 7, 9 or 11 data points to reduce noise or<br />
outliers. Only the average and/or median values are logged—raw data<br />
values are not logged. A significant delay can occur before sudden changes<br />
in flow are logged, therefore this option is not recommended for stormwater<br />
applications.<br />
Select wastewater, salt water or enter a user defined value. Factory default<br />
is wastewater.<br />
43
Device communication<br />
Option<br />
Analyzer<br />
Settings<br />
Diagnostic<br />
Mode<br />
Description<br />
Doppler Min/Max. Useful to remove noise from turbulent sites. This sets<br />
velocity limits based on the FFT defined in Hz. It is recommended to contact<br />
Tech Support for FFT evaluation and recommendation.<br />
Use this mode to capture details useful when troubleshooting with Tech<br />
Support. To run diagnostics, go to Diagnostics tab, Sensors, select time<br />
series (1 hour, 1 day or 1 week) and Run Diagnostics. Diagnostics will be<br />
recorded for the specified time frame.<br />
• Normal–Factory default setting.<br />
• Asym Spectra–Assymetrical Spectra. Allows comparison of remaining<br />
spectra after mirror image is removed.<br />
• Extend Spectra–Allows a detailed view of the noise floor of "best scale."<br />
• Extend All–Similar to Extend Spectra, but of all scales.<br />
• Time Series–Time series sub-measurement data only up to<br />
32 readings.<br />
• Combination–Time series (up to 20 points) plus "Normal". Allows<br />
viewing of sub-measurements based on repeat count.<br />
14. Click WRITE TO LOGGER if connected to logger to save the settings, or click SAVE<br />
PROGRAM TO FILE to create a template. A message window is shown:<br />
Option<br />
Warning: all data<br />
will be lost.<br />
Continue?<br />
Description<br />
All data that is stored in the logger is erased when a program is written to<br />
the logger. To save the data, select No and download the data to a safe<br />
location. Select Yes to erase all data and update the logger with the new<br />
program.<br />
Set Logger Clock Synchronize to Computer Clock—the logger uses the date and time<br />
settings of the computer. Set Logger Clock—the logger uses the date<br />
and time settings that are set by the user. If the unit has a modem, the<br />
logger automatically uses the date and time settings of the server.<br />
15. Change any of the settings for level if necessary.<br />
16. For help with difficult sites and additional diagnostic tools, contact Hach <strong>Flo</strong>w Tech<br />
support to assist with diagnostics on the TECH SUPPORT SETTINGS tab.<br />
4.1.4.14 IM9001 module setup<br />
The IM9001 interface module allows the logger to collect data from an attached Sigma<br />
<strong>Flo</strong>w Meter and transmit the data via a wireless or local connection. The data can be<br />
used to trigger alarms or pace a sampler. The module can also be used as a network<br />
interface for Modbus communication (Modbus communication on page 51).<br />
Use the Datalog Setup menu to set the log intervals and to select the channels that are<br />
logged (Datalog setup on page 29). The logging intervals that are programmed into the<br />
950 <strong>Flo</strong>w Meter must be greater than or equal to the logging intervals of the logger to be<br />
sure that all data is logged.<br />
Note: The Sigma <strong>Flo</strong>w Meter program cannot be configured through the IM9001 module. The <strong>Flo</strong>w<br />
Meter must be programmed with either <strong>Flo</strong>w Center software or the keypad on the <strong>Flo</strong>w Meter<br />
before connection to the IM9001 module. Refer to the Sigma User <strong>Manual</strong> for programming details.<br />
The logger program and Sigma <strong>Flo</strong>w Meter programs run independently of each other.<br />
The IM9001 module must be configured to communicate with a Sigma <strong>Flo</strong>w Meter.<br />
1. Click on the Programming tab in the FL900 Series Driver window. If online, the<br />
attached sensors and ports are shown.<br />
2. If offline, click on the Datalog Setup menu. Select the sensor(s) from the drop-down<br />
list in the Port Assignments section that agree with the sensor and port configurations<br />
on the logger.<br />
3. Click on Sensor Port[1] (IM9001).<br />
44
Device communication<br />
4. Change any of the options:<br />
Option<br />
Description<br />
Modbus Address This setting must match the Modbus address that is programmed into the<br />
Sigma <strong>Flo</strong>w Meter.<br />
Baud Rate<br />
This setting must match the Baud rate that is programmed into the Sigma<br />
<strong>Flo</strong>w Meter.<br />
5. Click WRITE TO LOGGER to save the settings. A message window is shown:<br />
Option<br />
Warning: all data<br />
will be lost.<br />
Continue?<br />
Set Logger Clock<br />
Description<br />
All data that is stored in the logger is erased when a program is written to<br />
the logger. To save the data, select No and download the data to a safe<br />
location. Select Yes to erase all data and update the logger with the new<br />
program.<br />
Synchronize to Computer Clock—the logger uses the date and time<br />
settings of the computer. Set Logger Clock—the logger uses the date<br />
and time settings that are set by the user. If the unit has a modem, the<br />
logger automatically uses the date time settings of the server.<br />
4.1.4.15 Set up alarms<br />
Use the Alarms menu to set up channel alarms, system alarms and notifications.<br />
Channels must first be selected in the Datalog Setup menu before channel alarms can be<br />
set. A maximum of 16 channel alarms can be set.<br />
Figure 9 Low alarm example<br />
1. Click the Programming tab.<br />
2. Click on the Alarms menu.<br />
3. To set a channel alarm, click on the Channel Alarms tab:<br />
a. Click on the ADD ALARM button.The Add Channel Alarm window opens.<br />
b. Select the channel from the drop-down list.<br />
c. Select the type of alarm (low/low, low, high, high/high) and click OK. The channel<br />
alarm is shown in the main section.<br />
d. Enter the trigger value and deadband. An alarm starts when the channel value is<br />
equal to the trigger value. An alarm stops when the channel value goes above<br />
(low alarm) or below (high alarm) the deadband value.<br />
1 Channel value 3 Low alarm stops 5 Trigger value<br />
2 Low alarm starts 4 Deadband 6 Time<br />
45
Device communication<br />
e. Select the actions that will start during an alarm condition:<br />
Option<br />
Send SMS from logger<br />
Send Email from logger<br />
Trigger sampler<br />
Switch to secondary log<br />
interval<br />
Switch to secondary call<br />
interval<br />
Send SMS from server<br />
Description<br />
Send an SMS (text) message from the logger—useful when<br />
the server cannot be contacted.<br />
Send an email message from the logger—useful when the<br />
server cannot be contacted.<br />
When a sampler is attached, start a sampling program.<br />
Switch to secondary log interval—the secondary log interval<br />
is used.<br />
Switch to secondary call interval—the secondary call<br />
interval is used.<br />
Send an SMS (text) message from the server—saves<br />
battery power on the logger.<br />
Send Email from server<br />
Send an email message from the server—saves battery<br />
power on the logger.<br />
4. To set a system alarm, click on the System Alarms tab:<br />
a. Select the system alarm type:<br />
Option<br />
Low Main Power<br />
Low RTC Battery<br />
Description<br />
The batteries in the logger or external power supply is less than<br />
8 V.<br />
The battery for the internal clock in the logger is weak.<br />
Low Slate Memory The datalog is 80% full.<br />
Slate Memory Full<br />
Sensor Timeout<br />
The datalog is full and data collection has stopped.<br />
The sensor has not responded to a call by the server.<br />
Sensor ID Error<br />
b. Select the system alarm actions:<br />
The program cannot detect what type of sensor is connected.<br />
Option<br />
Send SMS from logger<br />
Description<br />
Send a text message from the logger via the network provider.<br />
Send Email from logger Send an email from the logger via the network provider.<br />
Send SMS from server<br />
Send a text message from the FSDATA server.<br />
Send Email from server Send an email from the FSDATA server.<br />
5. To set enter recipient information for alarm notifications, click on the Recipients tab:<br />
a. Enter the email address for each email recipient (maximum of 5).<br />
b. Enter the number for each SMS (text message) recipient (maximum of 5).<br />
4.1.4.16 Set sampler options<br />
If a sampler is used, the sampler must be attached to the auxiliary port on the logger. Use<br />
the Sampler menu to specify when samples are taken.<br />
1. Click the Programming tab.<br />
2. Click on the Sampler menu.<br />
3. In the Pacing Source field, select the sensor port that will measure flow for the<br />
sampler.<br />
4. Enter the volume interval that generates a flow pulse to the sampler. For example, a<br />
sampler can take a sample every 100 gallons of flow.<br />
46
Device communication<br />
Note: The sampler can also take a sample during alarm conditions if the Trigger sampler<br />
action is set for a channel alarm.<br />
4.1.5 View data<br />
4.1.5.1 Download data<br />
When data is downloaded from the logger, the data includes the channel data, the event<br />
log, the alarm log and the sample history. The data is automatically saved as a .fl9 file in<br />
the default file path.<br />
1. Open a communication session with the logger (Connect to the logger on page 25).<br />
2. Click on one of the download options:<br />
Option<br />
Description<br />
Download all of the data from the logger.<br />
Download only the data that was logged since the last download.<br />
3. Wait for the data to download. When complete, a confirmation message is shown.<br />
Click OK. The data is shown in the FL900 window ( Tabular view on page 47).<br />
4.1.5.2 Open a site file<br />
Data files that were downloaded previously can be opened when the connection status is<br />
offline.<br />
4.1.5.3 Tabular view<br />
1. Make sure the connection status is offline. If online, click on the DISCONNECT<br />
button.<br />
2. Click on the OPEN A SITE FILE button. The Open file window opens.<br />
3. Find the file and click OPEN. The data is shown in the FL900 window ( Tabular view<br />
on page 47).<br />
The tabular view shows the data in a spreadsheet format (Figure 10). The following<br />
options are available:<br />
Option<br />
Open in <strong>Flo</strong>-<strong>Ware</strong><br />
Sort data<br />
Show or remove<br />
channels<br />
Change the date range<br />
Copy to the clipboard<br />
Print<br />
Export as tabseparated<br />
Description<br />
Click on the <strong>Flo</strong>-<strong>Ware</strong> icon to open the file in the main <strong>Flo</strong>-<strong>Ware</strong><br />
application<br />
Click on a column header to sort the data by that column<br />
Click on the check box next to a channel and click the UPDATE<br />
TABLE button to show or remove channels.<br />
Change the date and time range and click the UPDATE TABLE button.<br />
Click on the copy icon to copy the data to the clipboard. The data can<br />
then be pasted in a spreadsheet or other application.<br />
Click on the printer icon to send the data to a printer.<br />
Click on the TSV icon to export the data as a tab-separated file.<br />
47
Device communication<br />
Option<br />
Export as commaseparated<br />
Description<br />
Click on the CSV icon to export the data as a comma-separated file.<br />
Open in Excel Click on the Excel icon to open the data in Microsoft ® Excel ®<br />
spreadsheet software.<br />
Figure 10 FL900 tabular data view<br />
4.1.5.4 Graph view<br />
The graph view shows the data in a line graph (Figure 11). A maximum of 2 channels can<br />
be shown. The rain gauge and sampler are shown as bars in addition to the 2 selected<br />
channels. The bars for the sampler are shown in a green color when a sample was<br />
collected and in a red color if the sampler failed to collect a sample.<br />
The following options are available:<br />
Option<br />
Show or remove<br />
channels<br />
Change the date range<br />
Description<br />
Click on the check box next to a channel and click the UPDATE TABLE<br />
button to show or remove channels.<br />
Change the date and time range and click the UPDATE TABLE button.<br />
48
Device communication<br />
Option<br />
Copy to the clipboard<br />
Print<br />
Export as image<br />
Zoom in<br />
Zoom out<br />
Pan left, right, up or<br />
down<br />
Description<br />
Click on the copy icon to copy the data to the clipboard. The data can<br />
then be pasted in a spreadsheet or other application.<br />
Click on the printer icon to send the data to a printer.<br />
Click on the BMP icon to save the graph in a .bmp image format.<br />
Click on the graph and drag to the right to zoom in.<br />
Click on the graph and drag to the left to zoom out.<br />
Right-click on the graph and drag to the left, right, up or down to move<br />
the graph position.<br />
Figure 11 FL900 graph view<br />
4.1.5.5 Sample log<br />
When a sampler is attached to the logger, the following sample data is collected and<br />
shown in the tabular format:<br />
• Date and time of the sample<br />
• Sample status (success or failed)<br />
• Sample number<br />
• Sample bottle number<br />
49
Device communication<br />
4.1.6 Troubleshooting<br />
Refer to the Tabular view on page 47 for a description of the available user options.<br />
4.1.6.1 View diagnostic information<br />
The user can view diagnostic information to help solve a problem or to confirm normal<br />
operation.<br />
1. Click on the Diagnostics tab.<br />
2. Select one of the menu options:<br />
Option<br />
Event Log<br />
Current<br />
Status<br />
Sensors<br />
Modem<br />
Alarm Log<br />
Description<br />
The date and time, event number, event text and event data is shown for all<br />
events in the tabular format. Refer to the Tabular view on page 47 for a<br />
description of the available user options.<br />
When online, real-time general information such as the power supply voltage is<br />
shown. The measured channel values are shown and are updated at the same<br />
interval that is set in the logger program. If a sampler is connected, the volume<br />
before the next sample is taken is shown.<br />
When online, the user can download a sensor diagnostic file (.sdf) for use by<br />
technical support. The file is saved in the location that is specified in the<br />
settings. Technical support may ask the user to take a sample or to run<br />
diagnostics for a specified time (1 hour, 1 day or 1 week) to get additional<br />
diagnostic information.<br />
When online, information about the modem and the signal strength is shown.<br />
The registration status should show home. The CALL SERVER button can be<br />
used to connect to the server and to show connection information. When the<br />
call is complete, click the SAVE button to save the information.<br />
The data for all alarms is shown in the tabular format. Refer to the Tabular view<br />
on page 47 for a description of the available user options.<br />
4.1.6.2 <strong>Manual</strong> USB driver installation<br />
If there was a problem with the USB driver installation, install the USB driver manually.<br />
1. With the logger attached to the PC, open the Windows Device Manager.<br />
2. Find the FL-9XX port under the Ports node and open the port properties.<br />
3. Install the driver from C:\Program Files\<strong>Flo</strong>-<strong>Ware</strong>\FL9xx\Backup (file name:<br />
FL-9XX_USB.inf).<br />
4.1.6.3 Restore factory settings<br />
If necessary, the user program in the logger can be replaced with the factory settings.<br />
1. Make sure that the logger is attached to the computer and that the connection status<br />
is online.<br />
2. Click on the Utilities tab.<br />
50
Device communication<br />
3. Select the Restore Factory Settings option.<br />
4. Click WRITE TO LOGGER to save the settings. A message window is shown:<br />
Option<br />
Warning: all data<br />
will be lost.<br />
Continue?<br />
Set Logger Clock<br />
Description<br />
All data that is stored in the logger is erased when a program is written to<br />
the logger. To save the data, select No and download the data to a safe<br />
location. Select Yes to erase all data and update the logger with the new<br />
program.<br />
Synchronize to Computer Clock—the logger uses the date and time<br />
settings of the computer. Set Logger Clock—the logger uses the date<br />
and time settings that are set by the user. If the unit has a modem, the<br />
logger automatically uses the date time settings of the server.<br />
4.1.7 Update the firmware<br />
The firmware is updated regularly for continued improvement. Install the updates for best<br />
results.<br />
1. Click on the Utilities tab and select the Firmware Update menu.<br />
2. Select the file to install.<br />
3. Click START.<br />
4.1.A Modbus communication<br />
4. Select the udpate option and click OK. The update starts. Wait for the status to show<br />
complete.<br />
4.1.A.1<br />
Overview<br />
The Modbus protocol can be used for communication with the FL900 Series Loggers. An<br />
external network device such as a PLC can attach to the logger and read data as it is<br />
logged. Historical data cannot be read.<br />
The Modbus information that follows assumes that the network device is attached to the<br />
RS232 interface on the logger.<br />
4.1.A.2<br />
Communications setup<br />
An RS232 communication cable must be used to attach the logger to an external network<br />
device such as a PLC. Refer to the user manual for the FL900 Series <strong>Flo</strong>w Logger for<br />
detailed information.<br />
The communication settings can be changed with <strong>Flo</strong>-<strong>Ware</strong>. Refer to Communications<br />
settings—local on page 27. Table 3 shows the default settings and options for each<br />
setting.<br />
The logger supports various frame sizes based on the Modbus protocol and parity setting.<br />
The parity setting can be modified using <strong>Flo</strong>-<strong>Ware</strong>, thereby setting the frame size of the<br />
communication hardware. The following frame sizes are supported by the logger:<br />
Modbus RTU<br />
• 8 bits, even parity, 1 stop bit<br />
• 8 bits, odd parity, 1 stop bit<br />
• 8 bits, no parity, 2 stop bit<br />
Modbus ASCII<br />
• 7 bits, even parity, 1 stop bit<br />
51
Device communication<br />
• 7 bits, odd parity, 1 stop bit<br />
Setting Default Options<br />
Table 3 Communication settings<br />
Protocol Modbus RTU Modbus RTU or Modbus ASCII<br />
Address 2 1–247; also responds to broadcast address 0<br />
Baud rate 115200 9600, 19200, 38400, 57600, 115200<br />
Frame size 8 bits, no parity, 2 stop bits Modbus RTU: 8 bits, even parity, 1 stop bit; 8 bits, odd parity, 1 stop bit; 8 bits, no<br />
parity, 2 stop bits<br />
4.1.A.3<br />
Modbus ASCII: 7 bits, even parity, 1 stop bit; 7 bits, odd parity, 1 stop bit<br />
Communication with the logger<br />
The logger hardware makes use of transmit, receive, and signal ground signals on the<br />
RS232 interface. The logger responds to Modbus queries that match the assigned<br />
address as well as broadcast address 0. When address 0 is used, the master does not<br />
know the logger address, which facilitates peer-to-peer communications on a bus with<br />
one master and no other slaves. <strong>Flo</strong><strong>Ware</strong> can be used to change the Modbus address<br />
setting in the FL900.<br />
4.1.A.3.1 Communication timeouts<br />
Minimum and maximum response times are used for reliable exchanges with the Modbus<br />
master and to prevent collisions on the RS232 bus. The minimum response time is the<br />
wait time before a reply is sent to a Modbus query (default: 30 ms). The maximum<br />
response time is the total time that is allowed for a reply to be sent to a Modbus query<br />
(default: 1 second).<br />
If a reply cannot be sent within the maximum response time, a timeout occurs. The logger<br />
stops processing and prepares for the next Modbus query. The timeout value cannot be<br />
modified.<br />
4.1.A.3.2 Sleep modes<br />
Sleep modes are used to extend the battery life of the logger. After 5 seconds of idle time<br />
on the RS232 bus, the RS232 interface on the logger closes. To keep the<br />
RS232 interface open, a valid Modbus command must be sent to the logger in intervals of<br />
< 5 seconds.<br />
4.1.A.4<br />
If the RS232 interface is closed, a sacrificial Modbus command must be sent to the logger<br />
to open the interface. This command serves only to open the interface. No response is<br />
made to the sacrificial Modbus command.<br />
If the logger has not shut down at least once in a 3-hour period, a soft reset automatically<br />
occurs.<br />
Modbus registers<br />
The logger program that is set up by the user shows which measurements are associated<br />
with each datalog channel (refer to Datalog setup on page 29). Each datalog channel in<br />
the logger is mapped to a Modbus measurement register. If a new program is written to<br />
the logger, the user-selected measurements are automatically mapped to the 16 available<br />
datalog channels.<br />
Each Modbus measurement register is associated with two Modbus description registers.<br />
The description registers, A and B, add additional details about the measurement value.<br />
Each Modbus measurement register reads data as it is currently logged. For example, if<br />
an attached sensor has a primary logging interval of 5 minutes, the corresponding<br />
Modbus register shows the updated data every 5 minutes.<br />
4.1.A.4.1 Register configuration<br />
<strong>Flo</strong><strong>Ware</strong> is used to generate the Modbus register map from the datalog channel<br />
configuration in the logger program. The register map is generated online when<br />
connected to a logger or offline using a previously downloaded site file. The map can be<br />
52
Device communication<br />
printed, exported to a spreadsheet or copied to the clipboard. If the datalog channel<br />
configuration changes, the modbus map changes, and a new Modbus map should be<br />
generated.<br />
To generate the map, open the FL900 Series driver in <strong>Flo</strong><strong>Ware</strong>, select the Utilities tab<br />
and then select Modbus Map. The Modbus map is shown for the datalog channel<br />
configuration that is current. An example of a Modbus map is shown in Figure 12.<br />
Figure 12 Example Modbus map for logger program<br />
4.1.A.4.2 Register order<br />
The data order in the logger registers is big-endian with the most significant byte first,<br />
followed by the least significant byte second. The register order for multi-register numeric<br />
values (floats and integers) is little endian. If a different ordering scheme is needed, the<br />
data must be processed externally.<br />
4.1.A.4.3 Measurement registers<br />
The logger implements 16 Modbus measurement registers, where each register maps<br />
directly to 1 of 16 data log channels. One or more measurement registers can be read<br />
with Modbus Function Code 03 Read Holding Registers. Refer to Table 4.<br />
The definition of each data log channel is made when a user changes the data log<br />
configuration and programs the logger. To know what each measurement register<br />
represents, the user has two options. The first option is for applications where the logger<br />
is connected to an external device that is manually configured by the user. The second<br />
option is for applications where the logger is connected to an external device that is<br />
53
Device communication<br />
capable of automatic configuration with the use of additional measurement description<br />
registers that are supplied by the logger.<br />
Table 4 Modbus measurement registers<br />
Register Number Data Type Read/Write Name Data Map<br />
40013-40014 4 byte float Read Measurement Register 1 Data Log Channel 1<br />
40015-40016 4 byte float Read Measurement Register 2 Data Log Channel 2<br />
40017-40018 4 byte float Read Measurement Register 3 Data Log Channel 3<br />
40019-40020 4 byte float Read Measurement Register 4 Data Log Channel 4<br />
40021-40022 4 byte float Read Measurement Register 5 Data Log Channel 5<br />
40023-40024 4 byte float Read Measurement Register 6 Data Log Channel 6<br />
40025-40026 4 byte float Read Measurement Register 7 Data Log Channel 7<br />
40027-40028 4 byte float Read Measurement Register 8 Data Log Channel 8<br />
40029-40030 4 byte float Read Measurement Register 9 Data Log Channel 9<br />
40031-40032 4 byte float Read Measurement Register 10 Data Log Channel 10<br />
40033-40034 4 byte float Read Measurement Register 11 Data Log Channel 11<br />
40035-40036 4 byte float Read Measurement Register 12 Data Log Channel 12<br />
40037-40038 4 byte float Read Measurement Register 13 Data Log Channel 13<br />
40039-40040 4 byte float Read Measurement Register 14 Data Log Channel 14<br />
40041-40042 4 byte float Read Measurement Register 15 Data Log Channel 15<br />
40043-40044 4 byte float Read Measurement Register 16 Data Log Channel 16<br />
4.1.A.4.4 Description registers<br />
Two description registers, A and B, are associated with each individual Modbus<br />
measurement register (Table 5). The Modbus description registers allow third parties to<br />
develop external devices that have plug and play capabilities with the FL900 logger and<br />
minimize manual setup by the end user. Each description register can be queried by an<br />
external device to get more details about the measurement value.<br />
54<br />
Table 5 Modbus description registers<br />
Register number Data type Read/Write Name<br />
40213-40214 4-byte Unsigned Read Measurement 1 Description Register. 'A'<br />
40215-40216 4-byte Unsigned Read Measurement 1 Description Register. 'B'<br />
40217-40218 4-byte Unsigned Read Measurement 2 Description Register. 'A'<br />
40219-40220 4-byte Unsigned Read Measurement 2 Description Register. 'B'<br />
40221-40222 4-byte Unsigned Read Measurement 3 Description Register. 'A'<br />
40223-40224 4-byte Unsigned Read Measurement 3 Description Register. 'B'<br />
40225-40226 4-byte Unsigned Read Measurement 4 Description Register. 'A'<br />
40227-40228 4-byte Unsigned Read Measurement 4 Description Register. 'B'<br />
40229-40230 4-byte Unsigned Read Measurement 5 Description Register. 'A'<br />
40231-40232 4-byte Unsigned Read Measurement 5 Description Register. 'B'<br />
40233-40234 4-byte Unsigned Read Measurement 6 Description Register. 'A'<br />
40235-40236 4-byte Unsigned Read Measurement 6 Description Register. 'B'<br />
40237-40238 4-byte Unsigned Read Measurement 7 Description Register. 'A'
Device communication<br />
Table 5 Modbus description registers (continued)<br />
Register number Data type Read/Write Name<br />
40239-40240 4-byte Unsigned Read Measurement 7 Description Register. 'B'<br />
40241-40242 4-byte Unsigned Read Measurement 8 Description Register. 'A'<br />
40243-40244 4-byte Unsigned Read Measurement 8 Description Register. 'B'<br />
40245-40246 4-byte Unsigned Read Measurement 9 Description Register. 'A'<br />
40247-40248 4-byte Unsigned Read Measurement 9 Description Register. 'B'<br />
40249-40250 4-byte Unsigned Read Measurement 10 Description Register. 'A'<br />
40251-40252 4-byte Unsigned Read Measurement 10 Description Register. 'B'<br />
40253-40254 4-byte Unsigned Read Measurement 11 Description Register. 'A'<br />
40255-40256 4-byte Unsigned Read Measurement 11 Description Register. 'B'<br />
40257-40258 4-byte Unsigned Read Measurement 12 Description Register. 'A'<br />
40259-40260 4-byte Unsigned Read Measurement 12 Description Register. 'B'<br />
40261-40262 4-byte Unsigned Read Measurement 13 Description Register. 'A'<br />
40263-40264 4-byte Unsigned Read Measurement 13 Description Register. 'B'<br />
40265-40266 4-byte Unsigned Read Measurement 14 Description Register. 'A'<br />
40267-40268 4-byte Unsigned Read Measurement 14 Description Register. 'B'<br />
40269-40270 4-byte Unsigned Read Measurement 15 Description Register. 'A'<br />
40271-40272 4-byte Unsigned Read Measurement 15 Description Register. 'B'<br />
40273-40274 4-byte Unsigned Read Measurement 16 Description Register. 'A'<br />
40275-40276 4-byte Unsigned Read Measurement 16 Description Register. 'B'<br />
4.1.A.4.4.1 Description register formats<br />
Two formats, A and B, are used by the description registers to give measurement details.<br />
Refer to Figure 13 and Figure 14.<br />
Figure 13 Description register format A<br />
Figure 14 Description register format B<br />
4.1.A.4.4.2 Parameter field<br />
The parameter field shows what the measurement represents (Table 6).<br />
Returned value<br />
Table 6 Parameter field descriptions<br />
Parameter<br />
0 FL900 series power supply<br />
1 Modem signal strength<br />
2 Modem signal quality<br />
3 <strong>Flo</strong>w<br />
4 Level<br />
55
Device communication<br />
Returned value<br />
Table 6 Parameter field descriptions (continued)<br />
Parameter<br />
5 Velocity<br />
6 Temperature<br />
7 Surface velocity<br />
8 Distance<br />
9 Minimum distance<br />
10 Maximum distance<br />
11 Distance reading Count<br />
12 Surcharge level<br />
13 PMR<br />
14 NOS<br />
15 Conductivity<br />
16 Surcharge velocity<br />
17 Gain<br />
18 Measurement Flag<br />
19 Rain<br />
20 Raw level<br />
21 pH/ORP<br />
22 Channel 1<br />
23 Channel 2<br />
24 Channel 3<br />
25 Channel 4<br />
26 Channel 5<br />
27 Channel 6<br />
28 Channel 7<br />
29 Best scale<br />
30 Bins<br />
4.1.A.4.4.3 Sensor type field<br />
The sensor type field shows the type of sensor that made the measurement (Table 7).<br />
Returned value<br />
Table 7 Sensor type field description<br />
Sensor type<br />
1 Not detected<br />
3 Logger<br />
4 <strong>Flo</strong>Dar<br />
5 <strong>Flo</strong>Tote<br />
6 SVS<br />
7 AV9000<br />
56
Device communication<br />
Table 7 Sensor type field description (continued)<br />
Returned value<br />
Sensor type<br />
8 IM9001<br />
9 US900X<br />
4.1.A.4.4.4 Data source field<br />
The data source field shows whether the measurement came directly from the logger or<br />
from one of the sensor ports on the logger (Table 8).<br />
Table 8 Data source field description<br />
Returned value<br />
Data source<br />
0 Logger<br />
1 Sensor Port 1<br />
2 Sensor Port 2<br />
3 Sensor Port 3<br />
4 Sensor Port 4<br />
4.1.A.4.4.5 Log interval fields<br />
The primary, secondary and current logging interval fields can be queried to show which<br />
logging interval is in use. An external device can use this information to optimize the<br />
polling interval. The log interval values are returned in minutes.<br />
Dynamic logging occurs with the primary and secondary logging intervals. The primary<br />
logging interval is used during normal operation. If an alarm condition occurs, the log rate<br />
automatically changes to use the secondary logging interval. When operation returns to<br />
normal, the log rate automatically changes to use the primary logging interval again. For<br />
more information refer to Set up alarms on page 45.<br />
4.1.A.4.4.6 Base unit field<br />
The base unit field shows the base unit of measure for the measurement regardless of<br />
the selected user preference. Table 9 includes units that may not be applicable at this<br />
time.<br />
Table 9 Base unit field description<br />
Returned value<br />
Unit of measure<br />
0 mg/L (milligrams per liter)<br />
1 g/L (grams per liter)<br />
2 ppm (parts per million)<br />
3 mE (milliextinction)<br />
4 E (extinction)<br />
5 1/m (per meter)<br />
6 FNU (formazin nephelometric unit)<br />
7 NTU (nephelometric turbidity unit)<br />
8 TE/F (German formazin nephelometric unit)<br />
9 EBC (European brewery congress)<br />
10 % (percent)<br />
11 nm (nanometer)<br />
12 mm (millimeter)<br />
57
Device communication<br />
Table 9 Base unit field description (continued)<br />
Returned value Unit of measure<br />
13 m (meter)<br />
14 msec (milliseconds)<br />
15 sec (seconds)<br />
16 min (minutes)<br />
17 hrs (hours)<br />
18 mA (milliamps)<br />
19 mV (millivolts)<br />
20 mNTU (milliNTU)<br />
21 mFTU (milliFTU)<br />
22 mTE/F (milliTE/F)<br />
23 m % (millipercent)<br />
24 Counts<br />
25 C (degrees Celsius)<br />
26 F (degrees Fahrenheit)<br />
27 pH<br />
28 mV/pH (millivolts per pH unit)<br />
29 uA (microamperes)<br />
30 L/h (liters per hour)<br />
31 ppt (parts per thousand)<br />
32 S/cm (Siemens per centimeter)<br />
33 Ohm/cm (ohms per centimeter)<br />
34 S/m (Siemens per meter)<br />
35 Ohm/m (ohms per meter)<br />
36 kOhm (kiloohm)<br />
37 MOhm (megaohm)<br />
38 ppb (parts per billion)<br />
39 ug/L (micrograms per liter)<br />
40 sat (saturation)<br />
41 mFNU (milliFNU)<br />
42 FTU (formazin turbidity unit)<br />
43 ft (feet)<br />
44 deg (degrees angle or phase)<br />
45 mmHg (millimeters of mercury)<br />
46 inHg (inches of mercury)<br />
47 torr<br />
48 pH/C (pH per degree C)<br />
49 day (day)<br />
58
Device communication<br />
Table 9 Base unit field description (continued)<br />
Returned value Unit of measure<br />
50 uS/cm (microSiemens per centimeter)<br />
51 mS/cm (milliSiemens per centimeter)<br />
52 Ohm<br />
53 %/C (percent per degree C)<br />
54 ppm/uS (ppm per uS )<br />
55 mMol/L (millimole per liter)<br />
56 kOhm/cm (kiloohm per centimeter)<br />
57 MOhm/cm (mega ohm per centimeter)<br />
58 mS/m (milliSiemens per meter)<br />
59 uS/m (microSiemens per meter)<br />
60 degree<br />
61 BAR (bar)<br />
62 kPa<br />
63 Pa<br />
64 psi (pressure per square inch)<br />
65 psia<br />
66 psig<br />
67 gpm (gallons per minute)<br />
68 gps (gallons per second)<br />
69 gph (gallons per hour)<br />
70 mgd (million gallons per day)<br />
71 Lps (liters per second)<br />
72 Lpm (liters per minute)<br />
73 Lph (liters per hour)<br />
74 m 3 /sec (cubic meters per second)<br />
75 ft 3 /sec (cubic feet per second)<br />
76 m/s (meters per second)<br />
77 fps (feet per second)<br />
78 cm (centimeters)<br />
79 ft (feet)<br />
80 in. (inches)<br />
81 m (meters)<br />
82 volts<br />
83 AU (Absorbtion unit)<br />
84 nA (nanoampere)<br />
85 nA/ppm (nanoampere per ppm)<br />
86 uA/ppm (microampere per ppm)<br />
59
Device communication<br />
Table 9 Base unit field description (continued)<br />
Returned value Unit of measure<br />
87 nA/mg (nanoampere per mg)<br />
88 uA/mg (microampere per mg)<br />
89 Sal (salinity)<br />
90 gal (gallons)<br />
91 ltr (liters)<br />
92 %[1cm] (% transmission in 1-cm path)<br />
93 m 3 /h (cubic meters per hour)<br />
94 gpd (gallons per day)<br />
95 mL (milliliters)<br />
96 af (acre feet)<br />
97 cf (cubic feet)<br />
98 m 3 (cubic meters)<br />
99 cm 2 (square centimeters)<br />
100 ft 2 (square feet)<br />
101 in 2 (square inches)<br />
102 m 2 (square meters)<br />
103 afd (acre feet per day)<br />
104 cfm (cubic feet per minute)<br />
105 cfh (cubic feet per hour)<br />
106 cfd (cubic feet per day)<br />
107 cmm (cubic meters per minute)<br />
108 cmd (cubic meters per day)<br />
109 g/kg (grams per kilogram)<br />
110 mils (1/1000 inch)<br />
111 %H 2 S<br />
112 %LEL<br />
113 VDC<br />
114 no unit<br />
115 Hz (Hertz)<br />
116 kHz (kiloHertz)<br />
117 mL/L (milliliters per liter)<br />
118 mL/g (milliliters per gram)<br />
119 MHz (megaHertz)<br />
120 ft 3 /min (cubic feet per minute)<br />
121 ft 3 /h (cubic feet per hour)<br />
122 m 3 /min (cubic meters per minute)<br />
123 m 3 /day (cubic meters per day)<br />
60
Device communication<br />
Table 9 Base unit field description (continued)<br />
Returned value Unit of measure<br />
124 L/day (liters per day)<br />
125 af/h (acre-feet per hour)<br />
126 mL/day (milliliters per day)<br />
127 mg/L-N (milligrams per liter as Nitrogen)<br />
128 K (degrees Kelvin)<br />
129 %660nm (transmission percent at 660 nm)<br />
130 v660nm (transmission voltage at 660 nm)<br />
132 mS (milliSiemens)<br />
133 uS (microSiemens)<br />
134 %O 2 (percent oxygen)<br />
135 uE/S/m 2<br />
136 Kg/L<br />
137 ft 3 /day<br />
138 ft 3<br />
139 mg (million gallons)<br />
140 cfs (cubic feet per second)<br />
141 cms (cubic meters per second)<br />
142 cmh (cubic meters per hour)<br />
143 Unknown<br />
61
Device communication<br />
62
U.S. and countries other than EU<br />
HACH COMPANY<br />
P.O. Box 389, Loveland, CO 80539-0389 U.S.A.<br />
Tel. (970) 622-7120<br />
Tel. (800) 368-2723<br />
Fax (970) 619-5150<br />
hachflowsales@hach.com<br />
www.hachflow.com<br />
Marsh-McBirney and Sigma <strong>Flo</strong>w<br />
Products (except Sigma <strong>Flo</strong>w<br />
Products in France and the UK)<br />
FLOWTRONIC, SA.<br />
Rue J.H. Cool 19a<br />
B-4840 Welkenraedt, Belgium<br />
Tel. +32 (0) 87 899 799<br />
Fax +32 (0) 87 899 790<br />
www.flow-tronic.com<br />
France and UK<br />
(Sigma <strong>Flo</strong>w Products Only)<br />
HACH LANGE GmbH<br />
Willstätterstraße 11<br />
D-40549 Düsseldorf, Germany<br />
Tel. +49 (0) 211 5288-0<br />
Fax +49 (0) 211 5288-143<br />
E-mail: info@hach-lange.de<br />
www.hach-lange.com<br />
© Hach Company, 2011, 2013. All rights reserved. Printed in U.S.A.