Flo-Ware Manual - Hachflow
Flo-Ware Manual - Hachflow
Flo-Ware Manual - Hachflow

Create successful ePaper yourself
Turn your PDF publications into a flip-book with our unique Google optimized e-Paper software.
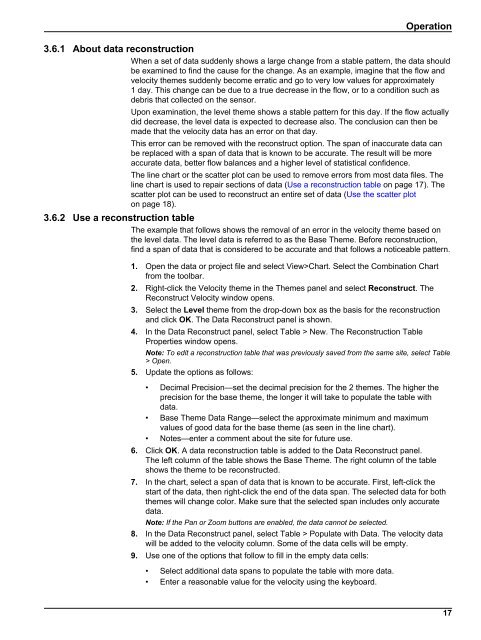
3.6.1 About data reconstruction<br />
When a set of data suddenly shows a large change from a stable pattern, the data should<br />
be examined to find the cause for the change. As an example, imagine that the flow and<br />
velocity themes suddenly become erratic and go to very low values for approximately<br />
1 day. This change can be due to a true decrease in the flow, or to a condition such as<br />
debris that collected on the sensor.<br />
Upon examination, the level theme shows a stable pattern for this day. If the flow actually<br />
did decrease, the level data is expected to decrease also. The conclusion can then be<br />
made that the velocity data has an error on that day.<br />
This error can be removed with the reconstruct option. The span of inaccurate data can<br />
be replaced with a span of data that is known to be accurate. The result will be more<br />
accurate data, better flow balances and a higher level of statistical confidence.<br />
The line chart or the scatter plot can be used to remove errors from most data files. The<br />
line chart is used to repair sections of data (Use a reconstruction table on page 17). The<br />
scatter plot can be used to reconstruct an entire set of data (Use the scatter plot<br />
on page 18).<br />
3.6.2 Use a reconstruction table<br />
The example that follows shows the removal of an error in the velocity theme based on<br />
the level data. The level data is referred to as the Base Theme. Before reconstruction,<br />
find a span of data that is considered to be accurate and that follows a noticeable pattern.<br />
1. Open the data or project file and select View>Chart. Select the Combination Chart<br />
from the toolbar.<br />
2. Right-click the Velocity theme in the Themes panel and select Reconstruct. The<br />
Reconstruct Velocity window opens.<br />
3. Select the Level theme from the drop-down box as the basis for the reconstruction<br />
and click OK. The Data Reconstruct panel is shown.<br />
4. In the Data Reconstruct panel, select Table > New. The Reconstruction Table<br />
Properties window opens.<br />
Note: To edit a reconstruction table that was previously saved from the same site, select Table<br />
> Open.<br />
5. Update the options as follows:<br />
• Decimal Precision—set the decimal precision for the 2 themes. The higher the<br />
precision for the base theme, the longer it will take to populate the table with<br />
data.<br />
• Base Theme Data Range—select the approximate minimum and maximum<br />
values of good data for the base theme (as seen in the line chart).<br />
• Notes—enter a comment about the site for future use.<br />
6. Click OK. A data reconstruction table is added to the Data Reconstruct panel.<br />
The left column of the table shows the Base Theme. The right column of the table<br />
shows the theme to be reconstructed.<br />
7. In the chart, select a span of data that is known to be accurate. First, left-click the<br />
start of the data, then right-click the end of the data span. The selected data for both<br />
themes will change color. Make sure that the selected span includes only accurate<br />
data.<br />
Note: If the Pan or Zoom buttons are enabled, the data cannot be selected.<br />
8. In the Data Reconstruct panel, select Table > Populate with Data. The velocity data<br />
will be added to the velocity column. Some of the data cells will be empty.<br />
9. Use one of the options that follow to fill in the empty data cells:<br />
• Select additional data spans to populate the table with more data.<br />
• Enter a reasonable value for the velocity using the keyboard.<br />
Operation<br />
17