FH950 User Manual English - Hachflow
FH950 User Manual English - Hachflow
FH950 User Manual English - Hachflow
You also want an ePaper? Increase the reach of your titles
YUMPU automatically turns print PDFs into web optimized ePapers that Google loves.
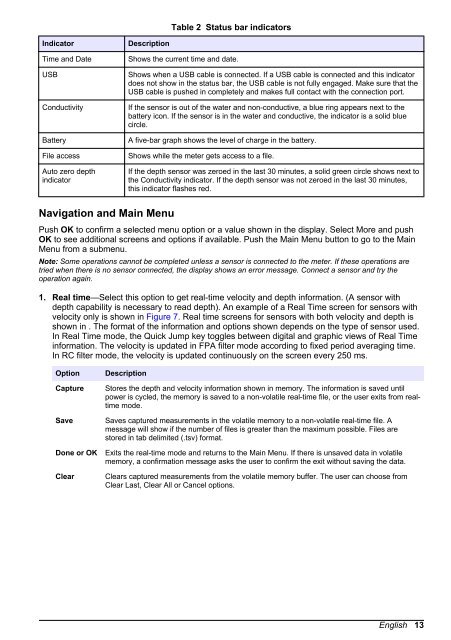
Table 2 Status bar indicators<br />
Indicator<br />
Time and Date<br />
USB<br />
Conductivity<br />
Battery<br />
File access<br />
Auto zero depth<br />
indicator<br />
Description<br />
Shows the current time and date.<br />
Shows when a USB cable is connected. If a USB cable is connected and this indicator<br />
does not show in the status bar, the USB cable is not fully engaged. Make sure that the<br />
USB cable is pushed in completely and makes full contact with the connection port.<br />
If the sensor is out of the water and non-conductive, a blue ring appears next to the<br />
battery icon. If the sensor is in the water and conductive, the indicator is a solid blue<br />
circle.<br />
A five-bar graph shows the level of charge in the battery.<br />
Shows while the meter gets access to a file.<br />
If the depth sensor was zeroed in the last 30 minutes, a solid green circle shows next to<br />
the Conductivity indicator. If the depth sensor was not zeroed in the last 30 minutes,<br />
this indicator flashes red.<br />
Navigation and Main Menu<br />
Push OK to confirm a selected menu option or a value shown in the display. Select More and push<br />
OK to see additional screens and options if available. Push the Main Menu button to go to the Main<br />
Menu from a submenu.<br />
Note: Some operations cannot be completed unless a sensor is connected to the meter. If these operations are<br />
tried when there is no sensor connected, the display shows an error message. Connect a sensor and try the<br />
operation again.<br />
1. Real time—Select this option to get real-time velocity and depth information. (A sensor with<br />
depth capability is necessary to read depth). An example of a Real Time screen for sensors with<br />
velocity only is shown in Figure 7. Real time screens for sensors with both velocity and depth is<br />
shown in . The format of the information and options shown depends on the type of sensor used.<br />
In Real Time mode, the Quick Jump key toggles between digital and graphic views of Real Time<br />
information. The velocity is updated in FPA filter mode according to fixed period averaging time.<br />
In RC filter mode, the velocity is updated continuously on the screen every 250 ms.<br />
Option<br />
Capture<br />
Save<br />
Done or OK<br />
Clear<br />
Description<br />
Stores the depth and velocity information shown in memory. The information is saved until<br />
power is cycled, the memory is saved to a non-volatile real-time file, or the user exits from realtime<br />
mode.<br />
Saves captured measurements in the volatile memory to a non-volatile real-time file. A<br />
message will show if the number of files is greater than the maximum possible. Files are<br />
stored in tab delimited (.tsv) format.<br />
Exits the real-time mode and returns to the Main Menu. If there is unsaved data in volatile<br />
memory, a confirmation message asks the user to confirm the exit without saving the data.<br />
Clears captured measurements from the volatile memory buffer. The user can choose from<br />
Clear Last, Clear All or Cancel options.<br />
<strong>English</strong> 13


