Getting Real 5 - Media Development Corporation
Getting Real 5 - Media Development Corporation
Getting Real 5 - Media Development Corporation

Create successful ePaper yourself
Turn your PDF publications into a flip-book with our unique Google optimized e-Paper software.
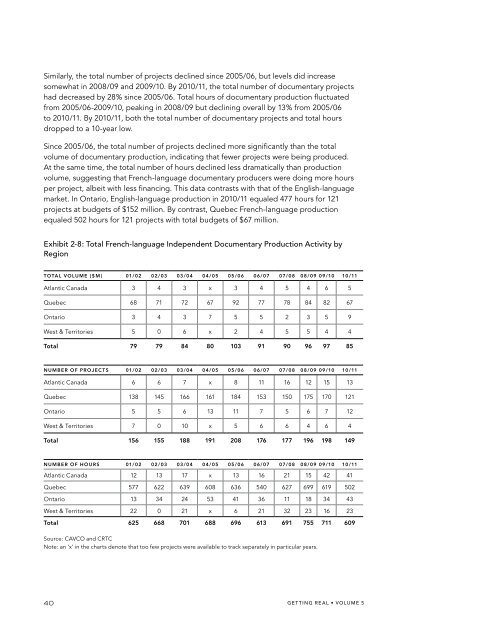
Similarly, the total number of projects declined since 2005/06, but levels did increase<br />
somewhat in 2008/09 and 2009/10. By 2010/11, the total number of documentary projects<br />
had decreased by 28% since 2005/06. Total hours of documentary production fluctuated<br />
from 2005/06-2009/10, peaking in 2008/09 but declining overall by 13% from 2005/06<br />
to 2010/11. By 2010/11, both the total number of documentary projects and total hours<br />
dropped to a 10-year low.<br />
Since 2005/06, the total number of projects declined more significantly than the total<br />
volume of documentary production, indicating that fewer projects were being produced.<br />
At the same time, the total number of hours declined less dramatically than production<br />
volume, suggesting that French-language documentary producers were doing more hours<br />
per project, albeit with less financing. This data contrasts with that of the English-language<br />
market. In Ontario, English-language production in 2010/11 equaled 477 hours for 121<br />
projects at budgets of $152 million. By contrast, Quebec French-language production<br />
equaled 502 hours for 121 projects with total budgets of $67 million.<br />
Exhibit 2-8: Total French-language Independent Documentary Production Activity by<br />
Region<br />
Total Volume ($M) 01/02 02/03 03/04 04/05 05/06 06/07 07/08 08/09 09/10 10/11<br />
Atlantic Canada 3 4 3 x 3 4 5 4 6 5<br />
Quebec 68 71 72 67 92 77 78 84 82 67<br />
Ontario 3 4 3 7 5 5 2 3 5 9<br />
West & Territories 5 0 6 x 2 4 5 5 4 4<br />
Total 79 79 84 80 103 91 90 96 97 85<br />
Number of Projects 01/02 02/03 03/04 04/05 05/06 06/07 07/08 08/09 09/10 10/11<br />
Atlantic Canada 6 6 7 x 8 11 16 12 15 13<br />
Quebec 138 145 166 161 184 153 150 175 170 121<br />
Ontario 5 5 6 13 11 7 5 6 7 12<br />
West & Territories 7 0 10 x 5 6 6 4 6 4<br />
Total 156 155 188 191 208 176 177 196 198 149<br />
Number of Hours 01/02 02/03 03/04 04/05 05/06 06/07 07/08 08/09 09/10 10/11<br />
Atlantic Canada 12 13 17 x 13 16 21 15 42 41<br />
Quebec 577 622 639 608 636 540 627 699 619 502<br />
Ontario 13 34 24 53 41 36 11 18 34 43<br />
West & Territories 22 0 21 x 6 21 32 23 16 23<br />
Total 625 668 701 688 696 613 691 755 711 609<br />
Source: CAVCO and CRTC<br />
Note: an ‘x’ in the charts denote that too few projects were available to track separately in particular years.<br />
40<br />
GETTING REAL • VOLUME 5