Diffusion Manual Outline
Diffusion Manual Outline
Diffusion Manual Outline

Create successful ePaper yourself
Turn your PDF publications into a flip-book with our unique Google optimized e-Paper software.
13<br />
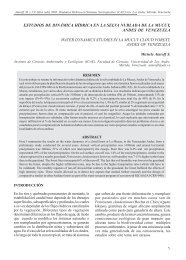
Section 3.3:<br />
DOSY Data Analysis using ILT<br />
Figure 3.1 A comparison of the Fourier transform where the FID in the time domain is converted to an<br />
NMR experiment in the frequency domain versus the inverse Laplace transform which converts the<br />
attenuation of signal at a specific chemical shift to a distribution of diffusion coefficients.<br />
After the DOSY data has been acquired you must process it by typing xf2 on the<br />
command line. It might be necessary to apply a phase correction to the data. You should<br />
observe that the intensity of the signal amplitude decreases with increasing gradient<br />
strength.<br />
You can obtain the inverse Laplace transform (ILT) of the attenuation in signal intensity<br />
by using the Bruker ILT program.<br />
1. Type ilt on the command line. The following screen will appear.