اÙÙتائج اÙÙÙائÙØ© ÙÙتعداد ÙÙ Ùطاع غزة Ù Ùخص - Palestinian Central ...
اÙÙتائج اÙÙÙائÙØ© ÙÙتعداد ÙÙ Ùطاع غزة Ù Ùخص - Palestinian Central ...
اÙÙتائج اÙÙÙائÙØ© ÙÙتعداد ÙÙ Ùطاع غزة Ù Ùخص - Palestinian Central ...

You also want an ePaper? Increase the reach of your titles
YUMPU automatically turns print PDFs into web optimized ePapers that Google loves.
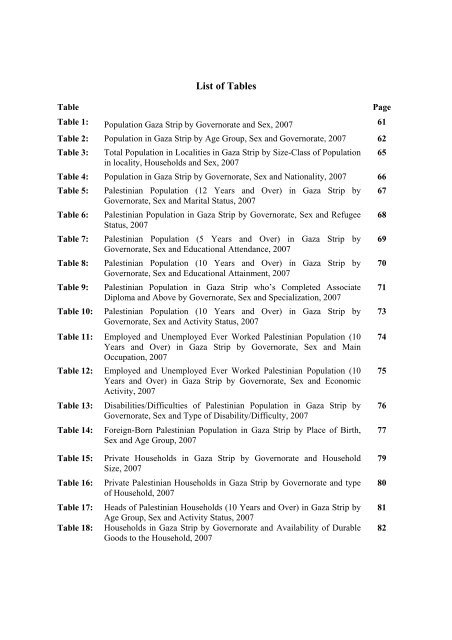
List of Tables<br />
Table<br />
Page<br />
Table 1: Population Gaza Strip by Governorate and Sex, 2007 61<br />
Table 2: Population in Gaza Strip by Age Group, Sex and Governorate, 2007 62<br />
Table 3: Total Population in Localities in Gaza Strip by Size-Class of Population 65<br />
in locality, Households and Sex, 2007<br />
Table 4: Population in Gaza Strip by Governorate, Sex and Nationality, 2007 66<br />
Table 5: <strong>Palestinian</strong> Population (12 Years and Over) in Gaza Strip by 67<br />
Governorate, Sex and Marital Status, 2007<br />
Table 6: <strong>Palestinian</strong> Population in Gaza Strip by Governorate, Sex and Refugee 68<br />
Status, 2007<br />
Table 7: <strong>Palestinian</strong> Population (5 Years and Over) in Gaza Strip by 69<br />
Governorate, Sex and Educational Attendance, 2007<br />
Table 8: <strong>Palestinian</strong> Population (10 Years and Over) in Gaza Strip by 70<br />
Governorate, Sex and Educational Attainment, 2007<br />
Table 9: <strong>Palestinian</strong> Population in Gaza Strip who’s Completed Associate 71<br />
Diploma and Above by Governorate, Sex and Specialization, 2007<br />
Table 10: <strong>Palestinian</strong> Population (10 Years and Over) in Gaza Strip by<br />
Governorate, Sex and Activity Status, 2007<br />
73<br />
Table 11: Employed and Unemployed Ever Worked <strong>Palestinian</strong> Population (10<br />
Years and Over) in Gaza Strip by Governorate, Sex and Main<br />
Occupation, 2007<br />
Table 12: Employed and Unemployed Ever Worked <strong>Palestinian</strong> Population (10<br />
Years and Over) in Gaza Strip by Governorate, Sex and Economic<br />
Activity, 2007<br />
Table 13:<br />
Table 14:<br />
Disabilities/Difficulties of <strong>Palestinian</strong> Population in Gaza Strip by<br />
Governorate, Sex and Type of Disability/Difficulty, 2007<br />
Foreign-Born <strong>Palestinian</strong> Population in Gaza Strip by Place of Birth,<br />
Sex and Age Group, 2007<br />
74<br />
75<br />
76<br />
77<br />
Table 15:<br />
Table 16:<br />
Table 17:<br />
Table 18:<br />
Private Households in Gaza Strip by Governorate and Household<br />
Size, 2007<br />
Private <strong>Palestinian</strong> Households in Gaza Strip by Governorate and type<br />
of Household, 2007<br />
Heads of <strong>Palestinian</strong> Households (10 Years and Over) in Gaza Strip by<br />
Age Group, Sex and Activity Status, 2007<br />
Households in Gaza Strip by Governorate and Availability of Durable<br />
Goods to the Household, 2007<br />
79<br />
80<br />
81<br />
82