اÙÙتائج اÙÙÙائÙØ© ÙÙتعداد ÙÙ Ùطاع غزة Ù Ùخص - Palestinian Central ...
اÙÙتائج اÙÙÙائÙØ© ÙÙتعداد ÙÙ Ùطاع غزة Ù Ùخص - Palestinian Central ...
اÙÙتائج اÙÙÙائÙØ© ÙÙتعداد ÙÙ Ùطاع غزة Ù Ùخص - Palestinian Central ...

You also want an ePaper? Increase the reach of your titles
YUMPU automatically turns print PDFs into web optimized ePapers that Google loves.
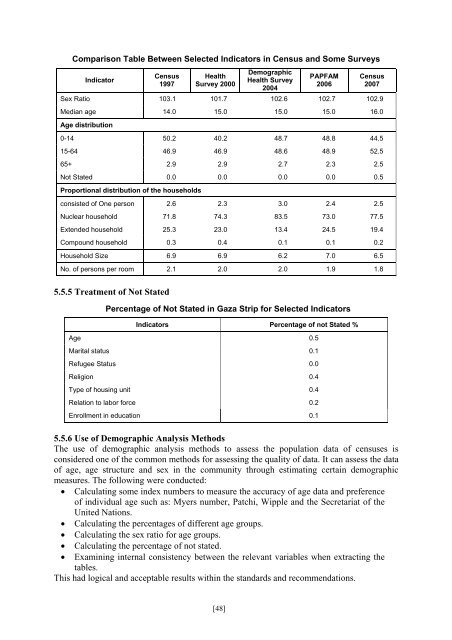
Comparison Table Between Selected Indicators in Census and Some Surveys<br />
Indicator<br />
Census<br />
1997<br />
Health<br />
Survey 2000<br />
Demographic<br />
Health Survey<br />
2004<br />
PAPFAM<br />
2006<br />
Census<br />
2007<br />
Sex Ratio 103.1 101.7 102.6 102.7 102.9<br />
Median age 14.0 15.0 15.0 15.0 16.0<br />
Age distribution<br />
0-14 50.2 40.2 48.7 48.8 44.5<br />
15-64 46.9 46.9 48.6 48.9 52.5<br />
65+ 2.9 2.9 2.7 2.3 2.5<br />
Not Stated 0.0 0.0 0.0 0.0 0.5<br />
Proportional distribution of the households<br />
consisted of One person 2.6 2.3 3.0 2.4 2.5<br />
Nuclear household 71.8 74.3 83.5 73.0 77.5<br />
Extended household 25.3 23.0 13.4 24.5 19.4<br />
Compound household 0.3 0.4 0.1 0.1 0.2<br />
Household Size 6.9 6.9 6.2 7.0 6.5<br />
No. of persons per room 2.1 2.0 2.0 1.9 1.8<br />
5.5.5 Treatment of Not Stated<br />
Percentage of Not Stated in Gaza Strip for Selected Indicators<br />
Indicators<br />
Age<br />
Marital status<br />
Refugee Status<br />
Religion<br />
Type of housing unit<br />
Relation to labor force<br />
Enrollment in education<br />
Percentage of not Stated %<br />
0.5<br />
0.1<br />
0.0<br />
0.4<br />
0.4<br />
0.2<br />
0.1<br />
5.5.6 Use of Demographic Analysis Methods<br />
The use of demographic analysis methods to assess the population data of censuses is<br />
considered one of the common methods for assessing the quality of data. It can assess the data<br />
of age, age structure and sex in the community through estimating certain demographic<br />
measures. The following were conducted:<br />
• Calculating some index numbers to measure the accuracy of age data and preference<br />
of individual age such as: Myers number, Patchi, Wipple and the Secretariat of the<br />
United Nations.<br />
• Calculating the percentages of different age groups.<br />
• Calculating the sex ratio for age groups.<br />
• Calculating the percentage of not stated.<br />
• Examining internal consistency between the relevant variables when extracting the<br />
tables.<br />
This had logical and acceptable results within the standards and recommendations.<br />
[48]