Barnstable County High Crash Locations - Cape Cod Commission
Barnstable County High Crash Locations - Cape Cod Commission
Barnstable County High Crash Locations - Cape Cod Commission

You also want an ePaper? Increase the reach of your titles
YUMPU automatically turns print PDFs into web optimized ePapers that Google loves.
<strong>Barnstable</strong> <strong>County</strong> <strong>High</strong> <strong>Crash</strong><br />
<strong>Locations</strong><br />
July 2010<br />
Updated March 2012
Prepared by CAPE COD COMMISSION Transportation Staff<br />
on behalf of the<br />
CAPE COD METROPOLITAN PLANNING ORGANIZATION:<br />
Massachusetts Department of Transportation<br />
<strong>Cape</strong> <strong>Cod</strong> Regional Transit Authority • <strong>Cape</strong> <strong>Cod</strong> <strong>Commission</strong><br />
<strong>Barnstable</strong> <strong>County</strong> • Town of <strong>Barnstable</strong><br />
Towns of Bourne, Sandwich, Falmouth & Mashpee<br />
Towns of Yarmouth, Dennis, Harwich, Brewster & Chatham<br />
Towns of Orleans, Eastham, Wellfleet, Truro & Provincetown<br />
This report was funded in part through grants from the Federal <strong>High</strong>way Administration and Federal Transit<br />
Administration, United States Department of Transportation (USDOT). The views and opinions of the <strong>Cape</strong> <strong>Cod</strong><br />
Metropolitan Planning Organization expressed herein do not necessarily state or reflect those of the USDOT
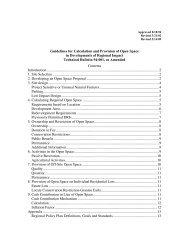
Table of Contents<br />
Introduction ........................................................................................ 1<br />
Goals and Objectives .................................................................................. 1<br />
Top <strong>Crash</strong> Lists .......................................................................................... 1<br />
Data Source ............................................................................................... 2<br />
MassDOT Data ...................................................................................... 2<br />
Local Data ............................................................................................. 2<br />
Data Analyzed ........................................................................................... 3<br />
MassDOT Data ...................................................................................... 3<br />
Local Data ............................................................................................. 4<br />
Analysis .............................................................................................. 5<br />
Top <strong>Crash</strong> Lists .......................................................................................... 5<br />
Top <strong>Locations</strong> based on Number of <strong>Crash</strong>es ........................................ 5<br />
Top <strong>Locations</strong> based on Equivalent Property Damage Only ................ 5<br />
Top <strong>Locations</strong> based on <strong>Crash</strong> Rate ...................................................... 5<br />
Top <strong>Locations</strong> based on EPDO Rate .................................................... 6<br />
Traffic Volume Data ................................................................................... 7<br />
<strong>Cape</strong> <strong>Cod</strong> <strong>Commission</strong> Traffic Counting Program ................................ 7<br />
<strong>Cape</strong> <strong>Cod</strong> Regional Model ...................................................................... 7<br />
Trip Generation Handbook ................................................................... 7<br />
Entering Volume Calculation ............................................................... 8<br />
Limitations .......................................................................................... 9<br />
State Data Collection ................................................................................ 9<br />
<strong>Barnstable</strong> <strong>County</strong> <strong>High</strong> <strong>Crash</strong> <strong>Locations</strong><br />
Page i
Local <strong>Crash</strong> Data ...................................................................................... 10<br />
<strong>High</strong> <strong>Crash</strong> Location Lists ................................................................... 11<br />
Top <strong>Locations</strong> Based on Number of <strong>Crash</strong>es .......................................... 12<br />
Top <strong>Locations</strong> Based on Equivalent Property Damage Only ................. 13<br />
Top <strong>Locations</strong> Based on <strong>Crash</strong> Rate ....................................................... 14<br />
Top <strong>Locations</strong> Based on EPDO Rate ....................................................... 15<br />
Index of Intersection Notes ..................................................................... 16<br />
Bicycle and Pedestrian <strong>Crash</strong>es .......................................................... 18<br />
MassDOT Data ......................................................................................... 18<br />
Bicycle and Pedestrian <strong>Crash</strong> Clusters ................................................... 19<br />
Fatal <strong>Crash</strong> Database ......................................................................... 21<br />
Summary .......................................................................................... 24<br />
List of Figures<br />
Figure 1: <strong>Barnstable</strong> <strong>County</strong> Located <strong>Crash</strong>es, 2006-2008 ......................... 4<br />
Figure 2: Bicycle/Pedestrian crashes, 2002-2008 .................................... 18<br />
Figure 3: <strong>Barnstable</strong> <strong>County</strong> Fatal <strong>Crash</strong>es, 2007-2010* .......................... 22<br />
List of Tables<br />
Table 1: Index of Intersection Notes ........................................................... 16<br />
Table 2: <strong>Barnstable</strong> <strong>County</strong> Pedestrian <strong>Crash</strong> Clusters, 2002-2008 ........ 19<br />
Table 3: <strong>Barnstable</strong> <strong>County</strong> Bicycle <strong>Crash</strong> Clusters, 2002-2008 ............. 20<br />
Table 4: Fatal <strong>Crash</strong>es by Town, 2007-2010 .............................................. 21<br />
Page ii<br />
<strong>Barnstable</strong> <strong>County</strong> <strong>High</strong> <strong>Crash</strong> <strong>Locations</strong>
Introduction<br />
GOALS AND OBJECTIVES<br />
This report is the result of the <strong>Cape</strong> <strong>Cod</strong> <strong>Commission</strong>’s effort to identify<br />
the most dangerous intersections in <strong>Barnstable</strong> <strong>County</strong>. The data used for<br />
this endeavor, including crashes that occurred in 2006, 2007, or 2008,<br />
are the most recent available from the Massachusetts Department and<br />
Transportation (MassDOT) and local police departments from <strong>Barnstable</strong><br />
<strong>County</strong>.<br />
Through the analysis of our data, a series of top crash location lists have<br />
been generated. The lists will assist in directing federal, state, and local<br />
funds towards improving intersections that pose the highest safety risk to<br />
its users. It is anticipated that this information will be useful to local<br />
police departments who have the resources and ability to reduce speed<br />
and unsafe driving through enforcement. It is the <strong>Commission</strong>’s hope that<br />
this document will highlight the need for accurate and comprehensive<br />
reporting between the fifteen <strong>Barnstable</strong> <strong>County</strong> towns and state agencies.<br />
Beyond serving as support for improvement funds, this report will also<br />
help focus future safety studies on the locations with most need.<br />
TOP CRASH LISTS<br />
There are several methodologies that can be used to generate a list of top<br />
crash locations for a given geographic area. Two common methods<br />
include sorting by total crashes that occurred during a specified time in<br />
history and sorting by crashes per one million entering vehicles (also<br />
known as a crash rate). Two other frequently used methods involve<br />
weighting each crash according to its severity (whether it included an<br />
injury or fatality). Each method has advantages and disadvantages. Using<br />
total crash numbers or a crash rate is simpler, and needs less information<br />
to use. Using crash severity can be helpful to highlight an intersection<br />
with few but severe crashes. Using a rate against a dataset further refines<br />
the number of crashes or severity of an area. Each methodology will be<br />
discussed in further detail later in this report.<br />
<strong>Barnstable</strong> <strong>County</strong> <strong>High</strong> <strong>Crash</strong> <strong>Locations</strong> Page 1
This report includes four high crash lists that identify the most dangerous<br />
intersections based on four different focuses.<br />
DATA SOURCE<br />
MASSDOT DATA<br />
The initial data source, and the general foundation for this report, is the<br />
<strong>Crash</strong> Data Cluster Analysis provided by MassDOT for 2006-2008. This<br />
data are the end result of a series of data sharing procedures between<br />
citizens, local police departments, the Massachusetts Registry of Motor<br />
Vehicles (RMV), and MassDOT. If an individual is involved in a crash that<br />
results in $1,000 damage or injury, they are required to fill out a Motor<br />
Vehicle <strong>Crash</strong> Operator Report and mail copies to the local police<br />
department and the RMV. Also, local and state police officers will respond<br />
to many crashes located in their jurisdiction, and their subsequent reports<br />
will be sent to the RMV. The RMV will compile the data and input all<br />
available information from the reports into a large database. This<br />
database is then shared with MassDOT. MassDOT is then able to use<br />
geolocating tools in Geographic Information System (GIS) software to<br />
identify the locations of each crash. The resultant output of crash clusters<br />
in the basis for our analysis.<br />
Unfortunately, this geolocating approach by MassDOT is only the<br />
minimum number of crashes at any given location. Of the 12,001 records<br />
sent to MassDOT from the RMV for 2006-2008, 9,220 locations were<br />
located (76.8%). Non-located crashes are typically the result of poor<br />
location identification in the written crash reports.<br />
LOCAL DATA<br />
In an effort to create a more robust dataset, the <strong>Commission</strong> solicited the<br />
police department of each <strong>Barnstable</strong> <strong>County</strong> town for crash statistics on<br />
their most dangerous intersections. There is a wide range between towns<br />
in terms of their ability to produce this data. In total, the <strong>Commission</strong><br />
received top crash lists and the supporting data from ten of fifteen towns.<br />
Page 2<br />
<strong>Barnstable</strong> <strong>County</strong> <strong>High</strong> <strong>Crash</strong> <strong>Locations</strong>
DATA ANALYZED<br />
MASSDOT DATA<br />
The data provided by MassDOT is far more comprehensive than the<br />
additional data provided by local sources. Each crash cluster is<br />
accompanied with information regarding the number of crashes –<br />
specifying number of fatal, injurious, and property damage only crashes.<br />
The inclusion of the information concerning severity allows for the<br />
calculation of an intersection’s Equivalent Property Damage Only<br />
(EPDO). EPDO is a value created by weighting each crash based on its<br />
severity and then aggregating the totals. In this system, a crash that<br />
results in property damage only is assigned a value of one. A crash that<br />
includes an injury (while not including a fatality) is assigned a value of<br />
five. A fatal crash is assigned a value of ten.<br />
Example: During a three year span, an intersection has twelve crashes with property<br />
damage only, four crashes including an injury, and two fatal crashes. For this three-year<br />
period, this intersection would have an EPDO of 52 ([12x1]+[4x5]+[2x10]).<br />
From the 9,220 located crashes, 1,364 crash clusters were identified. A<br />
cluster is a grouping of at least two crashes at a specific location. For the<br />
purposes of the <strong>Commission</strong>’s analysis, data from more than one cluster<br />
at a single intersection were sometimes aggregated. It is rare that a single<br />
approach to an intersection would be investigated without attention to the<br />
other aspects of the intersection, which is why some intersections have<br />
more than one cluster.<br />
The following figure depicts the 9,220 located crashes in <strong>Barnstable</strong><br />
<strong>County</strong> from 2006 to 2008. There are high densities of crashes in the<br />
Mid-<strong>Cape</strong> and Canal areas.<br />
<strong>Barnstable</strong> <strong>County</strong> <strong>High</strong> <strong>Crash</strong> <strong>Locations</strong> Page 3
FIGURE 1: BARNSTABLE COUNTY LOCATED CRASHES, 2006-2008<br />
LOCAL DATA<br />
The <strong>Commission</strong> contacted each local police department in <strong>Barnstable</strong><br />
<strong>County</strong> with a request for their town’s high crash locations. Of the fifteen<br />
police departments, eleven use IMC Solutions crash data storage software,<br />
two use PAMET Software, one uses Microsystems, and one department<br />
does not have software to store crash data. Due to the differences in<br />
software, not all returns were equal in their comprehensiveness.<br />
No department was able to provide the severities of crashes for their high<br />
crash lists. The information from local data is limited to the number of<br />
crashes per intersection. Without severity information, the local data<br />
could only bolster the data that were being used in creating the lists that<br />
use crash numbers and not EPDO. It should be noted, there are<br />
significant differences in the number of crashes at intersections as<br />
reported by MassDOT versus the local police departments.<br />
Page 4<br />
<strong>Barnstable</strong> <strong>County</strong> <strong>High</strong> <strong>Crash</strong> <strong>Locations</strong>
Analysis<br />
TOP CRASH LISTS<br />
TOP LOCATIONS BASED ON NUMBER OF CRASHES<br />
The simplest method used in this report for establishing a high crash list<br />
is ranking intersections based on the largest number of crashes. The<br />
number of crashes for each intersection came from one of two sources<br />
(MassDOT and/or local police department). This report does not identify<br />
one source as being more reliable than the other. Therefore, in the case of<br />
an intersection having two different crash numbers, the larger number is<br />
used. The intersection with the greatest number of crashes receives the<br />
number one ranking.<br />
TOP LOCATIONS BASED ON EQUIVALENT PROPERTY DAMAGE ONLY<br />
The inclusion of severity information in the MassDOT data allows for the<br />
calculation of Equivalent Property Damage Only (EPDO). A list ranked by<br />
EPDO will bring more attention to locations where the accidents have<br />
produced injuries or fatalities. The formula for calculating EPDO is as<br />
follows:<br />
EPDO = 10 x (# fatal crashes) + 5 x (# injury crashes) + property damage only crashes<br />
While the EPDO method is useful in identifying intersections with the<br />
most severe crashes, it should be noted that not all crashes and their<br />
resultant injuries can be attributed to a road’s conditions or geometry.<br />
For example, it could be a passenger’s decision of whether or not to wear a<br />
seatbelt that determines whether an injury will be experienced. The<br />
intersection with the highest EPDO in this list is ranked number one.<br />
TOP LOCATIONS BASED ON CRASH RATE<br />
It is expected that a road with higher traffic volumes will experience more<br />
vehicles crashes. Using a crash rate helps to avoid highlighting<br />
<strong>Barnstable</strong> <strong>County</strong> <strong>High</strong> <strong>Crash</strong> <strong>Locations</strong> Page 5
intersections whose problems may be magnified by a large traffic volume.<br />
With this methodology, the number of crashes is compared to the number<br />
of vehicles entering, and the resultant figure is in terms of crashes per<br />
million entering vehicles. To be certain to capture the top fifty crash<br />
locations based on crash rate, the top 100 intersections based on number<br />
of crashes were analyzed with the following formula:<br />
R = ([C/Y] x 1,000,000)/(V x 365)<br />
R = <strong>Crash</strong> Rate, C = Total <strong>Crash</strong>es, Y = # Years Analyzed, V = Daily Entering Volume<br />
While this method is good for reducing the influence of high volume<br />
roads, it also has the capacity to rank a very low volume road with few<br />
crashes very highly. The intersection with the highest crash rate in this list<br />
is ranked number one. Note, the crash numbers in this list and the <strong>Crash</strong><br />
Number Basis list come from both MassDOT and local police department<br />
sources.<br />
TOP LOCATIONS BASED ON EPDO RATE<br />
This method uses the same theory as the crash rate, where there is an<br />
assumption that heavily traveled roads are expected to have higher EPDO<br />
designations, and it is not necessarily indicative of poor road conditions<br />
or geometric flaws. To create this list, the intersections’ EPDO is<br />
compared to the number of vehicles entering, and the resultant figure is in<br />
terms of crashes per million entering vehicles. To be certain to capture the<br />
top fifty crash locations based on EPDO rate, the top 100 locations with<br />
the highest EPDO were analyzed with the following formula:<br />
EPDO Rate = ([EPDO/Y] x 1,000,000)/(V x 365)<br />
Y = # Years Analyzed, V = Daily Entering Volume<br />
The intersection with the highest EPDO rate in this list is ranked number<br />
one. Also note, the data analyzed in this list and the EPDO Basis list is<br />
strictly from MassDOT data.<br />
Page 6<br />
<strong>Barnstable</strong> <strong>County</strong> <strong>High</strong> <strong>Crash</strong> <strong>Locations</strong>
TRAFFIC VOLUME DATA<br />
CAPE COD COMMISSION TRAFFIC COUNTING PROGRAM<br />
To determine the crash rate and the EPDO rate, traffic volume data were<br />
needed to calculate a daily entering volume for each intersection. Base<br />
traffic data were taken from counts conducted by the <strong>Cape</strong> <strong>Cod</strong><br />
<strong>Commission</strong> adjusted to the year 2009 (as found on<br />
www.gocapecod.org/counts). Using the <strong>Commission</strong>’s Traffic Count<br />
Growth Management System (TCGMS) Excel macro, the <strong>Commission</strong><br />
identified 2009 traffic volumes to be merely 0.4% less than 2006 traffic<br />
volumes and are therefore suitable for analysis with 2006-2008 crash<br />
data. The 2009 estimates are available for any traffic count that has been<br />
conducted in 2003 or later. Factors for adjustment are generated from<br />
year to year analysis of <strong>Commission</strong> counts.<br />
CAPE COD REGIONAL MODEL<br />
With all approaches to over 100 intersections included in the analysis, it<br />
was not possible to use solely actual traffic counts to estimate entering<br />
volumes. As a compliment to the <strong>Commission</strong> count data, volumes<br />
generated from the <strong>Cape</strong> <strong>Cod</strong> Regional Model were used. The model was<br />
last modified in 2006, using 2006 volumes as the base. Due to the<br />
minimal overall change in county-wide traffic volume between 2006 and<br />
2009, the model’s volumes were deemed comparable to the 2009 volume<br />
estimates.<br />
TRIP GENERATION HANDBOOK<br />
Several intersections in need of investigation included an approach from a<br />
commercial or institutional establishment where traffic data were not<br />
available from the <strong>Commission</strong> count database or the regional model.<br />
Using Trip Generation, 8 th Edition from the Institute of Transportation<br />
Engineers, traffic volumes were estimated for those legs.<br />
<strong>Barnstable</strong> <strong>County</strong> <strong>High</strong> <strong>Crash</strong> <strong>Locations</strong> Page 7
ENTERING VOLUME CALCULATION<br />
The daily entering volume is calculated as an average annual daily<br />
volume. Since the majority of <strong>Commission</strong>-conducted traffic counts take<br />
place in the summer months, an appropriate seasonal factor (dependent<br />
on the month and year) is applied to achieve the annual average.<br />
Likewise, the results from the regional model are annual averages. Annual<br />
averages were deemed appropriate for use since the crash data covers all<br />
twelve months.<br />
The formula for calculating the daily entering volume for an intersection<br />
consist of aggregating the average annual daily traffic (AADT) for each leg<br />
of the intersection, then dividing that total by two.<br />
Page 8<br />
<strong>Barnstable</strong> <strong>County</strong> <strong>High</strong> <strong>Crash</strong> <strong>Locations</strong>
Limitations<br />
STATE DATA COLLECTION<br />
With an average of over 100,000 crashes per year statewide, it is difficult<br />
to report and locate all incidents accurately. To address the inefficiencies,<br />
in 2001, Mass<strong>High</strong>way (MassDOT’s precursor) and the RMV made<br />
several significant changes to the crash reporting process. Their intent<br />
was to make the process more efficient and reduce the time it takes for<br />
information to reach the state offices. The changes that took place<br />
included new forms and new data input systems.<br />
<strong>Cape</strong>-wide yearly crash averages had a significant change since the new<br />
reporting system was put in place. In the three years leading up to the<br />
change (1999, 2000, and 2001), <strong>Barnstable</strong> <strong>County</strong> averaged 5,174<br />
crashes per year. In the following three years, the county averaged 3,928<br />
crashes per year (a 24% reduction). Of the fifteen towns, only two towns<br />
averaged more crashes following the reporting changes. Three towns<br />
averaged less than 50% of their pre-change crash average.<br />
One-year crash averages for the four years from 2005 to 2008 remained<br />
equally below the pre-change average (4,101, or 79%). Not enough<br />
evidence exists to determine if this is a direct result of the change in<br />
reporting. It is possible crashes have indeed been reduced since 2001. It<br />
should be noted that <strong>Cape</strong>-wide traffic has reduced by about 10% between<br />
2001 and 2008.<br />
In the latter part of this decade, some towns have shown sizable increases<br />
in crash numbers from one year to another. This is often the result of a<br />
local police department’s change to an electronic crash reporting system<br />
(where crash reports are sent electronically to the RMV, rather than by<br />
physical paper copies). Electronic crash reporting has proved to be a more<br />
efficient method. Of the fifteen <strong>Barnstable</strong> <strong>County</strong> towns, six currently<br />
report records electronically.<br />
<strong>Barnstable</strong> <strong>County</strong> <strong>High</strong> <strong>Crash</strong> <strong>Locations</strong> Page 9
LOCAL CRASH DATA<br />
In an effort to bolster the state-provided crash data, the <strong>Cape</strong> <strong>Cod</strong><br />
<strong>Commission</strong> contacted the local police department from each town in<br />
<strong>Barnstable</strong> <strong>County</strong>, seeking a listing of their top crash locations (and<br />
supporting data). While the locations were often similar to the locations<br />
highlighted by MassDOT, the crash numbers were rarely similar.<br />
Unfortunately, there was not a pattern of all town data being less than the<br />
state’s or vice versa. In some towns, the same top fifteen locations, as<br />
reported by the town, would be twice as high as the numbers reported by<br />
the state for those same locations. In other towns, the state data was<br />
reported twice as high.<br />
There are several possible reasons for discrepancies in the data. First,<br />
many motorists involved in a crash will not notify the local police if injury<br />
or major damage are not involved (although they may submit a crash<br />
record to the state). Secondly, some police departments send the RMV all<br />
of their records, where some send only crashes involving at least $1,000<br />
damage or injury. Third, many crashes on roads under State <strong>High</strong>way<br />
jurisdiction will be handled by State Police personnel, and the reports will<br />
never arrive at the local departments. Lastly, some crash reports sent to<br />
the RMV are filled out inaccurately or lacking essential location data –<br />
making it impossible to be included in the geolocated database.<br />
In light of these inconsistencies, the <strong>Commission</strong> assumed each data<br />
source represented at least the minimum number of accidents for each<br />
location. If a location had two crash numbers – meaning one from each<br />
source – the greater number was chosen for analysis in the crash number<br />
and crash rate lists.<br />
Page 10<br />
<strong>Barnstable</strong> <strong>County</strong> <strong>High</strong> <strong>Crash</strong> <strong>Locations</strong>
<strong>High</strong> <strong>Crash</strong> Location Lists<br />
Top <strong>Locations</strong> based on Number of <strong>Crash</strong>es<br />
Top <strong>Locations</strong> based on Equivalent Property Damage Only<br />
Top <strong>Locations</strong> based on <strong>Crash</strong> Rate<br />
Top <strong>Locations</strong> based on EPDO Rate<br />
<strong>Barnstable</strong> <strong>County</strong> <strong>High</strong> <strong>Crash</strong> <strong>Locations</strong> Page 11
TOP LOCATIONS BASED ON NUMBER OF CRASHES<br />
Rank Intersection Town <strong>Crash</strong> #<br />
1 Route 6 (Mid-<strong>Cape</strong> <strong>High</strong>way) @ Route 132 (Iyannough Road) - Exit 6 1 <strong>Barnstable</strong> 128<br />
2 Route 6 (Mid-<strong>Cape</strong> <strong>High</strong>way) @ Route 134 (East West Dennis Road) - Exit 9 2 Dennis 99<br />
3 Otis Air Force Base Rotary @ Rt 28 / Sandwich Rd / Connery Ave 3 Bourne 88<br />
4 Route 6 (Mid-<strong>Cape</strong> <strong>High</strong>way) @ Willow Street - Exit 7 4 Yarmouth 86<br />
5 Route 6 (Mid-<strong>Cape</strong> <strong>High</strong>way) @ Route 149 (Prospect Street) - Exit 5 5 <strong>Barnstable</strong> 83<br />
6 Route 6 (Mid-<strong>Cape</strong> <strong>High</strong>way) @ Station Avenue - Exit 8 32 Yarmouth 78<br />
7 Route 6 (Mid-<strong>Cape</strong> <strong>High</strong>way) @ Route 130 (Forestdale Road) - Exit 2 6 Sandwich 73<br />
8 Bourne Rotary @ Rt 28 / Sandwich Rd / Trowbridge Rd 33 Bourne 71<br />
9 Route 25 @ Bourne Bridge Bourne 68<br />
10 Route 28 (Falmouth Road) @ Bearses Way 7 <strong>Barnstable</strong> 60<br />
11 Route 28 (Falmouth Road) @ Route 149 (Prospect Street) 8 <strong>Barnstable</strong> 56<br />
12 Route 6 (Mid-<strong>Cape</strong> <strong>High</strong>way) @ Chase Rd - Exit 4 Sandwich 55<br />
13 Belmont Rotary @ Rt 28 / Rt 6 / Rt 6 Bypass / Head of the Bay Rd 34 Bourne 54<br />
14 Route 28 (Falmouth Road) @ South <strong>County</strong> Road 10 <strong>Barnstable</strong> 52<br />
15 Route 28 (Iyannough Road) @ Yarmouth Road 11 <strong>Barnstable</strong> 48<br />
16 Route 134 (East West Dennis Road) @ Upper <strong>County</strong> Road 12 Dennis 44<br />
16 Route 6 (Mid-<strong>Cape</strong> <strong>High</strong>way) @ Route 124 (Pleasant Lake Avenue) - Exit 10 Harwich 44<br />
16 Route 6 (Mid-<strong>Cape</strong> <strong>High</strong>way) @ Quaker Meeting House Rd - Exit 3 Sandwich 44<br />
19 Route 28 (Falmouth Road) @ Osterville West <strong>Barnstable</strong> Road <strong>Barnstable</strong> 43<br />
19 Route 132 (Iyannough Road) @ Shoot Flying Hill Road 14 <strong>Barnstable</strong> 43<br />
21 Airport Rotary @ Rt 132 / Rt 28 EB/WB / <strong>Barnstable</strong> Rd 15 <strong>Barnstable</strong> 42<br />
22 Route 132 (Iyanough Road) @ Phinneys Lane 16 <strong>Barnstable</strong> 40<br />
23 Route 132 (Iyannough Road) @ Independence Road / Enterprise Road 17 <strong>Barnstable</strong> 36<br />
24 Eastham Rotary @ Rt 6A/28 / Rt 6, Smith Ln 18 Eastham 35<br />
24 Route 28 @ Route 151 (Nathan Ellis <strong>High</strong>way) Falmouth 35<br />
24 Route 28 (Falmouth Road) @ Old Stage Road 19 <strong>Barnstable</strong> 35<br />
27 Route 28 (Chatham Road) @ Route 6A (Cranberry <strong>High</strong>way) 20 Orleans 33<br />
28 Mashpee Circle @ Rt 28 / Rt 151 / Great Neck Rd 35 Mashpee 32<br />
29 Route 28 (Falmouth Road) @ Pitchers Way <strong>Barnstable</strong> 31<br />
29 Route 28 (Falmouth Road) @ Lincoln Road <strong>Barnstable</strong> 31<br />
31 Sandwich Road @ Adams Street Bourne 30<br />
32 Route 134 (East West Dennis Road) @ Market Place Dennis 27<br />
33 Theophilus F. Smith Road @ Cumberland Farm / Patriot Square SD Dennis 25<br />
33 Route 6A (Sandwich Road) @ Sagamore Bridge Connector Bourne 25<br />
33 Route 28 (Main St / Iyannough Rd) @ East Main Street 21 Yarmouth 25<br />
36 Route 28 (Falmouth Road) @ Phinneys Lane 22 <strong>Barnstable</strong> 24<br />
36 Route 151 (Nathan Ellis <strong>High</strong>way) @ Sandwich Road Falmouth 24<br />
36 Route 28 (Main Street) @ Depot Street Dennis 24<br />
36 Route 28 (Main Street) @ Route 134 / Swan River Road 23 Dennis 24<br />
40 Route 6 WB Off ramp @ Route 6 (Scenic <strong>High</strong>way) Bourne 22<br />
40 Route 6 (GAR Hwy) @ Brackett Road / Old <strong>County</strong> Road 24 Eastham 22<br />
40 Route 6 (Mid-<strong>Cape</strong> <strong>High</strong>way) @ Route 6A (Cranberry <strong>High</strong>way) - Exit 12 Orleans 22<br />
40 Route 6 (Mid-<strong>Cape</strong> <strong>High</strong>way) @ Route 137 (Long Pond Road) - Exit 11 25 Harwich 22<br />
40 Station Avenue @ Whites Path 26 Yarmouth 22<br />
45 Buck Island Road @ West Yarmouth Road Yarmouth 20<br />
45 Sandwich Road @ Brick Kiln Road Falmouth 20<br />
45 Station Avenue @ Old Town House Road Yarmouth 20<br />
45 Route 130 (Forestdale Road) @ Cotuit Road Sandwich 20<br />
49 Main Street @ Tonset Road Orleans 19<br />
49 Spring Bars Road @ Worcester Court Falmouth 19<br />
49 Route 28 (Teaticket <strong>High</strong>way) @ Stop and Shop SD Falmouth 19<br />
49 Route 134 (East West Dennis Road) @ Bob Crowell Rd / Hemlock Ln / Agway SD Dennis 19<br />
Source: MassDOT 2006-2008 <strong>Crash</strong> Data and Towns of <strong>Barnstable</strong> <strong>County</strong><br />
Page 12<br />
<strong>Barnstable</strong> <strong>County</strong> <strong>High</strong> <strong>Crash</strong> <strong>Locations</strong>
TOP LOCATIONS BASED ON EQUIVALENT PROPERTY<br />
DAMAGE ONLY<br />
Rank Intersection Town <strong>Crash</strong> # EPDO<br />
1 Route 6 (Mid-<strong>Cape</strong> <strong>High</strong>way) @ Route 132 (Iyannough Road) - Exit 6 1 <strong>Barnstable</strong> 128 314<br />
2 Route 6 (Mid-<strong>Cape</strong> <strong>High</strong>way) @ Willow Street - Exit 7 4 Yarmouth 86 204<br />
3 Route 6 (Mid-<strong>Cape</strong> <strong>High</strong>way) @ Route 134 (East West Dennis Road) - Exit 9 2 Dennis 99 187<br />
3 Route 6 (Mid-<strong>Cape</strong> <strong>High</strong>way) @ Route 149 (Prospect Street) - Exit 5 5 <strong>Barnstable</strong> 83 187<br />
5 Route 6 (Mid-<strong>Cape</strong> <strong>High</strong>way) @ Station Avenue - Exit 8 32 Yarmouth 78 182<br />
6 Otis Air Force Base Rotary @ Rt 28 / Sandwich Rd / Connery Ave 3 Bourne 88 172<br />
7 Route 25 @ Bourne Bridge Bourne 68 148<br />
8 Route 6 (Mid-<strong>Cape</strong> <strong>High</strong>way) @ Route 130 (Forestdale Road) - Exit 2 6 Sandwich 73 145<br />
9 Route 6 (Mid-<strong>Cape</strong> <strong>High</strong>way) @ Chase Rd - Exit 4 Sandwich 55 128<br />
10 Bourne Rotary @ Rt 28 / Sandwich Rd / Trowbridge Rd 33 Bourne 71 115<br />
11 Belmont Rotary @ Rt 28 / Rt 6 / Rt 6 Bypass / Head of the Bay Rd 34 Bourne 54 110<br />
12 Route 6 (Mid-<strong>Cape</strong> <strong>High</strong>way) @ Quaker Meeting House Rd - Exit 3 Sandwich 44 104<br />
13 Route 134 (East West Dennis Road) @ Upper <strong>County</strong> Road 12 Dennis 44 100<br />
14 Route 6 (Mid-<strong>Cape</strong> <strong>High</strong>way) @ Route 124 (Pleasant Lake Avenue) - Exit 10 Harwich 44 96<br />
15 Mashpee Circle @ Rt 28 / Rt 151 / Great Neck Rd 35 Mashpee 32 80<br />
16 Eastham Rotary @ Rt 6A/28 / Rt 6, Smith Ln 18 Eastham 35 75<br />
17 Route 151 (Nathan Ellis <strong>High</strong>way) @ Sandwich Road Falmouth 24 73<br />
18 Route 28 @ Route 151 (Nathan Ellis <strong>High</strong>way) Falmouth 35 71<br />
19 Route 6 (Mid-<strong>Cape</strong> <strong>High</strong>way) @ Route 6A (Cranberry <strong>High</strong>way) - Exit 12 Orleans 22 70<br />
19 Airport Rotary @ Rt 132 / Rt 28 EB/WB / <strong>Barnstable</strong> Rd 15 <strong>Barnstable</strong> 42 70<br />
21 Route 6 (GAR Hwy) @ Brackett Road / Old <strong>County</strong> Road 24 Eastham 22 62<br />
22 Route 6A (Sandwich Road) @ Sagamore Bridge Connector Bourne 25 58<br />
23 Theophilus F. Smith Road @ Cumberland Farm / Patriot Square SD Dennis 25 57<br />
24 Route 6 (Mid-<strong>Cape</strong> <strong>High</strong>way) @ Route 137 (Long Pond Road) - Exit 11 25 Harwich 22 54<br />
25 Buck Island Road @ West Yarmouth Road Yarmouth 20 52<br />
25 Route 28 (Main Street) @ Depot Street Dennis 24 52<br />
25 Route 28 (Falmouth Road) @ Bearses Way 7 <strong>Barnstable</strong> 24 52<br />
28 Sandwich Road @ Adams Street Bourne 30 50<br />
28 Route 28 (Teaticket <strong>High</strong>way) @ Figuerido Way Falmouth 18 50<br />
30 Buck Island Road @ Higgins Crowell Road Yarmouth 17 49<br />
31 Great Neck Road North @ Old <strong>Barnstable</strong> Road 27 Mashpee 12 48<br />
32 Route 28 (Teaticket <strong>High</strong>way) @ Stop and Shop SD Falmouth 19 47<br />
33 Route 28 (Falmouth Road) @ Route 149 (Prospect Street) 8 <strong>Barnstable</strong> 22 46<br />
34 Route 28 (Main St / Iyannough Rd) @ East Main Street 21 Yarmouth 25 45<br />
35 Station Avenue @ Old Town House Road 31 Yarmouth 20 44<br />
35 Route 151 (Nathan Ellis <strong>High</strong>way) @ Old <strong>Barnstable</strong> Road Mashpee 12 44<br />
35 Route 6A (Cranberry <strong>High</strong>way) @ Eldredge Park Way Orleans 16 44<br />
38 Main Street @ Tonset Road Orleans 19 43<br />
39 Station Avenue @ Wood Road Yarmouth 18 42<br />
39 Route 28 (Falmouth Road) @ Osterville West <strong>Barnstable</strong> Road <strong>Barnstable</strong> 14 42<br />
41 Route 132 (Iyannough Road) @ Independence Road / Enterprise Road 17 <strong>Barnstable</strong> 12 41<br />
42 Rt 39 (Orleans Harwich Road) @ Pleasant Bay Road Harwich 15 40<br />
42 Forest Road @ Winslow Gray Road Yarmouth 15 40<br />
44 Route 6 WB Off ramp @ Route 6 (Scenic <strong>High</strong>way) Bourne 22 38<br />
44 Sandwich Road @ Brick Kiln Road Falmouth 10 38<br />
44 Route 134 (East West Dennis Road) @ Airline Road Dennis 14 38<br />
44 Route 28 (Falmouth Road) @ Pitchers Way <strong>Barnstable</strong> 10 38<br />
48 Route 6A (Cranberry <strong>High</strong>way) @ Union Street / Old Church Street Yarmouth 13 37<br />
48 Route 28 (Falmouth Road) @ South <strong>County</strong> Road 10 <strong>Barnstable</strong> 13 37<br />
48 Route 132 (Iyanough Road) @ Phinneys Lane 16 <strong>Barnstable</strong> 17 37<br />
Source: MassDOT 2006-2008 <strong>Crash</strong> Data<br />
<strong>Barnstable</strong> <strong>County</strong> <strong>High</strong> <strong>Crash</strong> <strong>Locations</strong> Page 13
TOP LOCATIONS BASED ON CRASH RATE<br />
Rank Intersection Town <strong>Crash</strong> # <strong>Crash</strong> Rate<br />
1 Otis Air Force Base Rotary @ Rt 28 / Sandwich Rd / Connery Ave 3 Bourne 88 2.73<br />
2 Rt 39 (Orleans Harwich Road) @ Pleasant Bay Road Harwich 17 2.32<br />
3 Route 6 (Mid-<strong>Cape</strong> <strong>High</strong>way) @ Route 134 (East West Dennis Road) - Exit 9 2 Dennis 99 2.16<br />
4 Route 28 (Falmouth Road) @ Route 149 (Prospect Street) 8 <strong>Barnstable</strong> 56 2.14<br />
5 Route 124 (Harwich Road) @ Tubman Road 36 Brewster 12 2.07<br />
6 Theophilus F. Smith Road @ Cumberland Farm / Patriot Square SD Dennis 25 2.04<br />
7 Route 28 (Falmouth Road) @ South <strong>County</strong> Road 10 <strong>Barnstable</strong> 52 2.03<br />
8 Station Avenue @ Wood Road Yarmouth 18 1.95<br />
9 Route 6 (Mid-<strong>Cape</strong> <strong>High</strong>way) @ Route 132 (Iyannough Road) - Exit 6 1 <strong>Barnstable</strong> 128 1.78<br />
10 Route 28 (Falmouth Road) @ Bearses Way 7 <strong>Barnstable</strong> 60 1.77<br />
11 Spring Bars Road @ Worcester Court Falmouth 19 1.73<br />
11 Cotuit Road @ Harlow Road 28 Sandwich 17 1.73<br />
13 Route 6A (Sandwich Road) @ Sagamore Bridge Connector Bourne 25 1.71<br />
14 Sandwich Road @ Adams Street Bourne 30 1.64<br />
15 Route 6 WB Off ramp @ Route 6 (Scenic <strong>High</strong>way) Bourne 22 1.61<br />
16 Route 28 (Falmouth Road) @ Osterville West <strong>Barnstable</strong> Road <strong>Barnstable</strong> 43 1.53<br />
16 Route 28 (Chatham Road) @ Route 6A (Cranberry <strong>High</strong>way) 20 Orleans 33 1.53<br />
18 Route 132 (Iyannough Road) @ Shoot Flying Hill Road 14 <strong>Barnstable</strong> 43 1.52<br />
19 Route 6 (Mid-<strong>Cape</strong> <strong>High</strong>way) @ Station Avenue - Exit 8 32 Yarmouth 78 1.49<br />
19 Route 134 (East West Dennis Road) @ Upper <strong>County</strong> Road 12 Dennis 44 1.49<br />
21 Main Street @ Tonset Road Orleans 19 1.43<br />
22 Route 6 (Mid-<strong>Cape</strong> <strong>High</strong>way) @ Willow Street - Exit 7 4 Yarmouth 86 1.42<br />
23 Route 25 @ Bourne Bridge Bourne 68 1.39<br />
24 Route 6 (Mid-<strong>Cape</strong> <strong>High</strong>way) @ Route 149 (Prospect Street) - Exit 5 5 <strong>Barnstable</strong> 83 1.38<br />
24 Route 28 (Iyannough Road) @ Yarmouth Road <strong>Barnstable</strong> 48 1.38<br />
24 Belmont Rotary @ Rt 28 / Rt 6 / Rt 6 Bypass / Head of the Bay Rd 34 Bourne 54 1.38<br />
27 Route 28 (Main Street) @ Depot Street Dennis 24 1.33<br />
28 Buck Island Road @ West Yarmouth Road Yarmouth 20 1.30<br />
28 Sandwich Road @ Brick Kiln Road Falmouth 20 1.30<br />
30 Route 28 (Falmouth Road) @ Pitchers Way <strong>Barnstable</strong> 31 1.29<br />
31 Route 6 (Mid-<strong>Cape</strong> <strong>High</strong>way) @ Route 124 (Pleasant Lake Avenue) - Exit 10 Harwich 44 1.23<br />
32 Route 6 (Mid-<strong>Cape</strong> <strong>High</strong>way) @ Route 130 (Forestdale Road) - Exit 2 6 Sandwich 73 1.21<br />
32 Bourne Rotary @ Rt 28 / Sandwich Rd / Trowbridge Rd 33 Bourne 71 1.21<br />
34 Route 28A (Sandwich Road) @ <strong>County</strong> Road Bourne 10 1.19<br />
35 Depot Street @ Center Street Harwich 9 1.17<br />
36 Old Town House Road @ Forest Road 29 Yarmouth 15 1.12<br />
37 Depot Street @ Center Street Dennis 9 1.10<br />
38 Great Neck Road North @ Old <strong>Barnstable</strong> Road 27 Mashpee 12 1.08<br />
38 Route 132 (Iyanough Road) @ Phinneys Lane 16 <strong>Barnstable</strong> 40 1.08<br />
40 Route 130 (Forestdale Road) @ Cotuit Road Sandwich 20 1.07<br />
41 Route 134 (East West Dennis Road) @ Bob Crowell Rd / Hemlock Ln / Agway SD Dennis 19 1.06<br />
42 Adams Street @ Sagamore Bridge Connector Bourne 15 1.05<br />
43 Route 151 (Nathan Ellis <strong>High</strong>way) @ Sandwich Road Falmouth 24 1.04<br />
44 Route 28 (Main Street) @ Route 134 / Swan River Road Dennis 24 1.02<br />
44 Eastham Rotary @ Rt 6A/28 / Rt 6, Smith Ln 18 Eastham 35 1.02<br />
46 Route 6 (Mid-<strong>Cape</strong> <strong>High</strong>way) @ Chase Rd - Exit 4 Sandwich 55 1.00<br />
47 Route 134 (East West Dennis Road) @ Market Place Dennis 27 0.99<br />
48 Buck Island Road @ Higgins Crowell Road Yarmouth 17 0.98<br />
48 Route 28 (Falmouth Road) @ Old Stage Road 19 <strong>Barnstable</strong> 35 0.98<br />
50 Route 28 (Main St / Iyannough Rd) @ East Main Street 21 Yarmouth 25 0.97<br />
Source: MassDOT 2006-2008 <strong>Crash</strong> Data and Towns of <strong>Barnstable</strong> <strong>County</strong><br />
Page 14<br />
<strong>Barnstable</strong> <strong>County</strong> <strong>High</strong> <strong>Crash</strong> <strong>Locations</strong>
TOP LOCATIONS BASED ON EPDO RATE<br />
Rank Intersection TOWN <strong>Crash</strong># EPDO EPDO Rate<br />
1 Route 124 (Harwich Road) @ Tubman Road 36 Brewster 12 32 5.51<br />
2 Rt 39 (Orleans Harwich Road) @ Pleasant Bay Road Harwich 15 40 5.45<br />
3 Otis Air Force Base Rotary @ Rt 28 / Sandwich Rd / Connery Ave 3 Bourne 88 172 5.33<br />
4 Theophilus F. Smith Road @ Cumberland Farm / Patriot Square SD Dennis 25 57 4.65<br />
5 Station Avenue @ Wood Road Yarmouth 18 42 4.54<br />
6 Route 6 (Mid-<strong>Cape</strong> <strong>High</strong>way) @ Route 132 (Iyannough Road) - Exit 6 1 <strong>Barnstable</strong> 128 314 4.36<br />
7 Great Neck Road North @ Old <strong>Barnstable</strong> Road 27 Mashpee 12 48 4.32<br />
8 Route 6 (Mid-<strong>Cape</strong> <strong>High</strong>way) @ Route 134 (East West Dennis Road) - Exit 9 2 Dennis 99 187 4.08<br />
9 Route 6A (Sandwich Road) @ Sagamore Bridge Connector Bourne 25 58 3.97<br />
10 Sandwich Road @ Carriage Shop Road 37 Falmouth 7 31 3.96<br />
11 Route 6 (Mid-<strong>Cape</strong> <strong>High</strong>way) @ Station Avenue - Exit 8 32 Yarmouth 78 182 3.48<br />
12 Old Bass River Road @ Old Chatham Road Dennis 6 26 3.44<br />
13 Depot Street @ Center Street Harwich 9 26 3.39<br />
14 Route 134 (East West Dennis Road) @ Upper <strong>County</strong> Road 12 Dennis 44 100 3.38<br />
14 Buck Island Road @ West Yarmouth Road Yarmouth 20 52 3.38<br />
16 Route 6 (Mid-<strong>Cape</strong> <strong>High</strong>way) @ Willow Street - Exit 7 4 Yarmouth 86 204 3.36<br />
17 Cotuit Road @ Harlow Road 28 Sandwich 17 33 3.35<br />
18 Main Street @ Tonset Road Orleans 19 43 3.23<br />
19 Route 151 (Nathan Ellis <strong>High</strong>way) @ Sandwich Road Falmouth 24 73 3.17<br />
19 Depot Street @ Center Street Dennis 9 26 3.17<br />
21 Route 6 (Mid-<strong>Cape</strong> <strong>High</strong>way) @ Route 149 (Prospect Street) - Exit 5 5 <strong>Barnstable</strong> 83 187 3.12<br />
22 Route 28A (Sandwich Road) @ <strong>County</strong> Road Bourne 10 26 3.10<br />
23 Route 25 @ Bourne Bridge Bourne 68 148 3.02<br />
24 Route 28 (Main Street) @ Depot Street Dennis 24 52 2.88<br />
25 Buck Island Road @ Higgins Crowell Road Yarmouth 17 49 2.83<br />
26 Belmont Rotary @ Rt 28 / Rt 6 / Rt 6 Bypass / Head of the Bay Rd 34 Bourne 54 110 2.81<br />
27 Route 6 WB Off ramp @ Route 6 (Scenic <strong>High</strong>way) Bourne 22 38 2.78<br />
28 Sandwich Road @ Adams Street Bourne 30 50 2.73<br />
29 Route 6 (Mid-<strong>Cape</strong> <strong>High</strong>way) @ Route 124 (Pleasant Lake Avenue) - Exit 10 Harwich 44 96 2.68<br />
30 Route 28 (Teaticket <strong>High</strong>way) @ Figuerido Way Falmouth 18 50 2.66<br />
31 Forest Road @ Winslow Gray Road Yarmouth 15 40 2.55<br />
32 Route 28 (Chatham Road) @ Finlay Road 30 Orleans 8 32 2.55<br />
33 Spring Bars Road @ Worcester Court Falmouth 12 28 2.54<br />
34 Sandwich Road @ Brick Kiln Road Falmouth 10 38 2.46<br />
35 Adams Street @ Sagamore Bridge Connector Bourne 15 35 2.46<br />
36 Route 6 (Mid-<strong>Cape</strong> <strong>High</strong>way) @ Route 130 (Forestdale Road) - Exit 2 6 Sandwich 73 145 2.41<br />
37 Route 6 (Mid-<strong>Cape</strong> <strong>High</strong>way) @ Chase Rd - Exit 4 Sandwich 55 128 2.34<br />
38 Route 6 (Mid-<strong>Cape</strong> <strong>High</strong>way) @ EB approaching Exit 11 Harwich 10 30 2.31<br />
38 Old Town House Road @ Forest Road 29 Yarmouth 15 31 2.31<br />
40 Route 6 (GAR Hwy) @ Brackett Road / Old <strong>County</strong> Road 24 Eastham 22 62 2.29<br />
41 Route 6A (Cranberry <strong>High</strong>way) @ Main Street Sandwich 11 27 2.26<br />
42 Route 28 (Teaticket <strong>High</strong>way) @ Stop and Shop SD Falmouth 19 47 2.25<br />
43 Mashpee Circle @ Rt 28 / Rt 151 / Great Neck Rd Mashpee 32 80 2.23<br />
43 Station Avenue @ Regional Avenue / Studley Road Yarmouth 9 33 2.23<br />
43 Route 134 (East West Dennis Road) @ Airline Road Dennis 14 38 2.23<br />
43 Sandwich Road @ Tanglewood Drive Falmouth 7 27 2.23<br />
47 Eastham Rotary @ Rt 6A/28 / Rt 6, Smith Ln 18 Eastham 35 75 2.19<br />
48 Station Avenue @ Old Town House Road 31 Yarmouth 20 44 2.08<br />
49 Route 6A (Cranberry <strong>High</strong>way) @ Union Street / Old Church Street Yarmouth 13 37 2.07<br />
50 Route 130 (Forestdale Road) @ Quaker Meeting House Road Sandwich 15 35 2.04<br />
Source: MassDOT 2006-2008 <strong>Crash</strong> Data<br />
<strong>Barnstable</strong> <strong>County</strong> <strong>High</strong> <strong>Crash</strong> <strong>Locations</strong> Page 15
INDEX OF INTERSECTION NOTES<br />
TABLE 1: INDEX OF INTERSECTION NOTES<br />
Note Intersection Town Notes<br />
1 Route 6 (Mid-<strong>Cape</strong> <strong>High</strong>way) @ Route 132 (Iyannough Road) - Exit 6 <strong>Barnstable</strong> Signalization; TIP year 2005, 2006, 2007<br />
2 Route 6 (Mid-<strong>Cape</strong> <strong>High</strong>way) @ Route 134 (East West Dennis Road) - Exit 9 Dennis RSA 2009<br />
3 Otis Air Force Base Rotary @ Rt 28 / Sandwich Rd / Connery Ave Bourne CCC Safety Study 2006<br />
4 Route 6 (Mid-<strong>Cape</strong> <strong>High</strong>way) @ Willow Street - Exit 7 Yarmouth Additional lanes; TIP year 2004<br />
5 Route 6 (Mid-<strong>Cape</strong> <strong>High</strong>way) @ Route 149 (Prospect Street) - Exit 5 <strong>Barnstable</strong> RSA conducted 2010; under design, TIP year 2010<br />
6 Route 6 (Mid-<strong>Cape</strong> <strong>High</strong>way) @ Route 130 (Forestdale Road) - Exit 2 Sandwich CCC Safety Study 2008; RSA 2009; under design; TIP year 2010<br />
7 Route 28 (Falmouth Road) @ Bearses Way <strong>Barnstable</strong> RSA conducted 2009; under review by town<br />
8 Route 28 (Falmouth Road) @ Route 149 (Prospect Street) <strong>Barnstable</strong> Signal design; construction 2010; TIP year 2009<br />
10 Route 28 (Falmouth Road) @ South <strong>County</strong> Road <strong>Barnstable</strong> Signal design; construction 2010; TIP year 2009<br />
11 Route 28 (Iyannough Road) @ Yarmouth Road<br />
New design concepts recommended in Hyannis Access Study; part<br />
<strong>Barnstable</strong><br />
of Yarmouth Road Corridor Study<br />
12 Route 134 (East West Dennis Road) @ Upper <strong>County</strong> Road Dennis RSA 2010; TIP year 2012<br />
14 Route 132 (Iyannough Road) @ Shoot Flying Hill Road<br />
Route 132 construction relocated intersection - TIP year 2005,<br />
<strong>Barnstable</strong><br />
2006, 2007<br />
15 Airport Rotary @ Rt 132 / Rt 28 EB/WB / <strong>Barnstable</strong> Rd <strong>Barnstable</strong> New design concepts recommended in Hyannis Access Study<br />
16 Rt 132 (Iyanough Road) @ Phinneys Lane <strong>Barnstable</strong> Upgrade signals/additional lanes 2009; TIP year 2005, 2006, 2007<br />
17 Route 132 (Iyannough Road) @ Independence Road / Enterprise Road <strong>Barnstable</strong> Left turn lane added to 132 southbound<br />
18 Eastham Rotary @ Rt 6A/28 / Rt 6, Smith Ln Eastham<br />
CCC Safety Study 2009; recommendations included in Route 6<br />
Outer <strong>Cape</strong> Safety and Traffic Flow Study 2004<br />
19 Route 28 (Falmouth Road) @ Old Stage Road <strong>Barnstable</strong> RSA 2007<br />
20 Route 28 (Chatham Road) @ Route 6A (Cranberry <strong>High</strong>way) Orleans CCC Safety Study 2006; TIP year 2012<br />
21 Route 28 (Main St / Iyannough Rd) @ East Main Street Yarmouth<br />
Recommendations included in Route 28 Safety and Traffic Flow<br />
Study 2006<br />
22 Route 28 (Falmouth Road) @ Phinneys Lane <strong>Barnstable</strong> RSA 2007<br />
23 Route 28 (Main Street) @ Route 134 / Swan River Road Dennis<br />
Added left turn lanes and new signal phasing, pedestrian<br />
improvements 2009/2010<br />
24 Route 6 (GAR Hwy) @ Brackett Road / Old <strong>County</strong> Road Eastham<br />
CCC Safety Study 2008; recommendations included in Route 6<br />
Outer <strong>Cape</strong> Safety and Traffic Flow Study 2004; Signal upgrade and<br />
westbound left-turn lane added 2009, 2010<br />
25 Route 6 (Mid-<strong>Cape</strong> <strong>High</strong>way) @ Route 137 (Long Pond Road) - Exit 11 Harwich Under design; TIP year 2011<br />
26 Station Avenue @ Whites Path Yarmouth Signal upgrade and northbound left-turn lane added 2003, 2004<br />
27 Great Neck Road North @ Old <strong>Barnstable</strong> Road Mashpee RSA 2009<br />
28 Cotuit Road @ Harlow Road Sandwich RSA 2009; TIP year 2011<br />
29 Old Town House Road @ Forest Road Yarmouth RSA 2010; TIP year 2010<br />
30 Route 28 (Chatham Road) @ Finlay Road Orleans TIP project, advertised 2006<br />
31 Station Avenue @ Old Town House Road Yarmouth Signal upgrades 2003, 2004<br />
32 Route 6 (Mid-<strong>Cape</strong> <strong>High</strong>way) @ Station Avenue - Exit 8 Yarmouth RSA 2011<br />
33 Bourne Rotary @ Rt 28 / Sandwich Rd / Trowbridge Rd Bourne Signage & striping plan 2011<br />
34 Belmont Rotary @ Rt 28 / Rt 6 / Rt 6 Bypass / Head of the Bay Rd Bourne Project Notification Form 2011<br />
35 Mashpee Circle @ Rt 28 / Rt 151 / Great Neck Rd Mashpee VAI Study<br />
36 Route 124 (Harwich Road) @ Tubman Road Brewster RSA 2011<br />
37 Sandwich Road @ Carriage Shop Road Falmouth RSA 2011<br />
RSA = Road Safety Audit<br />
TIP = Transportation Improvement Program<br />
CCC = <strong>Cape</strong> <strong>Cod</strong> <strong>Commission</strong><br />
In each of the four high crash location lists, select intersections are<br />
denoted with a subscripted number. Each number corresponds to a<br />
number in the “Note #” column in the preceding table. For those<br />
Page 16<br />
<strong>Barnstable</strong> <strong>County</strong> <strong>High</strong> <strong>Crash</strong> <strong>Locations</strong>
intersections included, the table provides information relevant to studies<br />
that may have been performed, past or planned construction, or other<br />
changes that may influence an intersection’s frequency of crashes.<br />
<strong>Barnstable</strong> <strong>County</strong> <strong>High</strong> <strong>Crash</strong> <strong>Locations</strong> Page 17
Bicycle and Pedestrian <strong>Crash</strong>es<br />
MASSDOT DATA<br />
From the overall crash dataset, MassDOT further narrows the data to<br />
highlight crashes involving bicycles or pedestrians. All of the crashes<br />
included in the bicycle/pedestrian data are also included in the data of all<br />
vehicular crashes. As opposed to the three-year analysis provided for all<br />
vehicular crashes, the most recent bicycle/pedestrian data include crashes<br />
from 2002-2008. The following figure depicts all located crashes on<br />
<strong>Barnstable</strong> <strong>County</strong> that occurred during these seven years. All<br />
bicycle/pedestrian crashes included at least one motor vehicle.<br />
FIGURE 2: BICYCLE/PEDESTRIAN CRASHES, 2002-2008<br />
Page 18<br />
<strong>Barnstable</strong> <strong>County</strong> <strong>High</strong> <strong>Crash</strong> <strong>Locations</strong>
The highest concentration of bicycle and pedestrian crashes occur along<br />
<strong>Barnstable</strong> <strong>County</strong>’s major roads. The majority of crashes took place along<br />
Route 28 – particularly in downtown Falmouth, Yarmouth, Dennis,<br />
Chatham and Orleans. Other areas of high concentration are downtown<br />
Buzzard’s Bay in Bourne, Station Avenue in Yarmouth, Route 134 in<br />
Dennis, downtown Orleans, and Commercial Street in Provincetown.<br />
It should be noted, this data is representative of all reported<br />
bicycle/pedestrian crashes – not necessarily all crashes that have<br />
occurred. Furthermore, the reports must have had enough information to<br />
be located properly. Differences in number of crashes per town may be<br />
the result of a difference in reporting, although there is no evidence to<br />
suggest a difference.<br />
Also, bicycle/pedestrian crashes are notoriously under-reported. It is not<br />
uncommon for bicyclists or pedestrians to decline reporting an incident<br />
with a vehicle if their injuries are too minor to warrant a hospital visit.<br />
Unfortunately, this lack of reporting diminishes the accuracy of a report<br />
like this, and does little to highlight problem areas in the county.<br />
BICYCLE AND PEDESTRIAN CRASH CLUSTERS<br />
As was done with the overall vehicular crash data, the individual<br />
bicycle/pedestrian crashes were grouped into clusters relevant to specific<br />
intersections. A cluster requires at least two incidents. The following table<br />
highlights the eight locations on <strong>Cape</strong> <strong>Cod</strong> that had at least two pedestrian<br />
related crashes (based on MassDOT data).<br />
TABLE 2: BARNSTABLE COUNTY PEDESTRIAN CRASH CLUSTERS, 2002-2008<br />
# <strong>Crash</strong>es Fatal Injury No Injury EPDO Major Minor Town<br />
2 1 1 0 15 Route 28 (Main St) Seaview Avenue Yarmouth<br />
2 0 2 0 10 Route 6/28 (Main St) St. Margarets Street Bourne<br />
2 0 2 0 10 Eldridge Avenue Lincoln Avenue Bourne<br />
2 0 2 0 10 Main Street Chatham Bars Avenue Chatham<br />
2 0 1 1 6 Route 6/28 (Main St) Holt Road Bourne<br />
2 0 1 1 6 Route 6A (Bradford St) Commercial Street Provincetown<br />
2 0 1 1 6 Route 28 (Main St) Forest Road Yarmouth<br />
2 0 0 2 2 Bourne Rotary Route 28 (Macarthur Blvd) Bourne<br />
<strong>Barnstable</strong> <strong>County</strong> <strong>High</strong> <strong>Crash</strong> <strong>Locations</strong> Page 19
Of the 139 total pedestrian-related crashes that occurred within<br />
<strong>Barnstable</strong> <strong>County</strong> from 2002-2008, there are only eight locations with<br />
more than one incident (and no location with more than two recorded<br />
incidents). While this analysis does not highlight any particular<br />
intersection as a location of critical concern, the data does suggest issues<br />
with particular corridors – especially along the county’s major roads.<br />
The MassDOT data from 2002-2008 have located 224 bicycle-related<br />
crashes. There are twenty six bicycle crash clusters for that time period,<br />
meaning twenty six locations with at least two bicycle-related crashes.<br />
Those locations are highlighted in the following table.<br />
TABLE 3: BARNSTABLE COUNTY BICYCLE CRASH CLUSTERS, 2002-2008<br />
# <strong>Crash</strong> Injury No Injury EPDO Major Minor Town<br />
5 4 1 21 Route 28 (Main St) West Yarmouth/Winslow Gray Rd Yarmouth<br />
4 4 0 20 Route 28 (Main St) Baxter Avenue Yarmouth<br />
3 3 0 15 West Yarmouth Road Buck Island Road Yarmouth<br />
3 3 0 15 Route 6A (Cranberry Hwy) Route 28 (Chatham Rd)/Canal Rd Orleans<br />
3 3 0 15 Route 28 (Main St) Queen Ann Rd/Crowell Rd/Depot Rd Chatham<br />
4 2 2 12 Route 6A (Bradford St) Standish Street Provincetown<br />
3 2 1 11 Route 28 (Main St) Hudson Road Yarmouth<br />
2 2 0 10 Route 134 (East West Dennis Rd) Route 6 (Mid <strong>Cape</strong> Hwy) Dennis<br />
2 2 0 10 Route 6 (GAR Hwy) Cahoons Hollow Road Wellfleet<br />
2 2 0 10 Route 6 (GAR Hwy) Hay Rd Eastham<br />
2 2 0 10 Route 28 (Main St) Springer Lane Yarmouth<br />
2 2 0 10 Route 28 (Main St) Pine Street Dennis<br />
2 2 0 10 Route 28 (Main St) Marigold Rd/Rosemary Ln Yarmouth<br />
2 2 0 10 Route 28 (Main St) East Main Street Yarm/Barn<br />
2 2 0 10 Route 6A (Cranberry Hwy) Main Street Orleans<br />
2 2 0 10 Dry Hollow Lane Weather Crescent Mashpee<br />
2 2 0 10 Route 28 (Chatham Rd) Main Street Orleans<br />
2 2 0 10 Route 28 (Main St) Seaview Avenue Yarmouth<br />
2 2 0 10 Route 6A (Cranberry Hwy) Eldredge Park Way Orleans<br />
4 1 3 8 Route 6A (Bradford St) Commercial Street Provincetown<br />
2 1 1 6 Route 134 (East West Dennis Rd) Upper <strong>County</strong> Road Dennis<br />
2 1 1 6 Route 28 (Main St) Depot Street Dennis<br />
2 1 1 6 Route 28 (Main St) Shad Hole Road Dennis<br />
2 1 1 6 Route 28 (Main St) Route 134 (East West Dennis Rd) Dennis<br />
2 0 2 2 Commercial Street Court Street Provincetown<br />
2 0 2 2 Route 6A (Bradford St) Shank Painter Road Provincetown<br />
Page 20<br />
<strong>Barnstable</strong> <strong>County</strong> <strong>High</strong> <strong>Crash</strong> <strong>Locations</strong>
Fatal <strong>Crash</strong> Database<br />
The Fatal <strong>Crash</strong> Database was started by the <strong>Cape</strong> <strong>Cod</strong> <strong>Commission</strong> in<br />
January of 2007 as a means of keeping track of all fatal crashes that take<br />
place in <strong>Barnstable</strong> <strong>County</strong>. Whenever a fatal crash occurs, the vital<br />
information is immediately added to the database, ensuring the records<br />
are always up to date. The vital information recorded includes location,<br />
time and date, direction of travel, type of crash, number of fatalities (and<br />
injuries), gender and age of those involved, and a brief description of the<br />
circumstances. The location is then mapped with GIS software and<br />
newspaper clippings of the event are digitally stored for future reference.<br />
The following table identifies how many fatal incidents have occurred in<br />
each town from January 1, 2007 to July 1, 2010.<br />
TABLE 4: FATAL CRASHES BY TOWN, 2007-2010<br />
Town 2007 2008 2009 2010* Total<br />
<strong>Barnstable</strong> 7 3 3 2 15<br />
Bourne 1 2 3 1 7<br />
Brewster 2 0 1 0 3<br />
Chatham 0 0 0 0 0<br />
Dennis 2 2 2 1 7<br />
Eastham 0 0 0 0 0<br />
Falmouth 4 4 3 0 11<br />
Harwich 1 0 2 0 3<br />
Mashpee 0 1 0 0 1<br />
Orleans 1 0 0 0 1<br />
Provincetown 0 0 0 0 0<br />
Sandwich 4 3 1 2 10<br />
Truro 1 0 0 0 1<br />
Wellfleet 2 1 0 1 4<br />
Yarmouth 2 0 0 0 2<br />
Total 27 16 15 7 65<br />
* As of July 1, 2010<br />
Source: <strong>Cape</strong> <strong>Cod</strong> <strong>Commission</strong><br />
<strong>Barnstable</strong> <strong>County</strong> <strong>High</strong> <strong>Crash</strong> <strong>Locations</strong> Page 21
FIGURE 3: BARNSTABLE COUNTY FATAL CRASHES, 2007-2010*<br />
* As of July 1, 2010<br />
Page 22<br />
<strong>Barnstable</strong> <strong>County</strong> <strong>High</strong> <strong>Crash</strong> <strong>Locations</strong>
Of the sixty five fatal crashes that have occurred in <strong>Barnstable</strong> <strong>County</strong><br />
since January of 2007, two have included bicycles and seven have<br />
included a pedestrian. The bulk of the fatal incidents have occurred on<br />
<strong>Cape</strong> <strong>Cod</strong>’s major roads – notably Route 28 in Bourne and Route 6 in<br />
<strong>Barnstable</strong>. The towns of <strong>Barnstable</strong>, Falmouth, and Sandwich have<br />
experienced the most fatal crashes, with fifteen, eleven, and ten,<br />
respectively. On all of the Outer-<strong>Cape</strong> (Eastham and north), there are only<br />
five fatal crashes – all of which occurred on Route 6. Four of those<br />
incidents were in Wellfleet, and one happened in Truro.<br />
Thirty three crashes were categorized as a lane departure. Additionally,<br />
there were three rear-end collisions, four side impact collisions, four at an<br />
angle, and ten head-on collisions. Forty one crashes included only one<br />
vehicle, while seventeen crashes involved two, six involved three, and one<br />
crash involved six vehicles.<br />
<strong>Barnstable</strong> <strong>County</strong> <strong>High</strong> <strong>Crash</strong> <strong>Locations</strong> Page 23
Summary<br />
The information provided in this report has been presented with the<br />
intention of serving as a resource to make <strong>Cape</strong> <strong>Cod</strong> safer for motorists,<br />
pedestrians, and bicyclists. There are many ways to create a list of most<br />
dangerous intersections, and each methodology has its strengths and<br />
weaknesses. For this reason, the <strong>Commission</strong> has produced four high<br />
crash lists without identification of a preferred option. The user is<br />
responsible for selecting the list which is most appropriate based on the<br />
desired outcome’s characteristics.<br />
Geolocating crashes is an effective method used in identifying high crash<br />
areas. Better crash data will lead to better analysis, the most accurate<br />
identification of problem areas, and the deployment of appropriate safety<br />
improvements. Incomplete or inaccurate crash reporting may lead to a<br />
missed opportunity of funds for a project. These records are used to<br />
bolster an argument for funding.<br />
At the end of November 2008, the <strong>Cape</strong> <strong>Cod</strong> <strong>Commission</strong> was sent 892<br />
non-geolocated crash records to be individually investigated. The crash<br />
records spanned the period from January 1 to November 11, 2008. Of the<br />
829 records sent, the <strong>Commission</strong> located 534 manually. The most<br />
common reasons for the initial problems with geolocating were spelling<br />
errors, vagueness in location description, and the use of abbreviations the<br />
GIS software could not compute. Although more than half of the nongeolocated<br />
crashes could be identified through manual inspection, still<br />
40% of the crashes lacked enough information to be located. MassDOT<br />
does not estimate crash locations, so these un-located crashes will not be<br />
evidence for project funding without further information.<br />
As of October 2008, sixty eight Massachusetts cities and towns have been<br />
submitting crash reports to the RMV electronically (six of the towns are<br />
located on <strong>Cape</strong> <strong>Cod</strong>). Taking advantage of this technology reduces the<br />
potential for erroneous information to be included in the RMV’s computer<br />
database.<br />
Accurate and comprehensive crash reporting will lead to better<br />
opportunities for safety improvements and focus further safety studies on<br />
the areas of most critical need.<br />
Page 24<br />
<strong>Barnstable</strong> <strong>County</strong> <strong>High</strong> <strong>Crash</strong> <strong>Locations</strong>