Hatching For The Future - teo seng capital berhad
Hatching For The Future - teo seng capital berhad
Hatching For The Future - teo seng capital berhad

Create successful ePaper yourself
Turn your PDF publications into a flip-book with our unique Google optimized e-Paper software.
Teo Seng Capital Berhad<br />
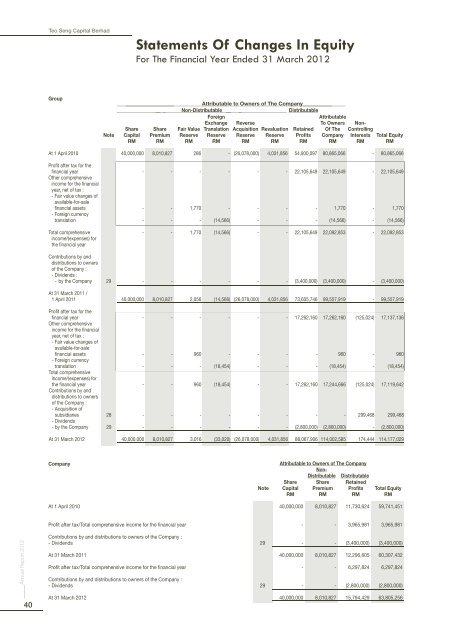
Statements Of Changes In Equity<br />
<strong>For</strong> <strong>The</strong> Financial Year Ended 31 March 2012<br />
Group<br />
__________________<br />
Attributable to Owners of <strong>The</strong> Company___________<br />
__ _ Non-Distributable __ _<br />
Distributable<br />
<strong>For</strong>eign<br />
Attributable<br />
Exchange Reverse To Owners Non-<br />
Share Share Fair Value Translation Acquisition Revaluation Retained Of <strong>The</strong> Controlling<br />
Note Capital Premium Reserve Reserve Reserve Reserve Profits Company Interests Total Equity<br />
RM RM RM RM RM RM RM RM RM RM<br />
At 1 April 2010 40,000,000 8,010,827 286 - (26,078,000) 4,031,856 54,900,097 80,865,066 - 80,865,066<br />
Profit after tax for the<br />
financial year - - - - - - 22,105,649 22,105,649 - 22,105,649<br />
Other comprehensive<br />
income for the financial<br />
year, net of tax :<br />
- Fair value changes of<br />
available-for-sale<br />
financial assets - - 1,770 - - - - 1,770 - 1,770<br />
- <strong>For</strong>eign currency<br />
translation - - - (14,566) - - - (14,566) - (14,566)<br />
Total comprehensive - - 1,770 (14,566) - - 22,105,649 22,092,853 - 22,092,853<br />
income/(expenses) for<br />
the financial year<br />
Contributions by and<br />
distributions to owners<br />
of the Company :<br />
- Dividends :<br />
- by the Company 29 - - - - - - (3,400,000) (3,400,000) - (3,400,000)<br />
At 31 March 2011 /<br />
1 April 2011 40,000,000 8,010,827 2,056 (14,566) (26,078,000) 4,031,856 73,605,746 99,557,919 - 99,557,919<br />
Profit after tax for the<br />
financial year - - - - - - 17,262,160 17,262,160 (125,024) 17,137,136<br />
Other comprehensive<br />
income for the financial<br />
year, net of tax :<br />
- Fair value changes of<br />
available-for-sale<br />
financial assets - - 960 - - - - 960 - 960<br />
- <strong>For</strong>eign currency<br />
translation - - - (18,454) - - - (18,454) - (18,454)<br />
Total comprehensive<br />
income/(expenses) for<br />
the financial year - - 960 (18,454) - - 17,262,160 17,244,666 (125,024) 17,119,642<br />
Contributions by and<br />
distributions to owners<br />
of the Company :<br />
- Acquisition of<br />
subsidiaries 28 - - - - - - - - 299,468 299,468<br />
- Dividends<br />
- by the Company 29 - - - - - - (2,800,000) (2,800,000) - (2,800,000)<br />
At 31 March 2012 40,000,000 8,010,827 3,016 (33,020) (26,078,000) 4,031,856 88,067,906 114,002,585 174,444 114,177,029<br />
Company<br />
Attributable to Owners of <strong>The</strong> Company<br />
Non-<br />
Distributable Distributable<br />
Share Share Retained<br />
Note Capital Premium Profits Total Equity<br />
RM RM RM RM<br />
At 1 April 2010 40,000,000 8,010,827 11,730,624 59,741,451<br />
Profit after tax/Total comprehensive income for the financial year - - 3,965,981 3,965,981<br />
Annual Report 2012<br />
40<br />
Contributions by and distributions to owners of the Company :<br />
- Dividends 29 - - (3,400,000) (3,400,000)<br />
At 31 March 2011 40,000,000 8,010,827 12,296,605 60,307,432<br />
Profit after tax/Total comprehensive income for the financial year - - 6,297,824 6,297,824<br />
Contributions by and distributions to owners of the Company :<br />
- Dividends 29 - - (2,800,000) (2,800,000)<br />
At 31 March 2012 40,000,000 8,010,827 15,794,429 63,805,256