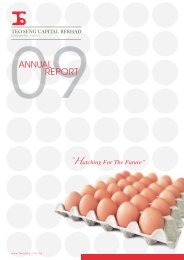
Hatching For The Future - teo seng capital berhad
Hatching For The Future - teo seng capital berhad
Hatching For The Future - teo seng capital berhad

You also want an ePaper? Increase the reach of your titles
YUMPU automatically turns print PDFs into web optimized ePapers that Google loves.
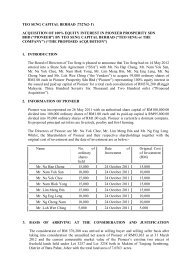
Teo Seng Capital Berhad<br />
Notes To <strong>The</strong> Financial Statements<br />
<strong>For</strong> <strong>The</strong> Financial Year Ended 31 March 2012<br />
5. PROPERTY, PLANT AND EQUIPMENT<br />
Group – At 31 March 2012<br />
* Freehold<br />
land, farm<br />
and poultry<br />
buildings<br />
*Leasehold<br />
land,<br />
freehold<br />
land and<br />
factory<br />
buildings<br />
Plant and<br />
machinery<br />
Fish pond<br />
and<br />
equipment<br />
Egg layer<br />
conveyor<br />
and cages<br />
system<br />
Motor<br />
vehicles,<br />
electrical<br />
installation,<br />
furniture,<br />
fittings,<br />
equipment,<br />
renovation Capital workin-progress<br />
and hostel<br />
RM RM RM RM RM RM RM RM<br />
Total<br />
At cost / valuation<br />
At 1 April 2011 62,647,601 13,446,482 32,295,751 - 28,869,268 22,718,739 2,289,161 162,267,002<br />
Additions 3,671,080 - 775,389 113,286 4,165,371 5,198,852 15,226,062 29,150,040<br />
Disposals (638,175) - - - - (541,007) - (1,179,182)<br />
Write off - - - - (1,061,957) (187,687) - (1,249,644)<br />
Acquisition of subsidiaries - 1,130,625 340,360 - - 778,647 - 2,249,632<br />
Reclassification 6,022,260 - 7,783,942 312,325 1,103,400 698,035 (15,919,962) -<br />
<strong>For</strong>eign exchange difference - - - - - 11,008 - 11,008<br />
At 31 March 2012 71,702,766 14,577,107 41,195,442 425,611 33,076,082 28,676,587 1,595,261 191,248,856<br />
Representing :<br />
At valuation - 10,512,166 - - - - - 10,512,166<br />
At cost 71,702,766 4,064,941 41,195,442 425,611 33,076,082 28,676,587 1,595,261 180,736,690<br />
71,702,766 14,577,107 41,195,442 425,611 33,076,082 28,676,587 1,595,261 191,248,856<br />
Less : Accumulated Depreciation<br />
At 1 April 2011 17,580,286 284,630 17,067,022 - 10,395,782 12,776,738 - 58,104,458<br />
Charge for the financial year 2,208,343 172,329 2,195,898 - 1,549,756 2,916,956 - 9,043,282<br />
Disposals - - - - - (408,641) - (408,641)<br />
Write off - - - - (1,021,155) (150,223) - (1,171,378)<br />
Acquisition of subsidiaries - 21,479 127,979 - - 346,924 - 496,382<br />
Reclassification (621) - 21,170 - - (20,549) - -<br />
<strong>For</strong>eign exchange difference - - - - - 3,708 - 3,708<br />
At 31 March 2012 19,788,008 478,438 19,412,069 - 10,924,383 15,464,913 - 66,067,811<br />
Representing :<br />
At valuation - 325,650 - - - - - 325,650<br />
At cost 19,788,008 152,788 19,412,069 - 10,924,383 15,464,913 - 65,742,161<br />
19,788,008 478,438 19,412,069 - 10,924,383 15,464,913 - 66,067,811<br />
Carrying amount<br />
At 31 March 2012 51,914,758 14,098,669 21,783,373 425,611 22,151,699 13,211,674 1,595,261 125,181,045<br />
Representing :<br />
At valuation - 10,186,516 - - - - - 10,186,516<br />
At cost 51,914,758 3,912,153 21,783,373 425,611 22,151,699 13,211,674 1,595,261 114,994,529<br />
51,914,758 14,098,669 21,783,373 425,611 22,151,699 13,211,674 1,595,261 125,181,045<br />
Annual Report 2012<br />
61