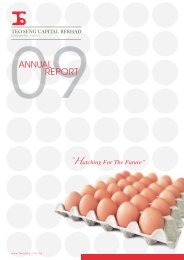
Hatching For The Future - teo seng capital berhad
Hatching For The Future - teo seng capital berhad
Hatching For The Future - teo seng capital berhad

You also want an ePaper? Increase the reach of your titles
YUMPU automatically turns print PDFs into web optimized ePapers that Google loves.
Teo Seng Capital Berhad<br />
Notes To <strong>The</strong> Financial Statements<br />
<strong>For</strong> <strong>The</strong> Financial Year Ended 31 March 2012<br />
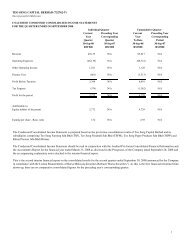
5.<br />
PROPERTY, PLANT AND EQUIPMENT (cont’d)<br />
* <strong>The</strong> freehold land, leasehold land, farm and poultry buildings and factory buildings of the Group consists of :<br />
Freehold land, farm and poultry buildings Leasehold land, freehold land and factory buildings<br />
Farm and<br />
Freehold poultry Freehold Leasehold Factory<br />
land buildings Total land land buildings Total<br />
RM RM RM RM RM RM RM<br />
At cost / valuation<br />
At 1 April 2011 15,712,992 46,934,609 62,647,601 4,343,530 1,878,243 7,224,709 13,446,482<br />
Additions 2,567,722 1,103,358 3,671,080 - - - -<br />
Disposal (638,175) - (638,175) - - - -<br />
Acquisition of subsidiaries - - - 204,600 - 926,025 1,130,625<br />
Reclassification - 6,022,260 6,022,260 - - - -<br />
At 31 March 2012 17,642,539 54,060,227 71,702,766 4,548,130 1,878,243 8,150,734 14,577,107<br />
Representing :<br />
At valuation - - - 4,343,530 - 6,168,636 10,512,166<br />
At cost 17,642,539 54,060,227 71,702,766 204,600 1,878,243 1,982,098 4,064,941<br />
17,642,539 54,060,227 71,702,766 4,548,130 1,878,243 8,150,734 14,577,107<br />
Less : Accumulated<br />
depreciation<br />
At 1 April 2011 - 17,580,286 17,580,286 - 45,997 238,633 284,630<br />
Charge for the financial<br />
year - 2,208,343 2,208,343 - 20,656 151,673 172,329<br />
Acquisition of subsidiaries - - - - - 21,479 21,479<br />
Reclassification - (621) (621) - - - -<br />
At 31 March 2012 - 19,788,008 19,788,008 - 66,653 411,785 478,438<br />
Representing :<br />
At valuation - - - - - 325,650 325,650<br />
At cost - 19,788,008 19,788,008 - 66,653 86,135 152,788<br />
- 19,788,008 19,788,008 - 66,653 411,785 478,438<br />
Carrying amount<br />
At 31 March 2012 17,642,539 34,272,219 51,914,758 4,548,130 1,811,590 7,738,949 14,098,669<br />
Representing :<br />
At valuation - - - 4,343,530 - 5,842,986 10,186,516<br />
At cost 17,642,539 34,272,219 51,914,758 204,600 1,811,590 1,895,963 3,912,153<br />
17,642,539 34,272,219 51,914,758 4,548,130 1,811,590 7,738,949 14,098,669<br />
Annual Report 2012<br />
62