WFDB Applications Guide - PhysioNet
WFDB Applications Guide - PhysioNet
WFDB Applications Guide - PhysioNet
Create successful ePaper yourself
Turn your PDF publications into a flip-book with our unique Google optimized e-Paper software.
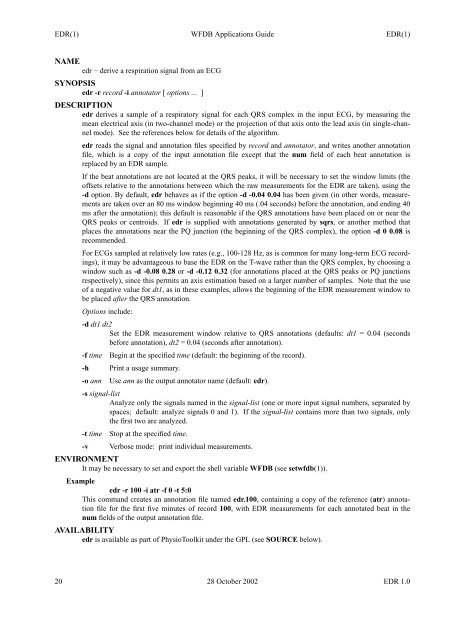
EDR(1) <strong>WFDB</strong> <strong>Applications</strong> <strong>Guide</strong> EDR(1)<br />
NAME<br />
edr − derive a respiration signal from an ECG<br />
SYNOPSIS<br />
edr -r record -i annotator [ options ... ]<br />
DESCRIPTION<br />
edr derives asample of a respiratory signal for each QRS complex inthe input ECG, by measuring the<br />
mean electrical axis (in two-channel mode) or the projection of that axis onto the lead axis (in single-channel<br />
mode). See the references below for details of the algorithm.<br />
edr reads the signal and annotation files specified by record and annotator, and writes another annotation<br />
file, which is a copy ofthe input annotation file except that the num field of each beat annotation is<br />
replaced by an EDR sample.<br />
If the beat annotations are not located at the QRS peaks, it will be necessary to set the window limits (the<br />
offsets relative to the annotations between which the raw measurements for the EDR are taken), using the<br />
-d option. By default, edr behaves asifthe option -d -0.04 0.04 has been given (in other words, measurements<br />
are taken over an80mswindow beginning 40 ms (.04 seconds) before the annotation, and ending 40<br />
ms after the annotation); this default is reasonable if the QRS annotations have been placed on or near the<br />
QRS peaks or centroids. If edr is supplied with annotations generated by sqrs, oranother method that<br />
places the annotations near the PQ junction (the beginning of the QRS complex), the option -d 0 0.08 is<br />
recommended.<br />
For ECGs sampled at relatively low rates (e.g., 100-128 Hz, as is common for many long-term ECG recordings),<br />
it may be advantageous to base the EDR on the T-wave rather than the QRS complex, by choosing a<br />
window such as -d -0.08 0.28 or -d -0.12 0.32 (for annotations placed at the QRS peaks or PQ junctions<br />
respectively), since this permits an axis estimation based on a larger number of samples. Note that the use<br />
of a negative value for dt1, asinthese examples, allows the beginning of the EDR measurement window to<br />
be placed after the QRS annotation.<br />
Options include:<br />
-d dt1 dt2<br />
Set the EDR measurement window relative to QRS annotations (defaults: dt1 =0.04 (seconds<br />
before annotation), dt2 =0.04 (seconds after annotation).<br />
-f time Begin at the specified time (default: the beginning of the record).<br />
-h Print a usage summary.<br />
-o ann Use ann as the output annotator name (default: edr).<br />
-s signal-list<br />
Analyze only the signals named in the signal-list (one or more input signal numbers, separated by<br />
spaces; default: analyze signals 0 and 1). If the signal-list contains more than two signals, only<br />
the first two are analyzed.<br />
-t time Stop at the specified time.<br />
-v Verbose mode: print individual measurements.<br />
ENVIRONMENT<br />
It may be necessary to set and export the shell variable <strong>WFDB</strong> (see setwfdb(1)).<br />
Example<br />
edr -r 100 -i atr -f 0 -t 5:0<br />
This command creates an annotation file named edr.100, containing a copy ofthe reference (atr) annotation<br />
file for the first five minutes of record 100, with EDR measurements for each annotated beat in the<br />
num fields of the output annotation file.<br />
AVAILABILITY<br />
edr is available as part of PhysioToolkit under the GPL (see SOURCE below).<br />
20 28 October 2002 EDR 1.0


