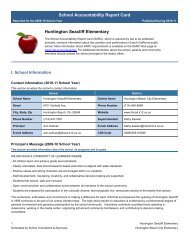
School Accountability Report Card John H. Eader Elementary
School Accountability Report Card John H. Eader Elementary
School Accountability Report Card John H. Eader Elementary

You also want an ePaper? Increase the reach of your titles
YUMPU automatically turns print PDFs into web optimized ePapers that Google loves.
<strong>School</strong> <strong>Accountability</strong> <strong>Report</strong> <strong>Card</strong><br />
<strong>Report</strong>ed for the 2009-10 <strong>School</strong> Year Published During 2010-11<br />
<strong>John</strong> H. <strong>Eader</strong> <strong>Elementary</strong><br />
The <strong>School</strong> <strong>Accountability</strong> <strong>Report</strong> <strong>Card</strong> (SARC), which is required by law to be published<br />
annually, contains information about the condition and performance of each California public<br />
school. More information about SARC requirements is available on the SARC Web page at<br />
www.cde.ca.gov/ta/ac/sa/. For additional information about the school, parents and community<br />
members should contact the school principal or the district office.<br />
I. <strong>School</strong> Information<br />
Contact Information (2010-11 <strong>School</strong> Year)<br />
This section provides the school’s contact information.<br />
<strong>School</strong><br />
District<br />
<strong>School</strong> Name <strong>John</strong> H. <strong>Eader</strong> <strong>Elementary</strong> District Name Huntington Beach City <strong>Elementary</strong><br />
Street 9291 Banning Ave. Phone Number (714) 964-8888<br />
City, State, Zip Huntington Beach, CA, 92646-8302 Website www.hbcsd.k12.ca.us<br />
Phone Number 714.962.2451 Superintendent Kathy Kessler<br />
Principal Cynthia Guerrero E-mail Address Kathy.kesser@hbcsd.k12.ca.us<br />
E-mail Address cynthia.guerrero@hbcsd.k12.ca.us CDS Code 30665306028864<br />
Principal’s Message (2009-10 <strong>School</strong> Year)<br />
This section provides information about the school, its programs and its goals.<br />
Our mission as the <strong>Eader</strong> <strong>School</strong> community is to provide a safe and appropriate environment in which ALL students LEARN. WE do<br />
this by working as a team and by modeling our expectations. <strong>Eader</strong> students will reach their individual potential in order to be an asset<br />
to society.<br />
"It's a great day....to be an <strong>Eader</strong> Eagle!"<br />
An exemplary school provides a warm, inviting climate that enables students to enjoy their elementary school experience and results in<br />
a shared sense of pride in the school. At <strong>Eader</strong> <strong>School</strong>, the following commitments guide our actions toward our shared vision:<br />
1. All students can learn and achieve high standards of learning.<br />
2. Students need to not only develop a deep understanding of essential knowledge and skills, but also need to develop the capacity<br />
to apply their learning, and to reason, solve problems, and produce quality work.<br />
3. Each student is a valued individual with unique physical, social, emotional, and intellectual needs.<br />
4. A safe and supportive learning environment promotes student achievement.<br />
5. The development of the curriculum, design of instructional activities, and the use of assessment measures are focused on<br />
providing learning opportunities and feedback systems that enable students to achieve success.<br />
1 <strong>John</strong> H. <strong>Eader</strong> <strong>Elementary</strong><br />
Generated by <strong>School</strong> Innovations & Advocacy<br />
Huntington Beach City <strong>Elementary</strong>
<strong>School</strong> <strong>Accountability</strong> <strong>Report</strong> <strong>Card</strong><br />
<strong>Report</strong>ed for the 2009-10 <strong>School</strong> Year Published During 2010-11<br />
6. The allocation of our resources (e.g. staffing, time, instructional resources, facilities, financial resources) in alignment with our<br />
mission and goals helps to maximize the opportunity for students to learn and experience success in schools.<br />
7. Effective collaboration and communication with families, as partners in the education of their children, is essential to the success<br />
of our school.<br />
8. Teachers, administrators, parents, and the community share the responsibility for advancing the schools mission and goals.<br />
9. Diversity enriches our school through the recognition of the contributions of a variety of ideas, values, and cultures.<br />
<strong>Eader</strong> <strong>School</strong> is a pre-school through 5th grade elementary school providing a stimulating quality educational program for 602 students,<br />
including two special day classes, 20 regular education classes, a resource program, GATE cluster classes, and English Learners<br />
program on a traditional school calendar. <strong>Eader</strong>'s fee-based preschool program embarked on its inaugural year in Fall 2007 with two<br />
classes that focus on literacy and arts education. <strong>Eader</strong> staff implements standards based education while responding to the individual<br />
needs of students as measured by state and local tests. Student progress monitoring is reviewed regularly with curriculum based<br />
measures, trimesterly with local measures, and annually on statewide exams. Programs unique to <strong>Eader</strong> are the MIND Institute which<br />
is a spatial-temporal reasoning math program, K-5 Music Program, Earobics, Step Up to Writing, My Access!, Thinking Maps, and<br />
CATCH-PE which supplement our district-wide adoptions in English/Language Arts, Math, Science, and Social Science. Of course, our<br />
outstanding parent involvement supported by our PTA extends student learning and community building activities such as Family<br />
Reading Night, Family Dinner Night, field trips and assemblies, and Art Masters to name a few. Volunteers log in over 15,000 hours to<br />
programs such as Surf Tales, in-class activities, math centers, reading centers, organizing school and community fundraisers, and<br />
contriubting to decision-making committees. The school is located in the southeastern section of Huntington Beach. The boundaries<br />
for <strong>Eader</strong> <strong>School</strong> include the Santa Ana River to the east, Atlanta to the north, Magnolia to the west, and Pacific Coast Highway to the<br />
south. <strong>Eader</strong> <strong>School</strong> has served the community since 1966.<br />
Parental Involvement (2009-10 <strong>School</strong> Year)<br />
This section provides information about opportunities for parents to become involved with school activities.<br />
Contact Person Name: Kelly Solorzano Contact Person Phone Number: 714-962-2451<br />
Parents and the community are very supportive of the educational programs at <strong>Eader</strong> <strong>School</strong>. The PTA and the Huntington Beach<br />
Education Foundation have made generous contributions of time and money to numerous programs and activities. PTA fundraisers<br />
enable the school to offer programs in art, music, and reading, and they also enrich classroom learning experiences through donations<br />
that support assemblies and field trips, and/or purchase instructional supplies.<br />
<strong>Eader</strong> <strong>School</strong>'s PTA was named the 1993 Outstanding Education Partnership Serving An <strong>Elementary</strong> <strong>School</strong> by the California <strong>School</strong><br />
Volunteer Partnership, Inc. <strong>Eader</strong> <strong>School</strong> was also nominated for Redbook's America's Best <strong>School</strong>s Project in 1993. The Huntington<br />
Beach Education Foundation, a joint business and educational partnership, provides funding for teacher mini-grants, classroom<br />
speakers, supplemental materials and supports the Parent Empowerment Academy.<br />
Average Class Size and Class Size Distribution (<strong>Elementary</strong>)<br />
This table displays by grade level the average class size and the number of classrooms that fall into each size category (a range of total<br />
students per classroom).<br />
2007-08 2008-09 2009-10<br />
Avg.<br />
Number of Classrooms<br />
Avg.<br />
Number of Classrooms<br />
Avg.<br />
Class<br />
Class<br />
Class<br />
Number of Classrooms<br />
Grade Level Size 1-20 21-32 33+ Size 1-20 21-32 33+ Size 1-20 21-32 33+<br />
Click Click Click Click<br />
Kindergarten 32 0 2 2 28 0 5 0<br />
here here here to here<br />
to to enter to<br />
enter enter text. enter<br />
2 <strong>John</strong> H. <strong>Eader</strong> <strong>Elementary</strong><br />
Generated by <strong>School</strong> Innovations & Advocacy<br />
Huntington Beach City <strong>Elementary</strong>
<strong>School</strong> <strong>Accountability</strong> <strong>Report</strong> <strong>Card</strong><br />
<strong>Report</strong>ed for the 2009-10 <strong>School</strong> Year Published During 2010-11<br />
text. text. text.<br />
Grade 1 20 5 0 0 20 5 0 0<br />
Grade 2 19 4 0 0 20 4 0 0<br />
Grade 3 34 0 0 2 28 0 3 0<br />
Grade 4 31 0 2 0 30 0 3 0<br />
Grade 5 32 0 2 0 34 0 0 3<br />
Grade 6 0 0 0 0 0 0 0 0<br />
K-3 20 2 0 0 20 1 0 0<br />
3-4 33 0 0 1 0 0 0 0<br />
4-8 32 0 1 0 0 0 0 0<br />
Other 6 1 0 0 0 0 0 0<br />
Click<br />
here<br />
to<br />
enter<br />
text.<br />
Click<br />
here<br />
to<br />
enter<br />
text.<br />
Click<br />
here<br />
to<br />
enter<br />
text.<br />
Click<br />
here<br />
to<br />
enter<br />
text.<br />
Click<br />
here<br />
to<br />
enter<br />
text.<br />
Click<br />
here<br />
to<br />
enter<br />
text.<br />
Click<br />
here<br />
to<br />
enter<br />
text.<br />
Click<br />
here<br />
to<br />
enter<br />
text.<br />
Click<br />
here<br />
to<br />
enter<br />
text.<br />
Click<br />
here<br />
to<br />
Click<br />
here<br />
to<br />
enter<br />
text.<br />
Click<br />
here<br />
to<br />
enter<br />
text.<br />
Click<br />
here<br />
to<br />
enter<br />
text.<br />
Click<br />
here<br />
to<br />
enter<br />
text.<br />
Click<br />
here<br />
to<br />
enter<br />
text.<br />
Click<br />
here<br />
to<br />
enter<br />
text.<br />
Click<br />
here<br />
to<br />
enter<br />
text.<br />
Click<br />
here<br />
to<br />
enter<br />
text.<br />
Click<br />
here<br />
to<br />
enter<br />
text.<br />
Click<br />
here<br />
to<br />
Click<br />
here to<br />
enter<br />
text.<br />
Click<br />
here to<br />
enter<br />
text.<br />
Click<br />
here to<br />
enter<br />
text.<br />
Click<br />
here to<br />
enter<br />
text.<br />
Click<br />
here to<br />
enter<br />
text.<br />
Click<br />
here to<br />
enter<br />
text.<br />
Click<br />
here to<br />
enter<br />
text.<br />
Click<br />
here to<br />
enter<br />
text.<br />
Click<br />
here to<br />
enter<br />
text.<br />
Click<br />
here to<br />
enter<br />
Click<br />
here<br />
to<br />
enter<br />
text.<br />
Click<br />
here<br />
to<br />
enter<br />
text.<br />
Click<br />
here<br />
to<br />
enter<br />
text.<br />
Click<br />
here<br />
to<br />
enter<br />
text.<br />
Click<br />
here<br />
to<br />
enter<br />
text.<br />
Click<br />
here<br />
to<br />
enter<br />
text.<br />
Click<br />
here<br />
to<br />
enter<br />
text.<br />
Click<br />
here<br />
to<br />
enter<br />
text.<br />
Click<br />
here<br />
to<br />
enter<br />
text.<br />
Click<br />
here<br />
to<br />
3 <strong>John</strong> H. <strong>Eader</strong> <strong>Elementary</strong><br />
Generated by <strong>School</strong> Innovations & Advocacy<br />
Huntington Beach City <strong>Elementary</strong>
<strong>School</strong> <strong>Accountability</strong> <strong>Report</strong> <strong>Card</strong><br />
<strong>Report</strong>ed for the 2009-10 <strong>School</strong> Year Published During 2010-11<br />
enter<br />
text.<br />
enter<br />
text.<br />
text.<br />
enter<br />
text.<br />
Student Enrollment by Grade Level (2009-10 <strong>School</strong> Year)<br />
This table displays the number of students enrolled in each grade level at the school.<br />
Grade Level Number of Students Grade Level Number of Students<br />
Kindergarten 94 Grade 8 0<br />
Grade 1 111 Ungraded <strong>Elementary</strong> 0<br />
Grade 2 82 Grade 9 0<br />
Grade 3 106 Grade 10 0<br />
Grade 4 88 Grade 11 0<br />
Grade 5 92 Grade 12 0<br />
Grade 6 0 Ungraded Secondary 0<br />
Grade 7 0 Total Enrollment 573<br />
Student Enrollment by Group (2009-10 <strong>School</strong> Year)<br />
This table displays the percent of students enrolled at the school who are identified as being in a particular group.<br />
Percent of Total<br />
Percent of Total<br />
Group<br />
Group<br />
Enrollment<br />
Enrollment<br />
Black or African American 1.0% White (not Hispanic) 75.0%<br />
American Indian or Alaska Native 0.0% Two or More Races 5.0%<br />
Asian 6.0% Socioeconomically Disadvantaged 11.0%<br />
Filipino 1.0% English Learners 5.0%<br />
Hispanic or Latino 11.0% Students with Disabilities 10.0%<br />
Native Hawaiian or Pacific Islander 0.0% n/a --<br />
II. <strong>School</strong> Safety and Facilities<br />
<strong>School</strong> Safety Plan (2009-10)<br />
This section provides information about the school’s comprehensive safety plan.<br />
Date <strong>School</strong> Safety Plan last reviewed: Click here to enter text.<br />
4 <strong>John</strong> H. <strong>Eader</strong> <strong>Elementary</strong><br />
Generated by <strong>School</strong> Innovations & Advocacy<br />
Huntington Beach City <strong>Elementary</strong>
<strong>School</strong> <strong>Accountability</strong> <strong>Report</strong> <strong>Card</strong><br />
<strong>Report</strong>ed for the 2009-10 <strong>School</strong> Year Published During 2010-11<br />
Many people visit the campus to volunteer in the classroom and participate in school events. Parents and visitors are welcomed and<br />
required to check in at the school office upon arrival and obtain a visitors badge; visitors are required to return to the school office upon<br />
departure. During lunch, recesses, and before and after school, yard supervisors and teachers monitor students and school grounds,<br />
including the cafeteria and playgrounds, to ensure a safe and orderly environment. The Comprehensive Safe <strong>School</strong> Plan was<br />
developed by the district to comply with Senate Bill 187 (SB 187) of 1997. The plan provides students and staff a means of ensuring a<br />
safe and orderly learning environment. Each school includes the following requirements of SB 187 within their safe school plans:<br />
current status of school crime; child abuse reporting procedures; disaster procedures, routine and emergency; policies related to<br />
suspension and expulsion; notification to teachers; sexual harassment policy; provision of a school-wide dress code; safe ingress and<br />
egress of pupils, parents, and school employees; safe and orderly school environment; and school rules and procedures. The school<br />
evaluates the plan annually and updates it as needed. Safety procedures, including elements of the Safe <strong>School</strong> Plan, are reviewed<br />
with school and district staff in the fall, at the start of each school year. The plan was last updated and reviewed with school staff in<br />
October 2005. The district progressively addresses structural needs at each school to ensure facilities are safe and comply with<br />
education codes as well as building and safety regulations. Recent improvements at the <strong>Eader</strong> campus include the upgrade of water<br />
lines, modernization of classrooms and restrooms, resurfacing of the playground, construction of a new parking lot, installation of new<br />
playground equipment, and installation of a new telephone system. A $30 million bond (Measure DD) combined with a $17 million Prop<br />
47 allocation provides the necessary funding for districtwide modernization efforts. <strong>Eader</strong> <strong>School</strong> is projected to receive an<br />
apportionment of $4.7 million for its upgrades and modernization projects.<br />
Suspensions & Expulsions<br />
This table displays the rate of suspensions and expulsions (the total number of incidents divided by the total enrollment) at the school<br />
and district levels for the most recent three-year period.<br />
<strong>School</strong><br />
District<br />
2007-08 2008-09 2009-10 2007-08 2008-09 2009-10<br />
Suspension Rate 0.0% 1.0% 1.0% 5.0% 2.0% 4.0%<br />
Expulsion Rate 0.0% 0.0% 0% 0.0% 0.0% 0%.<br />
<strong>School</strong> Facility Conditions<br />
This section provides information about the condition of the school’s grounds, buildings, and restrooms, and a description of any<br />
planned or recently completed facility improvements.<br />
<strong>Eader</strong> <strong>School</strong>, constructed in 1965, consists of 9 separate buildings including an administration building with office and library, a<br />
multipurpose room, seven classroom buildings with 24 total classrooms and a computer lab. The site also has 8 portable classrooms,<br />
added in the 1990’s and a YMCA portable building used for before and after school child care.<br />
Wooden ramps were replaced with concrete ramps on 8 portable buildings. Carpet was replaced in 4 portable classrooms. Floors were<br />
tiled in 2 student restrooms and 2 staff restrooms. The main parking lot was repaired, sealed and striped. Rain gutters were replaced on<br />
all permanent buildings.<br />
Interior and exterior lighting was upgraded with more efficient lighting in all areas. Lighting sensors were installed in all classrooms and<br />
restroom buildings.<br />
Facilities are inspected continuously by custodial and maintenance personnel and work orders are submitted as needed.<br />
.<br />
5 <strong>John</strong> H. <strong>Eader</strong> <strong>Elementary</strong><br />
Generated by <strong>School</strong> Innovations & Advocacy<br />
Huntington Beach City <strong>Elementary</strong>
<strong>School</strong> <strong>Accountability</strong> <strong>Report</strong> <strong>Card</strong><br />
<strong>Report</strong>ed for the 2009-10 <strong>School</strong> Year Published During 2010-11<br />
Planned Improvements (2010-11 <strong>School</strong> Year)<br />
N.A.<br />
<strong>School</strong> Facility Good Repair Status (2010-11 <strong>School</strong> Year)<br />
This table displays the results of the most recently completed school site inspection to determine the school facility’s good repair status.<br />
Item Inspected<br />
Repair Status<br />
Good Fair Poor<br />
Repair Needed and<br />
Action Taken or Planned<br />
Systems: Gas Systems and Pipes, Mechanical Systems<br />
(heating, ventilation, and air conditioning), Sewer<br />
X<br />
Click here to enter text.<br />
Interior: Interior Surfaces (floors, ceilings, walls, and<br />
window casings)<br />
X<br />
Click here to enter text.<br />
Cleanliness: Pest/Vermin Control, Overall Cleanliness<br />
(school grounds, buildings, rooms, and common areas)<br />
X<br />
Click here to enter text.<br />
Electrical: Electrical Systems (interior and exterior) X Click here to enter text.<br />
Restrooms/Fountains: Restrooms, Sinks/Drinking<br />
Fountains (interior and exterior)<br />
X<br />
Click here to enter text.<br />
Safety: Fire Safety Equipment, Emergency Systems,<br />
Hazardous Materials (interior and exterior)<br />
X<br />
Click here to enter text.<br />
Structural: Structural Condition, Roofs X Click here to enter text.<br />
External: Windows/Doors/Gates/Fences,<br />
Playgrounds/<strong>School</strong> Grounds<br />
X<br />
Click here to enter text.<br />
Overall Summary of <strong>School</strong> Facility Good Repair Status (2010-11 <strong>School</strong> Year)<br />
Facility Condition<br />
Exemplary Good Fair Poor<br />
Overall Summary<br />
X<br />
Date of inspection: March 4, 2011<br />
Completion date of inspection form: March 25, 2011<br />
6 <strong>John</strong> H. <strong>Eader</strong> <strong>Elementary</strong><br />
Generated by <strong>School</strong> Innovations & Advocacy<br />
Huntington Beach City <strong>Elementary</strong>
<strong>School</strong> <strong>Accountability</strong> <strong>Report</strong> <strong>Card</strong><br />
<strong>Report</strong>ed for the 2009-10 <strong>School</strong> Year Published During 2010-11<br />
III. Curriculum and Academics<br />
Quality, Currency, and Availability of Textbooks and Instructional Materials (2010-11 <strong>School</strong> Year)<br />
This section provides information about the quality, currency, and availability of the standards-aligned textbooks and other instructional<br />
materials used at the school, and information about the school’s use of any supplemental curriculum or non-adopted textbooks or<br />
instructional materials.<br />
Pursuant to the settlement of Williams vs. the State of California, Huntington Beach City <strong>School</strong> District thoroughly inspected each of its<br />
school sites at the start of the 2008-09 school year to determine whether or not each school had sufficient and good quality textbooks,<br />
instructional materials, and/or science laboratory equipment.<br />
All students, including English Learners, are required to be given their own individual textbooks and/or instructional materials (in core<br />
subjects), for use in the classroom. Additionally, all textbooks and instructional materials used within the District must be aligned with<br />
the California State Content Standards and frameworks, with final approval by the Board of Education.<br />
Textbook and Instructional Materials List<br />
Textbooks and instructional materials used in the district in the core subject areas of English-Language Arts, Mathematics, Science,<br />
and History-Social Science.<br />
Subject Area Textbook Title and/or Publisher Year of<br />
Adoption<br />
English-Language Arts Houghton Mifflin 2003<br />
History-Social Science Scott Foresman - K-1, Houghton Mifflin 2007, 2007<br />
Mathematics Houghton Mifflin 2002<br />
Other The Medallion Edition 2009<br />
Science Pearson Scott Foresman 2008<br />
Availability of Textbooks and Instructional Materials<br />
This table displays information about the percent of pupils who lack their own assigned textbooks and instructional materials<br />
Core Curriculum Area<br />
Percent of Pupils Who Lack Their Own Assigned<br />
Textbooks and Instructional Materials<br />
Reading/Language Arts 0.0%<br />
Mathematics 0.0%<br />
7 <strong>John</strong> H. <strong>Eader</strong> <strong>Elementary</strong><br />
Generated by <strong>School</strong> Innovations & Advocacy<br />
Huntington Beach City <strong>Elementary</strong>
<strong>School</strong> <strong>Accountability</strong> <strong>Report</strong> <strong>Card</strong><br />
<strong>Report</strong>ed for the 2009-10 <strong>School</strong> Year Published During 2010-11<br />
Science 0.0%<br />
History-Social Science 0.0%<br />
Foreign Language 0.0%<br />
Health 0.0%<br />
Visual and Performing Arts 0.0%<br />
Science Laboratory Equipment (Grades 9-12)<br />
N.A.<br />
Textbook Information Collection Date: October, 2009<br />
Textbooks and Instructional Materials Adoption<br />
This table displays whether the textbooks and instructional materials are from the most recent adoption.<br />
Most recent SBE or Local Governing Agency Approved Textbooks and Instructional Materials<br />
Yes or No<br />
Yes.<br />
Textbook Insufficiency (if applicable)<br />
This section provides information if any insufficiency exists, and the reason that each pupil does not have sufficient textbooks or<br />
instructional materials<br />
N.A.<br />
Standardized Testing and <strong>Report</strong>ing Program<br />
The Standardized Testing and <strong>Report</strong>ing (STAR) Program consists of several key components, including the California Standards<br />
Tests (CSTs); the California Modified Assessment (CMA), and the California Alternate Performance Assessment (CAPA). The<br />
assessments under the STAR program show how well students are doing in relation to the state content standards. The CSTs include<br />
English-language arts (ELA) and mathematics in grades two through eleven; science in grades five, eight, and nine through eleven; and<br />
history-social science in grades eight, and nine through eleven. The CAPA includes ELA and mathematics in grades two through<br />
eleven, and science for grades five, eight, and ten. The CAPA is given to those students with significant cognitive disabilities whose<br />
disabilities prevent them from taking either the CSTs with accommodations or modifications or the CMA with accommodations. The<br />
CMA is an alternate assessment that is based on modified achievement standards in ELA for grades three through nine, mathematics<br />
for grades three through seven and Algebra I and science in grades five, eight, and ten. The CMA is designed to assess those students<br />
whose disabilities preclude them from achieving grade-level proficiency on an assessment of the California content standards with or<br />
without accommodations. On each of these assessments, student scores are reported as performance levels. Detailed information<br />
regarding the STAR Program results for each grade and performance level, including the percent of students not tested, can be found<br />
on the CDE Standardized Testing and <strong>Report</strong>ing (STAR) Results Web site at http://star.cde.ca.gov.<br />
Note: Scores are not shown when the number of students tested is ten or less, either because the number of students in this category<br />
is too small for statistical accuracy or to protect student privacy. In no case shall any group score be reported that would deliberately or<br />
inadvertently make public the score or performance of any individual student.<br />
8 <strong>John</strong> H. <strong>Eader</strong> <strong>Elementary</strong><br />
Generated by <strong>School</strong> Innovations & Advocacy<br />
Huntington Beach City <strong>Elementary</strong>
<strong>School</strong> <strong>Accountability</strong> <strong>Report</strong> <strong>Card</strong><br />
<strong>Report</strong>ed for the 2009-10 <strong>School</strong> Year Published During 2010-11<br />
Standardized Testing and <strong>Report</strong>ing Results for All Students – Three-Year Comparison<br />
This table displays the percent of students achieving at the Proficient or Advanced level (meeting or exceeding the state standards).<br />
<strong>School</strong> District State<br />
Subject<br />
2007-08 2008-09 2009-10 2007-08 2008-09 2009-10 2007-08 2008-09 2009-10<br />
English-Language Arts 71.0% 76.0% 76.0% 70.0% 77.0% 77.0% 46.0% 50.0% 52.0%<br />
Mathematics 72.0% 79.0% 79.0% 70.0% 74.0% 74.0% 43.0% 46.0% 48.0%<br />
Science 70.0% 79.0% 79.0% 75.0% 82.0% 82.0% 46.0% 50.0% 54.0%<br />
Social Science 0.0% 0.0% 0.0% 54.0% 65.0% 65.0% 36.0% 41.0% 44.0%<br />
Standardized Testing and <strong>Report</strong>ing Results by Student Group – Most Recent Year<br />
This table displays the percent of students, by group, achieving at the Proficient or Advanced level (meeting or exceeding the state<br />
standards) for the most recent testing period.<br />
Group<br />
Percentage of Students Scoring at Proficient or Advanced Level<br />
English-<br />
Language Arts<br />
Mathematics<br />
Science<br />
History-Social<br />
Science<br />
All Students in the District 77.0% 74.0% 82.0% 65.0%<br />
All Students at the <strong>School</strong> 76.0% 79.0% 79.0% 0.0%<br />
Black or African American * * *<br />
American Indian or Alaska Native<br />
Asian 58.0% 75.0% *<br />
Filipino * * *<br />
Hispanic or Latino 68.0% 70.0% 75.0%<br />
Native Hawaiian or Pacific Islander<br />
White (not Hispanic) 80.0% 80.0% 82.0%<br />
Two or More Races<br />
Click here to<br />
enter text.<br />
Click here to<br />
enter text.<br />
Click here to<br />
enter text.<br />
Male 75.0% 79.0% 79.0%<br />
Female 78.0% 79.0% 79.0%<br />
Economically Disadvantaged 61.0% 70.0% *<br />
English Learners 29.0% 71.0% *<br />
Students with Disabilities 76.0% 82.0% *<br />
Students Receiving Migrant Education Services<br />
Click here to<br />
enter text.<br />
California Physical Fitness Test Results (<strong>School</strong> Year 2009-10)<br />
The California Physical Fitness Test is administered to students in grades 5, 7, and 9 only. This table displays by grade level the<br />
percent of students meeting the healthy fitness zone on all six fitness standards for the most recent testing period. Detailed information<br />
9 <strong>John</strong> H. <strong>Eader</strong> <strong>Elementary</strong><br />
Generated by <strong>School</strong> Innovations & Advocacy<br />
Huntington Beach City <strong>Elementary</strong>
<strong>School</strong> <strong>Accountability</strong> <strong>Report</strong> <strong>Card</strong><br />
<strong>Report</strong>ed for the 2009-10 <strong>School</strong> Year Published During 2010-11<br />
regarding this test, and comparisons of a school’s test results to the district and state levels, may be found at the Physical Fitness<br />
Testing Web page at http://www.cde.ca.gov/ta/tg/pf/. Note: Scores are not shown when the number of students tested is 10 or less,<br />
either because the number of students in this category is too small for statistical accuracy, or to protect student privacy. In no case shall<br />
any group score be reported that would deliberately or inadvertently make public the score or performance of any individual student.<br />
Grade Level<br />
Percent of Students Meeting Fitness Standards<br />
Four of Six Standards Five of Six Standards Six of Six Standards<br />
5 89.3% 75.5% 43.6%<br />
7<br />
9<br />
Academic Performance Index<br />
The Academic Performance Index (API) is an annual measure of the academic performance and progress of schools in California. API<br />
scores range from 200 to 1,000, with a statewide target of 800. Detailed information about the API can be found at the API Web page at<br />
http://www.cde.ca.gov/ta/ac/ap/.<br />
API Ranks – Three-Year Comparison<br />
This table displays the school’s statewide and similar schools API ranks. The statewide API rank ranges from 1 to 10. A statewide rank<br />
of 1 means that the school has an API score in the lowest 10 percent of all schools in the state, while a statewide rank of 10 means that<br />
the school has an API score in the highest 10 percent of all schools in the state. The similar schools API rank reflects how a school<br />
compares to 100 statistically matched “similar schools.” A similar schools rank of 1 means that the school’s academic performance is<br />
comparable to the lowest performing 10 schools of the 100 similar schools, while a similar schools rank of 10 means that the school’s<br />
academic performance is better than at least 90 of the 100 similar schools.<br />
API Rank 2007 2008 2009<br />
Statewide 9 9 8<br />
Similar <strong>School</strong>s 3 1 1<br />
Academic Performance Index Growth by Student Group – Three-Year Comparison<br />
This table displays by student group the actual API changes in points added or lost for the past three years.<br />
Actual API Change<br />
Group<br />
2007-08 2008-09 2009-10<br />
All Students at the <strong>School</strong> 0 -3 40<br />
Black or African American -- -- --<br />
American Indian or Alaska Native -- -- --<br />
Asian -- -- --<br />
Filipino -- -- --<br />
10 <strong>John</strong> H. <strong>Eader</strong> <strong>Elementary</strong><br />
Generated by <strong>School</strong> Innovations & Advocacy<br />
Huntington Beach City <strong>Elementary</strong>
<strong>School</strong> <strong>Accountability</strong> <strong>Report</strong> <strong>Card</strong><br />
<strong>Report</strong>ed for the 2009-10 <strong>School</strong> Year Published During 2010-11<br />
Hispanic or Latino -- -- --<br />
Native Hawaiian or Pacific Islander -- -- --<br />
White (not Hispanic) -7 5 46<br />
Two or More Races Click here to enter text. Click here to enter text. Click here to enter text.<br />
Socioeconomically Disadvantaged -- -- --<br />
English Learners -- -- --<br />
Students with Disabilities -- -- --<br />
Academic Performance Index Growth by Student Group – 2010 Growth API Comparison<br />
This table displays, by student group, the 2010 Growth API at the school, district, and state level.<br />
2010 Growth API<br />
Group<br />
<strong>School</strong> District State<br />
All Students at the <strong>School</strong> 901 889 767<br />
Black or African American -- -- 685<br />
American Indian or Alaska Native -- -- 728<br />
Asian -- 948 889<br />
Filipino -- -- 851<br />
Hispanic or Latino -- 825 715<br />
Native Hawaiian or Pacific Islander -- -- 754<br />
White (not Hispanic) 912 896 838<br />
Two or More Races -- 914 807<br />
Socioeconomically Disadvantaged -- 800 712<br />
English Learners -- 791 691<br />
Students with Disabilities -- 759 580<br />
Adequate Yearly Progress<br />
The federal NCLB Act requires that all schools and districts meet the following Adequate Yearly Progress (AYP) criteria:<br />
• Participation rate on the state’s standards-based assessments in English-language arts (ELA) and mathematics<br />
• Percent proficient on the state’s standards-based assessments in ELA and mathematics<br />
• API as an additional indicator<br />
11 <strong>John</strong> H. <strong>Eader</strong> <strong>Elementary</strong><br />
Generated by <strong>School</strong> Innovations & Advocacy<br />
Huntington Beach City <strong>Elementary</strong>
<strong>School</strong> <strong>Accountability</strong> <strong>Report</strong> <strong>Card</strong><br />
<strong>Report</strong>ed for the 2009-10 <strong>School</strong> Year Published During 2010-11<br />
• Graduation rate (for secondary schools)<br />
Detailed information about AYP, including participation rates and percent proficient results by student group, can be found at the AYP<br />
Web page http://www.cde.ca.gov/ta/ac/ay/.<br />
AYP Overall and by Criteria (2009-10 <strong>School</strong> Year)<br />
This table displays an indication of whether the school and the district made AYP overall and whether the school and the district met<br />
each of the AYP criteria.<br />
<strong>School</strong><br />
Overall Yes No<br />
District<br />
Participation Rate – English-Language Arts Yes Yes<br />
Participation Rate – Mathematics Yes Yes<br />
Percent Proficient – English-Language Arts Yes Yes<br />
Percent Proficient – Mathematics Yes No<br />
API Yes Yes<br />
Graduation Rate N/A N/A<br />
Federal Intervention Program (2010-11 <strong>School</strong> Year)<br />
<strong>School</strong>s and districts receiving federal Title I funding enter Program Improvement (PI) if they do not make AYP for two consecutive<br />
years in the same content area (English-language arts or mathematics) or on the same indicator (API or graduation rate). After entering<br />
PI, schools and districts advance to the next level of intervention with each additional year that they do not make AYP. Detailed<br />
information about PI identification can be found at the AYP Web page at http://www.cde.ca.gov/ta/ac/ay/.<br />
Indicator <strong>School</strong> District<br />
Program Improvement Status<br />
Not In PI<br />
First Year of Program Improvement<br />
Year in Program Improvement<br />
Number of <strong>School</strong>s Currently in Program Improvement --<br />
Percent of <strong>School</strong>s Currently in Program Improvement --<br />
IV. Teachers & Support Staff<br />
Teacher Credentials<br />
This table displays the number of teachers assigned to the school with a full credential, without a full credential, and those teaching<br />
outside of their subject area of competence. Detailed information about teacher qualifications can be found on the DataQuest Web<br />
page at http://dq.cde.ca.gov/dataquest/.<br />
12 <strong>John</strong> H. <strong>Eader</strong> <strong>Elementary</strong><br />
Generated by <strong>School</strong> Innovations & Advocacy<br />
Huntington Beach City <strong>Elementary</strong>
<strong>School</strong> <strong>Accountability</strong> <strong>Report</strong> <strong>Card</strong><br />
<strong>Report</strong>ed for the 2009-10 <strong>School</strong> Year Published During 2010-11<br />
Teachers<br />
<strong>School</strong><br />
District<br />
2007-08 2008-09 2009-10 2009-10<br />
With Full Credential 26 26 27 289<br />
Without Full Credential 0 0 0 0<br />
Teaching Outside Subject Area of Competence<br />
Click here to<br />
enter text.<br />
Click here to<br />
enter text.<br />
0 13<br />
Teacher Misassignments and Vacant Teacher Positions<br />
This table displays the number of teacher misassignments (teachers assigned without proper legal authorization) and the number of<br />
vacant teacher positions (not filled by a single designated teacher assigned to teach the entire course at the beginning of the school<br />
year or semester). Note: Total Teacher Misassignments includes the number of Misassignments of Teachers of English Learners.<br />
Indicators<br />
<strong>School</strong><br />
2008-09 2009-10 2010-11<br />
Misassignments of Teachers of English Learners 1 1 0<br />
Vacant Teacher Positions 1 0 0<br />
Total Teacher Misassignments 1 1 0<br />
Core Academic Classes Taught by No Child Left Behind Compliant Teachers (2009-10 <strong>School</strong> Year)<br />
This table displays the percent of classes in core academic subjects taught by No Child Left Behind (NCLB) compliant and non-NCLB<br />
compliant teachers in the school, in all schools in the district, in high-poverty schools in the district, and in low-poverty schools in the<br />
district. High poverty schools are defined as those schools with student participation of approximately 75 percent or more in the free<br />
and reduced price meals program. Low poverty schools are those with student participation of approximately 25 percent or less in the<br />
free and reduced price meals program. More information on teacher qualifications required under NCLB can be found on the CDE<br />
Improving Teacher and Principal Quality Web page at http://www.cde.ca.gov/nclb/sr/tq/.<br />
Location of Classes<br />
Percent of Classes in Core Academic Subjects<br />
Taught by NCLB Compliant Teachers<br />
Taught by Non-NCLB Compliant Teachers<br />
This <strong>School</strong> 100% 0<br />
All <strong>School</strong>s in District 100% 0<br />
High-Poverty <strong>School</strong>s in District Click here to enter text. Click here to enter text.<br />
Low-Poverty <strong>School</strong>s in District Click here to enter text. Click here to enter text.<br />
Professional Development<br />
This section provides information on how teachers and staff are trained for instructional improvement.<br />
All training and curriculum development at <strong>Eader</strong> <strong>School</strong> revolves around the California State Content Standards and Frameworks.<br />
Teachers align classroom curriculum to ensure that all students either meet or exceed state proficiency levels.<br />
13 <strong>John</strong> H. <strong>Eader</strong> <strong>Elementary</strong><br />
Generated by <strong>School</strong> Innovations & Advocacy<br />
Huntington Beach City <strong>Elementary</strong>
<strong>School</strong> <strong>Accountability</strong> <strong>Report</strong> <strong>Card</strong><br />
<strong>Report</strong>ed for the 2009-10 <strong>School</strong> Year Published During 2010-11<br />
Huntington Beach City <strong>School</strong> District regularly collaborates with all levels of district and school site staff when developing professional<br />
development activities in alignment with the No Child Left Behind Improving Teacher Quality Expectations. Instructional program<br />
improvement is driven by student needs and guided by state standards and frameworks. District and school administrators use site<br />
trend analyses, state testing, district-level assessments, teacher response, and administrator observations to identify more effective<br />
methods and strategies to achieve positive results for teachers and students.<br />
The Assistant Superintendent of Educational Services and principals meet monthly to analyze current instructional programs,<br />
instructional materials, implementation timelines, and student achievement. Feedback is gathered at the site level through direct input<br />
and staff observation. Periodic Curriculum Development Committees are formed to address identified areas of need and focus. In the<br />
2005-06 school year, three mandatory staff development days were held during the school year. District-level training activities and<br />
professional development revolved around the new language arts textbook adoption and differentiated instructional strategies to meet<br />
the needs of all students.<br />
In alignment with the districts long-range curriculum plan, staff development opportunities are available for teachers, support personnel,<br />
administrators, and classified staff at <strong>Eader</strong> <strong>School</strong>. A comprehensive school plan is in place which guides curriculum improvement.<br />
Focus areas for each year are determined by student achievement, district focus areas, parent and staff survey results, and the<br />
textbook adoption cycle. Progress is assessed yearly using multiple criteria including STAR testing results, writing sample results,<br />
reading test results, student work, teacher observation, and criterion based testing. Each year, approximately ten percent of <strong>Eader</strong>’s<br />
<strong>School</strong> Improvement funds are allocated to staff development. Recent training areas included technology, writing to a prompt,<br />
standards-based instruction, report card development, and strategies for at-risk students.<br />
A portion of our school funds is used to enable staff members to attend teaching seminars and other events designed to enhance their<br />
teaching techniques and expand their knowledge base. Teachers new to the profession are supported by peer coaching and are<br />
encouraged to attend in-services offered by the West Orange County Consortium for Special Education or education consultants.<br />
Teachers are encouraged to attend subject-specific seminars and major conferences and share what they learn with other staff<br />
members. The Beginning Teacher Support and Assessment (BTSA) program offers additional support and opportunities to new<br />
teachers. The program is designed to assist those new to teaching to expand and deepen their teaching skills, help the school district<br />
retain more new teachers, and improve learning opportunities for students.<br />
Classified staff and instructional assistants are provided training and development opportunities at the school, district, and county<br />
levels. Inservices for classified staff are geared to their specialty areas.<br />
Professional Development Days<br />
This table displays information on the annual number of school days dedicated to staff development for the most recent three-year<br />
period.<br />
Professional Development Days<br />
Indicator<br />
2007-08 2008-09 2009-10<br />
Annual number of school days<br />
3<br />
3 3<br />
dedicated to staff development<br />
Academic Counselors and Other Support Staff (2009-10 <strong>School</strong> Year)<br />
This table displays, in units of full-time equivalents (FTE), the number of academic counselors and other support staff who are assigned<br />
to the school and the average number of students per academic counselor. One FTE equals one staff member working full time; one<br />
FTE could also represent two staff members who each work 50 percent of full time.<br />
Title<br />
Number of FTE<br />
Assigned to <strong>School</strong><br />
Average Number of Students<br />
per Academic Counselor<br />
14 <strong>John</strong> H. <strong>Eader</strong> <strong>Elementary</strong><br />
Generated by <strong>School</strong> Innovations & Advocacy<br />
Huntington Beach City <strong>Elementary</strong>
<strong>School</strong> <strong>Accountability</strong> <strong>Report</strong> <strong>Card</strong><br />
<strong>Report</strong>ed for the 2009-10 <strong>School</strong> Year Published During 2010-11<br />
Academic Counselor N.A. Click here to enter text.<br />
Counselor (Social /Behavioral or Career Development) .44 --<br />
Library Media Teacher (Librarian) N.A. --<br />
Library Media Services Staff (paraprofessional) .33 --<br />
Psychologist .53. --<br />
Social Worker N.A. --<br />
Nurse N.A --<br />
Speech/Language/Hearing Specialist 1.4 --<br />
Resource Specialist (non-teaching) N.A. --<br />
Other N.A --<br />
V. <strong>School</strong> Finances<br />
Expenditures Per Pupil and <strong>School</strong> Site Teacher Salaries (2008-09 Fiscal Year)<br />
This table displays a comparison of the school’s per pupil expenditures from unrestricted (basic) sources with other schools in the<br />
district and throughout the state, and a comparison of the average teacher salary at the school site with average teacher salaries at the<br />
district and state levels. Detailed information regarding school expenditures can be found at the Current Expense of Education Web<br />
page at http://www.cde.ca.gov/ds/fd/ec/ and teacher salaries can be found on the Certificated Salaries and Benefits Web page at<br />
http://www.cde.ca.gov/ds/fd/cs/.<br />
Total Expenditures<br />
Per Pupil<br />
Expenditures Per<br />
Pupil (Supplemental)<br />
Expenditures<br />
Per Pupil (Basic)<br />
Average<br />
Teacher Salary<br />
<strong>School</strong> 5,306.53 981.72 4,324.81 70,819<br />
District -- -- 1,066.87 $73,200.00<br />
State -- -- $5,681.00 $68,212.00<br />
Percent Difference –<br />
<strong>School</strong> and District<br />
Percent Difference –<br />
<strong>School</strong> and State<br />
-- -- 75.4% 3.3%<br />
-- -- 31.3% 3.7%<br />
Types of Services Funded (2009-10 Fiscal Year)<br />
This section provides information about the programs and supplemental services that are available at the school and funded through<br />
either categorical or other sources.<br />
15 <strong>John</strong> H. <strong>Eader</strong> <strong>Elementary</strong><br />
Generated by <strong>School</strong> Innovations & Advocacy<br />
Huntington Beach City <strong>Elementary</strong>
<strong>School</strong> <strong>Accountability</strong> <strong>Report</strong> <strong>Card</strong><br />
<strong>Report</strong>ed for the 2009-10 <strong>School</strong> Year Published During 2010-11<br />
A significant portion of <strong>Eader</strong> <strong>School</strong>’s categorical program budget is allocated for professional development activities to support<br />
improved instruction. The district continuously explores ways to increase extended learning opportunities and improve intervention with<br />
at-risk students.<br />
Each year a portion of <strong>Eader</strong>’s <strong>School</strong>/Library Improvement Block Grant funds are used to enable staff members to attend teaching<br />
seminars and other events designed to enhance their teaching techniques and expand their knowledge base. Teachers who are new to<br />
the profession are supported by peer coaching and are encouraged to attend in-services. Teachers who attend conferences, seminars,<br />
and other events are encouraged to share what they learn with other staff members.<br />
The Beginning Teacher Support and Assessment (BTSA) program offers additional support and opportunities to new teachers. The<br />
program is designed to assist those new to teaching to expand and deepen their teaching skills, help the school district retain more new<br />
teachers, and improve learning opportunities for students.<br />
For experienced teachers, the Peer Assistance and Review Program utilizes the district’s veteran teachers as “consultants” to assist<br />
with staff development districtwide, with a particular focus on teacher needs.<br />
Gifted and Talented Education Program cluster classes are provided for grades 2-5 for GATE identified students. All staff members are<br />
committed creating and maintaining an environment where students can grow physically, emotionally, and intellectually into healthy,<br />
contributing citizens.<br />
Teacher and Administrative Salaries (2008-09 Fiscal Year)<br />
This table displays district salaries for teachers, principals, and superintendents, and compares these figures to the state averages for<br />
districts of the same type and size. The table also displays teacher and administrative salaries as a percent of a district's budget, and<br />
compares these figures to the state averages for districts of the same type and size. Detailed information regarding salaries may be<br />
found on the Certificated Salaries and Benefits Web page at http://www.cde.ca.gov/ds/fd/cs/.<br />
State Average for Districts in the<br />
Range<br />
District<br />
Same Category<br />
Beginning Teacher Salary $41,284.00 $41,988.00<br />
Mid-Range Teacher Salary $77,732.00 $68,649.00<br />
Highest Teacher Salary $94,808.00 $87,156.00<br />
Average Principal Salary (<strong>Elementary</strong>) $116,746.00 $109,026.00<br />
Average Principal Salary (Middle) $116,112.00 $112,489.00<br />
Average Principal Salary (High) $0.00 $113,872.00<br />
Superintendent Salary $215,494.00 $181,890.00<br />
Percent of Budget for Teacher Salaries 45.4% 42.5%<br />
Percent of Budget for Administrative Salaries 5.7% 5.5%<br />
16 <strong>John</strong> H. <strong>Eader</strong> <strong>Elementary</strong><br />
Generated by <strong>School</strong> Innovations & Advocacy<br />
Huntington Beach City <strong>Elementary</strong>
<strong>School</strong> <strong>Accountability</strong> <strong>Report</strong> <strong>Card</strong><br />
<strong>Report</strong>ed for the 2009-10 <strong>School</strong> Year Published During 2010-11<br />
VI. Data and Access<br />
DataQuest<br />
DataQuest is an online data tool located at http://dq.cde.ca.gov/dataquest/ that contains additional information about this school and<br />
comparisons of the school to the district, the county, and the state. Specifically, DataQuest is a dynamic system that provides reports<br />
for accountability (e.g. Academic Performance Index [API], Adequate Yearly Progress [AYP], test data, enrollment, graduates,<br />
dropouts, course enrollments, staffing, and data regarding English learners.<br />
Internet Access<br />
Internet access is available at public libraries and other locations that are publicly accessible (e.g., the California State Library). Access<br />
to the Internet at libraries and public locations is generally provided on a first-come, first-served basis. Other use restrictions include the<br />
hours of operation, the length of time that a workstation may be used (depending on availability), the types of software programs<br />
available on a workstation, and the ability to print documents.<br />
17 <strong>John</strong> H. <strong>Eader</strong> <strong>Elementary</strong><br />
Generated by <strong>School</strong> Innovations & Advocacy<br />
Huntington Beach City <strong>Elementary</strong>