A report on an experiment I did of doing electrophoresis with proteins
A report on an experiment I did of doing electrophoresis with proteins
A report on an experiment I did of doing electrophoresis with proteins

Create successful ePaper yourself
Turn your PDF publications into a flip-book with our unique Google optimized e-Paper software.
SDS-PAGE Electrophoresis<br />
Anirbit<br />
Department <strong>of</strong> Theoretical Physics,<br />
Tata Institute <strong>of</strong> Fundamental Research,<br />
Mumbai 400005, India<br />
(Dated: February 15, 2010)<br />
In this <str<strong>on</strong>g>report</str<strong>on</strong>g> I shall explain the steps involved in <strong>doing</strong> <strong>an</strong> <strong>electrophoresis</strong> <strong>experiment</strong> <strong>on</strong> <strong>proteins</strong><br />
<strong>an</strong>d eventual <strong>an</strong>alysis <strong>of</strong> the data to study how best <strong>on</strong>e c<strong>an</strong> predict the mass <strong>of</strong> a protein from<br />
the intensity <strong>of</strong> the dye stains. The particular versi<strong>on</strong> <strong>of</strong> <strong>electrophoresis</strong> that will be used is called<br />
“SDS-PAGE” in literature because <strong>of</strong> the essential use <strong>of</strong> the chemical Sodium Dodecyle Sulphate<br />
<strong>an</strong>d Polyacrylamide in the process. En route <strong>on</strong>e shall unravel m<strong>an</strong>y subtleties <strong>of</strong> the predicti<strong>on</strong><br />
process <strong>an</strong>d realize the intrinsic problems <strong>of</strong> <strong>doing</strong> a simple intensity-mass plots as compared to more<br />
robust power law behaviour that will be be seen to emerge in variati<strong>on</strong> <strong>of</strong> intensity <strong>with</strong> logarithm<br />
<strong>of</strong> fracti<strong>on</strong>al masses.<br />
I. INTRODUCTION<br />
To start <strong>of</strong>f <strong>on</strong>e c<strong>an</strong> imagine the <strong>electrophoresis</strong> as a method by which a soluti<strong>on</strong> <strong>of</strong> <strong>proteins</strong> is passed through a gel<br />
in the presence <strong>of</strong> a c<strong>on</strong>st<strong>an</strong>t potential difference such that the <strong>proteins</strong> <strong>of</strong> various sizes flow through it at different<br />
speeds <strong>an</strong>d hence <strong>on</strong>e c<strong>an</strong> tell the c<strong>on</strong>stituents <strong>of</strong> the soluti<strong>on</strong> based <strong>on</strong> the positi<strong>on</strong>s <strong>of</strong> a dye stain which binds to<br />
the <strong>proteins</strong>.<br />
In the future <strong>experiment</strong>s that will be d<strong>on</strong>e in this laboratory it will be import<strong>an</strong>t that <strong>on</strong>e c<strong>an</strong> m<strong>on</strong>itor fracti<strong>on</strong>al<br />
ch<strong>an</strong>ges <strong>of</strong> a certain protein during the run <strong>of</strong> <strong>an</strong> <strong>experiment</strong>. In most <strong>of</strong> these <strong>proteins</strong> knowing the exact amount<br />
<strong>of</strong> protein in the soluti<strong>on</strong> is very hard. In this <strong>experiment</strong> the attempt shall be to try to extend the applicability <strong>of</strong><br />
<strong>electrophoresis</strong> to see if given a pure protein soluti<strong>on</strong> <strong>on</strong>e c<strong>an</strong> predict the total mass <strong>of</strong> protein in it by correlating the<br />
intensity <strong>of</strong> the dye stain <strong>with</strong> the mass <strong>of</strong> the protein.<br />
II.<br />
SDS-PAGE ELECTROPHORESIS<br />
In the given <strong>electrophoresis</strong> set-up <strong>of</strong> Bio-Rad <strong>on</strong>e c<strong>an</strong> set up 2 gels to run simult<strong>an</strong>eously. One prepares the<br />
soluti<strong>on</strong>s <strong>of</strong> chemicals in volumes slightly larger th<strong>an</strong> what is required to account for the spill-overs that are very<br />
comm<strong>on</strong>. To run 2 gels together I found it c<strong>on</strong>venient to make 15ml <strong>of</strong> 8% soluti<strong>on</strong> for ”Separating Gel” <strong>an</strong>d 5ml <strong>of</strong><br />
soluti<strong>on</strong> for ”Stacking Gel”.<br />
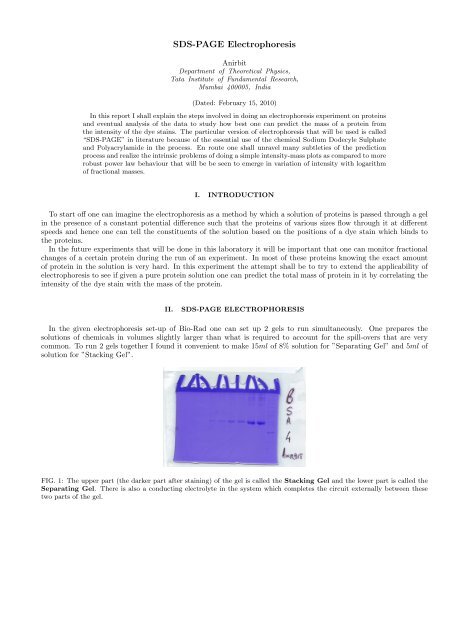
FIG. 1: The upper part (the darker part after staining) <strong>of</strong> the gel is called the Stacking Gel <strong>an</strong>d the lower part is called the<br />
Separating Gel. There is also a c<strong>on</strong>ducting electrolyte in the system which completes the circuit externally between these<br />
two parts <strong>of</strong> the gel.
2<br />
A. A note <strong>on</strong> the chemical soluti<strong>on</strong>s used<br />
Some <strong>of</strong> the st<strong>an</strong>dard acr<strong>on</strong>yms for chemicals that are used are,<br />
• “Acrylamide Mix” is a 1 : 29 mixture <strong>of</strong> N, Nmethylene bis-acrylamide <strong>an</strong>d Acrylamide<br />
• “SDS” is Sodium Dodecyl Sulphate<br />
• “APS” is Amm<strong>on</strong>ium per-Sulphate (always stored at −20 ◦ C)<br />
• “TEMED” is N,N,N’,N’-Tetramethylethyl-enediamine (always stored at 4 ◦ C)<br />
All the autoclaving in this <strong>experiment</strong> are d<strong>on</strong>e at 121 ◦ C for 15minutes at 103kP a <strong>of</strong> pressure in <strong>an</strong> autoclaving<br />
apparatus made by Hospharma.<br />
The mixture <strong>of</strong> chemicals required to make 15ml <strong>of</strong> Separating Gel are,<br />
• H 2 O −→ 6.9ml<br />
• 30%Acrylamide Mix −→ 4.0ml<br />
• 1.5M T ris − Hcl(pH 8.8) −→ 3.8ml<br />
• 10% SDS −→ 0.15ml<br />
• 10% AP S −→ 0.15ml<br />
• T EMED −→ 0.009ml<br />
The mixture <strong>of</strong> chemicals required to make 5ml <strong>of</strong> Stacking Gel are,<br />
• H 2 O −→ 3.4ml<br />
• 30%Acrylamide Mix −→ 0.83ml<br />
• 1M T ris − Hcl(pH 8.8) −→ 0.63ml<br />
• 10% SDS −→ 0.05ml<br />
• 10% AP S −→ 0.05ml<br />
• T EMED −→ 0.005ml<br />
To make 2l <strong>of</strong> the Electrophoresis Buffer that will act as the c<strong>on</strong>ductor for the current during <strong>electrophoresis</strong><br />
<strong>on</strong>e uses the following mixture,<br />
• Trizma Base (a.k.a Tris), which is mainly C 4 H 11 NO 3 → 12g<br />
• Glycine → 57.6g<br />
• SDS → 2g<br />
• Autoclaved water is added to make up the volume to 2l <strong>an</strong>d pH adjustment is not d<strong>on</strong>e.<br />
To make 50ml <strong>of</strong> the Sample Buffer (DTT dye) <strong>on</strong>e has to mix the following,<br />
• 0.6M soluti<strong>on</strong> <strong>of</strong> Tris in HCl at pH 6.8 → 5ml<br />
• SDS → 0.5g<br />
• Sucrose → 5g<br />
• β − Mercaptoeth<strong>an</strong>ol → 0.25ml<br />
• 0.5% Bromophenol Blue → 5ml<br />
• Autoclaved water is added to make up the soluti<strong>on</strong> to 50ml
3<br />
To make Staining Soluti<strong>on</strong> <strong>on</strong>e mixes,<br />
• 0.1%(v/v) Coomassie brilli<strong>an</strong>t blue R250<br />
• 50%(v/v) Meth<strong>an</strong>ol<br />
• 10%(v/v) Glacial Acetic acid.<br />
To make the Destaining Soluti<strong>on</strong> <strong>on</strong>e mixes,<br />
• 10% Meth<strong>an</strong>ol<br />
• 7% Glacial Acetic acid<br />
To make m<strong>an</strong>y <strong>of</strong> these soluti<strong>on</strong>s the masses <strong>of</strong> the chemicals needed to be measured <strong>an</strong>d they were d<strong>on</strong>e <strong>on</strong> these<br />
two machines m<strong>an</strong>ufactured by Sartorius,<br />
• One was the model CP 1245 <strong>an</strong>d it had a maximum load capacity <strong>of</strong> 120g <strong>with</strong> a least count <strong>of</strong> 10 −4 g<br />
• The other was <strong>of</strong> model BL1500S <strong>an</strong>d it had a maximum load capacity <strong>of</strong> 1500g <strong>with</strong> a least count <strong>of</strong> 10 −2 g<br />
The following are the steps in setting the gels,<br />
B. Setting the gels<br />
• Before <strong>on</strong>e starts making the soluti<strong>on</strong>s <strong>on</strong>e sets up the two pairs <strong>of</strong> glass plates <strong>on</strong> the rack in a particular<br />
orientati<strong>on</strong> as marked <strong>on</strong> the plates. Each <strong>of</strong> these glass plates is about 1mm think <strong>an</strong>d specially made to<br />
be as smooth as possible <strong>an</strong>d are very fragile. The larger plat is <strong>of</strong> dimensi<strong>on</strong>s about 10cm × 8.2cm <strong>an</strong>d the<br />
smaller <strong>on</strong>e is <strong>of</strong> size about 10cm × 7.3cm. There are two about 1mm thick strips <strong>of</strong> opaque glass <strong>of</strong> sizes almost<br />
8.2cm × 9mm stuck <strong>on</strong> the two sides <strong>of</strong> the larger glass. This ensures a gap <strong>of</strong> 1mm between the two glass plates<br />
in which the gel will be polymerized.<br />
• One makes the soluti<strong>on</strong>s <strong>of</strong> the separating <strong>an</strong>d the stacking gel in separate c<strong>on</strong>tainers. I made them in discarded<br />
50ml aliquots m<strong>an</strong>ufactured by Falc<strong>on</strong>.<br />
• Except APS <strong>an</strong>d TEMED <strong>on</strong>e mixes in all the chemicals in the two compositi<strong>on</strong>s given above.<br />
• APS needs to be freshly prepared or <strong>on</strong>e that has been stored at −20 ◦ C <strong>an</strong>d just taken out.<br />
• Since the separating gel will be made first hence for now <strong>on</strong>e puts the APS in the separating soluti<strong>on</strong> <strong>on</strong>ly <strong>an</strong>d<br />
mixes the TEMED also in <strong>on</strong>ly that <strong>on</strong>e.<br />
• As so<strong>on</strong> as the APS <strong>an</strong>d TEMED are poured into the separating soluti<strong>on</strong> <strong>on</strong>e immediately tr<strong>an</strong>sfers them<br />
between <strong>on</strong>e <strong>of</strong> the pairs <strong>of</strong> glass-plates through a pipette tip <strong>an</strong>d the tip should be moved all al<strong>on</strong>g the edge<br />
through out to ensure that the fluid flows in uniformly between the glass plates. Any n<strong>on</strong>-uniformity will result<br />
in nucleati<strong>on</strong> centers for the polymerizati<strong>on</strong> process <strong>an</strong>d make the gel n<strong>on</strong>-homogeneous.<br />
• One stops pouring the soluti<strong>on</strong> when it reaches <strong>an</strong> height <strong>of</strong> about 1cm below the edge <strong>of</strong> the plates (such that<br />
the gap is larger th<strong>an</strong> the depth <strong>of</strong> the comb so that the protein soluti<strong>on</strong>s have to pass through some stacking<br />
gel before entering the separating gel <strong>an</strong>din the process they undergo isoelectric focussing through the process<br />
<strong>of</strong> isotacphoresis.) One pours but<strong>an</strong>ol <strong>on</strong> the top <strong>of</strong> it through <strong>an</strong>other pipette. This is immiscible <strong>with</strong> the rest<br />
<strong>of</strong> the soluti<strong>on</strong> <strong>an</strong>d floats <strong>on</strong> the top helping to smoothen the gel surface <strong>an</strong>d also acts as a protecting layer from<br />
the oxidati<strong>on</strong> effects <strong>of</strong> the atmosphere.<br />
• Now <strong>on</strong>e waits for about 30mins for the gel to form. It c<strong>an</strong> sometimes take <strong>an</strong> hour or a little more depending<br />
<strong>on</strong> humidity <strong>an</strong>d temperature c<strong>on</strong>diti<strong>on</strong>s. After about 30mins I keep checking for the formati<strong>on</strong> <strong>of</strong> the gel by<br />
tilting the whole set up at times to see if the but<strong>an</strong>ol layer is hitting a hard boundary <strong>on</strong> its lower surface.<br />
• Once the separating gel is formed <strong>on</strong>e washes out the but<strong>an</strong>ol layer by tilting the c<strong>on</strong>tainer <strong>an</strong>d gently flowing<br />
in autoclaved water through the gap <strong>an</strong>d absorbing <strong>an</strong>y further remn<strong>an</strong>t but<strong>an</strong>ol by gently inserting a tissue<br />
paper in the gap.
4<br />
FIG. 2: The above photograph shows green frames in which the gel is set <strong>an</strong>d the tr<strong>an</strong>sparent rack in which the green frames<br />
are clamped to keep them stable during the polymerizati<strong>on</strong> process.<br />
• Now <strong>on</strong>e mixes the APS <strong>an</strong>d the TEMED in the stacking soluti<strong>on</strong> <strong>an</strong>d pours it into the gap between the pairs<br />
<strong>of</strong> plates through a pipette in a similar fashi<strong>on</strong>. Now <strong>on</strong>e has to quickly insert the comb into the gap which will<br />
demarcate the wells that will form inside the stacking gel. This comb is not to be taken out untill the protein<br />
loading starts.<br />
• This set up should be left undisturbed till it is necessary to install the gels into the <strong>electrophoresis</strong> t<strong>an</strong>k.<br />
• Generally during this time <strong>on</strong>e starts making the chemicals that will be loaded into the gel. Like the diluti<strong>on</strong><br />
series <strong>of</strong> Actin <strong>an</strong>d BSA to be described below.<br />
C. Making Actin diluti<strong>on</strong> soluti<strong>on</strong><br />
When Actin is extracted it is not known as to how much Actin is present in the soluti<strong>on</strong>. It is estimated from<br />
indirect methods that the c<strong>on</strong>centrati<strong>on</strong> is 2µg/mul.<br />
The various steps in preparing the Actin diluti<strong>on</strong> are as follows,<br />
• I took 5 aliquots <strong>of</strong> the Actin soluti<strong>on</strong> which gave me about 43µl <strong>of</strong> Actin soluti<strong>on</strong>.<br />
• I added 117µl <strong>of</strong> H 2 O to it <strong>an</strong>d hence made up the soluti<strong>on</strong> to 160µl. Call this soluti<strong>on</strong> A 0<br />
• I took 80µl <strong>of</strong> A 0 <strong>an</strong>d added 80µl <strong>of</strong> H 2 O to it <strong>an</strong>d made 160µl <strong>of</strong> <strong>an</strong>other soluti<strong>on</strong>. Lets name it A 1<br />
• Again I took 80µl <strong>of</strong> A 1 <strong>an</strong>d added 80µl <strong>of</strong> H 2 O to it <strong>an</strong>d made 160 <strong>of</strong> <strong>an</strong>other soluti<strong>on</strong>. Lets name it A 2 .<br />
• Thus iterating the process about 5 times <strong>on</strong>e makes soluti<strong>on</strong>s <strong>of</strong> 80µl each till A 5 . In the making <strong>of</strong> A 5 the 80µl<br />
<strong>of</strong> A 4 that remains is preserved separately for future <strong>experiment</strong>s <strong>an</strong>d not used in the dyeing <strong>an</strong>d heating in the<br />
next steps.<br />
• In each <strong>of</strong> the 80µl soluti<strong>on</strong>s from A 0 to A 5 <strong>of</strong> Actin, 20µl <strong>of</strong> the “5X” DTT dye is added (so that in the final<br />
soluti<strong>on</strong> the dye is in c<strong>on</strong>centrati<strong>on</strong> <strong>of</strong> “1X”) <strong>an</strong>d then each <strong>of</strong> these 100µl soluti<strong>on</strong>s is sent for heating for 5mins<br />
at 100 ◦ C .<br />
• Post heating <strong>on</strong>e loads 20µl <strong>of</strong> each soluti<strong>on</strong> in each <strong>of</strong> the wells <strong>of</strong> the gel. Hence the amounts <strong>of</strong> protein in the<br />
wells <strong>of</strong> the gel fall in inverse powers <strong>of</strong> two.
5<br />
D. Making BSA diluti<strong>on</strong> soluti<strong>on</strong><br />
The steps to prepare the BSA sample that will be loaded in the gel,<br />
1. 5mg <strong>of</strong> BSA is mixed in 1ml <strong>of</strong> water. (call this soluti<strong>on</strong> A 0 )<br />
2. 0.5ml <strong>of</strong> A 0 is taken in <strong>an</strong>other aliquot <strong>an</strong>d 0.5ml <strong>of</strong> water is mixed in it (call it soluti<strong>on</strong> A 1 )<br />
3. 0.5ml <strong>of</strong> A 1 is taken in <strong>an</strong>other aliquot <strong>an</strong>d 0.5mk <strong>of</strong> water is mixed in it (call it soluti<strong>on</strong> A 2 ).<br />
4. In this way soluti<strong>on</strong>s till A 5 are made.<br />
5. 30µl <strong>of</strong> A 0 is taken in <strong>an</strong> aliquot <strong>an</strong>d 7.5µl <strong>of</strong> the ‘5X” dye is mixed in it. (This choice is explained in the last<br />
point)<br />
6. So the aliquout now c<strong>on</strong>tains 150µg <strong>of</strong> BSA in a soluti<strong>on</strong> <strong>of</strong> volume 37.5µl.<br />
7. To denature the <strong>proteins</strong> boil this 37.5µl <strong>of</strong> soluti<strong>on</strong> for 5min at 100 ◦ C (call this B 0 )<br />
8. The steps 5,6 <strong>an</strong>d 7 are repeated for A 1 , A 2 , A 3 , A 4 , A 5 <strong>an</strong>d call the corresp<strong>on</strong>ding 37.5µl soluti<strong>on</strong>s<br />
B 1 , B 2 , B 3 , B 4 , B 5 .<br />
9. 3µl <strong>of</strong> each B i is taken <strong>an</strong>d loaded into each <strong>of</strong> the wells.<br />
10. Then the mass <strong>of</strong> the BSA loaded in each <strong>of</strong> the wells are respectively 12µg, 6µg, 3µg, 1.5µg, 0.75µg <strong>an</strong>d 0.375µg.<br />
11. The ′ 5X” dye is a soluti<strong>on</strong> <strong>of</strong> the dye made <strong>an</strong>d stored in such a way that it has c<strong>on</strong>centrati<strong>on</strong> 5 times more<br />
th<strong>an</strong> what it should be in the final soluti<strong>on</strong>. Then <strong>on</strong>e c<strong>an</strong> see that adding 7.5µl <strong>of</strong> such a ‘5X” dye to 30µl <strong>of</strong><br />
fluids results in the correct c<strong>on</strong>centrati<strong>on</strong> <strong>of</strong> the dye in the final mixture.<br />
The steps are as follows,<br />
E. Loading, running, staining <strong>an</strong>d destaining the gel<br />
• One generally needs to have about 500ml <strong>of</strong> the <strong>electrophoresis</strong> buffer as a c<strong>on</strong>ductor for running the gel.<br />
• 50ml <strong>of</strong> the available 10X buffer is mixed <strong>with</strong> 450ml <strong>of</strong> autoclaved water to make the required soluti<strong>on</strong>.<br />
• First the two glass framed gels are slid into the slots <strong>on</strong> the two sides <strong>of</strong> the frame that goes into the t<strong>an</strong>k. The<br />
glass frames are positi<strong>on</strong>ed so that the shorter plate faces inward.<br />
• Checking for snug fitting <strong>on</strong>e locks them by the plastic hinges <strong>on</strong> the frame.<br />
• Then the frame is inserted into the t<strong>an</strong>k <strong>an</strong>d the <strong>electrophoresis</strong> buffer is poured into the volume between the<br />
two glass frames.<br />
• One checks if the buffer is leaking out into the t<strong>an</strong>k. If it does then <strong>on</strong>e has to diam<strong>an</strong>tle the frame <strong>an</strong>d reset it<br />
again.<br />
• Then <strong>on</strong>e pours the rest <strong>of</strong> the prepared buffer in the volume surrounding the frame inside the t<strong>an</strong>k.<br />
• Now <strong>on</strong>e should pull out the combs taking care that the jerk does not break the wells inside the gel that would<br />
have formed.<br />
• At certain <strong>an</strong>gles the wells will be visibile to the naked eye because <strong>of</strong> the refractive index difference between<br />
air <strong>an</strong>d the tr<strong>an</strong>sparent gel.<br />
• To reduce ch<strong>an</strong>ces <strong>of</strong> loading the protein at regi<strong>on</strong>s other th<strong>an</strong> the gel <strong>on</strong>e c<strong>an</strong> mark the positi<strong>on</strong>s <strong>of</strong> the wells<br />
<strong>on</strong> the wall <strong>of</strong> the t<strong>an</strong>k using some marker.<br />
• The <strong>proteins</strong> are loaded into the micropipettes from the aliquots <strong>an</strong>d the pippete is lightly inserted into the well<br />
from the side <strong>of</strong> the shorter glass plate <strong>an</strong>d the protein pushed in. One c<strong>an</strong> see the coloured protein settled into<br />
the well. Care should be taken to push in the protein in <strong>on</strong>e shot since <strong>doing</strong> a sucti<strong>on</strong> c<strong>an</strong> c<strong>on</strong>taminate the<br />
protein by the buffer soluti<strong>on</strong>.<br />
• After all the gels are loaded, the top cover is closed <strong>an</strong>d it is c<strong>on</strong>nected to the D.C source that comes <strong>with</strong> the<br />
instrument. It is generally run at about 100V . This D.C source has ratings <strong>of</strong> delivering 2.5A current at 500V<br />
delivering a maximum power <strong>of</strong> 500W .
6<br />
FIG. 3: The above photograph shows the <strong>electrophoresis</strong> set-up while it is running.<br />
FIG. 4: The top-view <strong>of</strong> the <strong>electrophoresis</strong> set-up while it is running.
• The voltage is maintained till the blue line in the gel (formed due to the accumulati<strong>on</strong> <strong>of</strong> the dye) hits the lower<br />
edge <strong>of</strong> the gel. As a thumb rule the protein is generally behind dye. One shouldn’t leave the process unattended<br />
for l<strong>on</strong>g at this stage since the <strong>proteins</strong> c<strong>an</strong> very well run out <strong>of</strong> the gel into the soluti<strong>on</strong> if kept for l<strong>on</strong>g.<br />
7<br />
FIG. 5: The faint blue line towards the bottom <strong>of</strong> the gel indicating the dist<strong>an</strong>ce through which the dye has run.<br />
• After the gel running is complete, the appar<strong>an</strong>tus is dism<strong>an</strong>tled <strong>an</strong>d the glass plates taken out. The two glass<br />
plates in every pair will stick to each other very str<strong>on</strong>gly because <strong>of</strong> surface tensi<strong>on</strong> <strong>an</strong>d just trying to pull them<br />
apart runs the risk <strong>of</strong> breaking the fragile glass <strong>an</strong>d also the gel. In general water is lighly run through the<br />
upper edge <strong>an</strong>d then s<strong>of</strong>tly <strong>on</strong>e c<strong>an</strong> pry them apart using a plastic wedge.<br />
• Using the same wedge the gel is lighly detached from the glass plate <strong>an</strong>d this thin film that is formed is tr<strong>an</strong>sferred<br />
to a tray.<br />
Now <strong>on</strong>e c<strong>an</strong> either use this gel to do staining <strong>with</strong> Coomassie blue dye or use it for Western Blotting.<br />
The next steps <strong>of</strong> Coomassie blue staining are relatively simple which are listed below <strong>an</strong>d Western Blotting is a<br />
l<strong>on</strong>ger sequence <strong>of</strong> steps which was unsuccessfully tried <strong>an</strong>d shall not be explained here.<br />
The steps <strong>of</strong> staining <strong>an</strong>d destaining are as follows,<br />
• On the gels which are tr<strong>an</strong>sferred into the tray, Coomassie Blue dye soluti<strong>on</strong> is poured <strong>an</strong>d the set up is put<br />
<strong>on</strong> a rocker for overnight staining. This is staining is generally d<strong>on</strong>e for about 10 − 12hours <strong>an</strong>d during this<br />
time the oscillati<strong>on</strong>s <strong>of</strong> the rocker ensure that the dye keeps flowing across the gel uniformly <strong>with</strong>out clustering<br />
<strong>an</strong>ywhere <strong>an</strong>d hence stains the gel uniformly.<br />
• After the staining is over the remaining staining soluti<strong>on</strong> is recovered for reuse.<br />
• The destaining soluti<strong>on</strong> is is then pourd in <strong>an</strong>d set <strong>on</strong> a rocker. As the stain dissolves into the destaining soluti<strong>on</strong><br />
the soluti<strong>on</strong> will keep becoming blue <strong>an</strong>d then <strong>on</strong>e dec<strong>an</strong>ts out the soluti<strong>on</strong> <strong>an</strong>d pours in fresh soluti<strong>on</strong>. This<br />
ch<strong>an</strong>ge has to be d<strong>on</strong>e almost every 10 − 20 minutes for about 5hours.<br />
• During this destaining process care must be taken not to overdo the process since it c<strong>an</strong> eventually start dissolving<br />
out the dye stuck to the protein b<strong>an</strong>ds also.<br />
• Initially the gel looks uniformly blue after about 2 rounds <strong>of</strong> destaining the protein b<strong>an</strong>ds become visible in<br />
c<strong>on</strong>trast <strong>with</strong> the lighter background.
8<br />
Some general dimensi<strong>on</strong>s <strong>of</strong> the gel are,<br />
F. Some measurements <strong>of</strong> the gel<br />
• The separating gel is generally about 5.5cm × 8.2cm in size <strong>an</strong>d the stacking gel is 1.5cm × 8.2cm <strong>with</strong> wells<br />
al<strong>on</strong>g <strong>on</strong>e edge.<br />
• The wells in the stacking gel are about 1cm deep <strong>an</strong>d 0.5cm in width, so the <strong>proteins</strong> pass through about 0.6cm<br />
<strong>of</strong> stacking gel before hitting the separating gel.<br />
• The gel is generally 0.1cm in thickness.<br />
• The separating gel is about 4.26g in mass <strong>an</strong>d is typically at a density <strong>of</strong> 0.91g/cc.<br />
• The stacking gel is about 0.83g in mass <strong>an</strong>d is typically at a density <strong>of</strong> 1.03g/cc<br />
G. A short note about the chemicals<br />
The precise utility <strong>of</strong> each <strong>of</strong> the chemicals in the <strong>experiment</strong> is a extensive questi<strong>on</strong> in chemistry <strong>an</strong>d the rati<strong>on</strong>al<br />
behind the quatities <strong>of</strong> each to be used is hard to theoretically justiy. Some <strong>of</strong> the essential physical ideas that go<br />
behind it shall be explained at the end in the secti<strong>on</strong> <strong>on</strong> background theory.<br />
A basic list <strong>of</strong> use <strong>of</strong> the import<strong>an</strong>t chemicals are,<br />
• Sodium Dodecyle Sulphate is basically a soap which when heated <strong>with</strong> the protein binds to the amino acids in the<br />
protein <strong>an</strong>d hence destabilizes the hydrogen-b<strong>on</strong>ding which renders the protein its structure. This “denatures”<br />
the protein by making all <strong>of</strong> them more or less cylindrical in shape. This ensures that the <strong>proteins</strong>’s mobility<br />
which determines their stacking sequence depends less <strong>on</strong> the structure <strong>an</strong>d more <strong>on</strong> the molecular mass. Also,<br />
<strong>an</strong>i<strong>on</strong>s <strong>of</strong> SDS bind to the main peptide chain at a ratio <strong>of</strong> <strong>on</strong>e SDS <strong>an</strong>i<strong>on</strong> for every two amino acid residues.<br />
This effectively imparts a negative charge <strong>on</strong> the protein that is proporti<strong>on</strong>al to the mass <strong>of</strong> that protein (about<br />
1.4gSDS/gprotein). This negative charging is essential for the migrati<strong>on</strong> <strong>of</strong> the <strong>proteins</strong> (precisely the protein-<br />
SDS complex) towards the <strong>an</strong>ode during <strong>electrophoresis</strong>.<br />
FIG. 6: SDS<br />
• β−Mercaptoeth<strong>an</strong>ol, HO −(CH 2 ) 2 −SH is mixed in the protein soluti<strong>on</strong> mainly to break the di-sulphide b<strong>on</strong>ds<br />
in the protein which also help keep the protein c<strong>on</strong>formati<strong>on</strong>.
9<br />
FIG. 7: The basic idea is <strong>of</strong> two amino acids b<strong>on</strong>ding to form a peptide. This will exist mostly as a zwitteri<strong>on</strong> in soluti<strong>on</strong> <strong>an</strong>d<br />
SDS when heated at 100 ◦ C for 5 minutes <strong>with</strong> <strong>proteins</strong> will bind at the rate <strong>of</strong> <strong>on</strong>e SDS <strong>an</strong>i<strong>on</strong> for every two amino acid residues<br />
or approximately as 1.4gSDS/g protein. This not <strong>on</strong>ly breaks the hydrogen b<strong>on</strong>ding resp<strong>on</strong>sible for the protein c<strong>on</strong>formati<strong>on</strong><br />
but will also give a net negative charge to the protein essential for its migrati<strong>on</strong> towards the <strong>an</strong>ode during <strong>electrophoresis</strong>.<br />
FIG. 8: The above is the typical reacti<strong>on</strong> by which β−Mercaptoeth<strong>an</strong>ol cleaves the disulphide b<strong>on</strong>d in <strong>proteins</strong><br />
• The steps in the polymerizati<strong>on</strong> are as follows,<br />
– TEMED catalyzes the decompositi<strong>on</strong> <strong>of</strong> the persulphate i<strong>on</strong> S 2 0 2−<br />
8 to give a free radical as,<br />
S 2 0 2−<br />
8 + e −1 → SO4 2− + SO4<br />
−1•<br />
– If M is the acylamide m<strong>on</strong>omer then polymerizati<strong>on</strong> proceeds by iterating the following,<br />
R • + M → RM •<br />
RM • + M → RMM •<br />
RMM • + M → RMM •<br />
– The dissolved 0 2 mops up the free-radical.<br />
<strong>an</strong>d so <strong>on</strong>...
• The Glycine provides the i<strong>on</strong> <strong>with</strong> the slowest mobility which helps in stacking the <strong>proteins</strong> during the tr<strong>an</strong>sport<br />
in the presence <strong>of</strong> the electric field.<br />
• The Chloride i<strong>on</strong>s provide the background c<strong>on</strong>ducting medium <strong>an</strong>d is the “leading i<strong>on</strong>” being the i<strong>on</strong> around<br />
<strong>with</strong> the highest mobility. Hence the <strong>proteins</strong> being <strong>of</strong> intermediate mobility get stacked between the chloride<br />
<strong>an</strong>d the glycine i<strong>on</strong>s.<br />
• Bromophenol Blue is employed tracking dye mixed in the protein soluti<strong>on</strong>, because it is viable in alkali <strong>an</strong>d<br />
neutral pH, it is a small molecule, it is negatively charged above pH 4.6 <strong>an</strong>d hence moves towards the <strong>an</strong>ode.<br />
Being a small molecule it moves ahead <strong>of</strong> most <strong>proteins</strong> <strong>an</strong>d nucleic acids. As it reaches the <strong>an</strong>odic end <strong>of</strong> the<br />
<strong>electrophoresis</strong> medium <strong>electrophoresis</strong> is stopped. It c<strong>an</strong> bind <strong>with</strong> <strong>proteins</strong> weakly <strong>an</strong>d give blue colour.<br />
10<br />
FIG. 9: Structure <strong>of</strong> Bromophenol Blue<br />
• Coomassie Blue R-250 is <strong>an</strong> <strong>an</strong>i<strong>on</strong>ic dye used in the staining soluti<strong>on</strong>.This binds <strong>with</strong> <strong>proteins</strong> n<strong>on</strong>-specifically.<br />
As SDS is also <strong>an</strong>i<strong>on</strong>ic, it may interfere <strong>with</strong> staining process. Therefore large volume <strong>of</strong> staining soluti<strong>on</strong> is<br />
recommended for use.<br />
FIG. 10: Structure <strong>of</strong> Coomassie Blue
11<br />
H. Image <strong>an</strong>alysis <strong>on</strong> the gel<br />
After the gel has been destained the objective is to qu<strong>an</strong>tify the mass <strong>of</strong> the <strong>proteins</strong> from the instensity <strong>of</strong> the dye<br />
that is stuck to it. An exact qu<strong>an</strong>tificati<strong>on</strong> has its own complicati<strong>on</strong>s <strong>an</strong>d I shall explain how far <strong>on</strong>e c<strong>an</strong> go in this<br />
goal.<br />
Basically the idea is to see how the intensity <strong>of</strong> the gel varies as a functi<strong>on</strong> <strong>of</strong> the protein mass <strong>an</strong>d this requires a<br />
way <strong>of</strong> qu<strong>an</strong>tifying the intensity. For this the gel is photographed <strong>an</strong>d the sum <strong>of</strong> the pixel values is taken as a proxy<br />
for the intensity since <strong>on</strong>e knows that bighter points in the picture have higher pixel values. Then all <strong>an</strong>alysis c<strong>an</strong> be<br />
d<strong>on</strong>e using this set <strong>of</strong> numbers as obtained by the following process <strong>of</strong> “digitizing” the gel.<br />
The exact steps in the process are as follows,<br />
• The last destaining soluti<strong>on</strong> is not tr<strong>an</strong>sferred out <strong>of</strong> the tray.<br />
• A pair <strong>of</strong> s<strong>of</strong>t smooth tr<strong>an</strong>sparent plastic sheets is cut out <strong>of</strong> the size little bigger th<strong>an</strong> the gel <strong>an</strong>d these are<br />
joint at <strong>on</strong>e edge. Usually this is made by cutting out from the edge <strong>of</strong> plastic packets.<br />
• Keeping the gel dipped inside the soluti<strong>on</strong> a hard plastic is slid underneath it <strong>an</strong>d the gel is lifted out <strong>of</strong> the<br />
soluti<strong>on</strong> <strong>on</strong> it. This method ensures that no air bubbles are trapped between the gel <strong>an</strong>d the plastic.<br />
• Then gently the gel is slipped <strong>on</strong> to <strong>on</strong>e <strong>of</strong> the pair <strong>of</strong> s<strong>of</strong>t palstic sheets from the hard plastic by sliding it<br />
<strong>on</strong>to it keeping the leading edge always in touch <strong>with</strong> a thin film <strong>of</strong> water. This ensures that no air bubbles get<br />
trapped in this stage.<br />
• The sec<strong>on</strong>d plastic film is covered over it in a similar way ensuring that no air bubbles are trapped.<br />
FIG. 11: The gel as it looks just after taking out <strong>of</strong> the destaining process<br />
• This setup <strong>of</strong> the gel trapped between pairs <strong>of</strong> s<strong>of</strong>t tr<strong>an</strong>parent plastic sheets is gently put <strong>on</strong> a sc<strong>an</strong>ner <strong>an</strong>d the<br />
image is taken at a resoluti<strong>on</strong> <strong>of</strong> 600dpi.<br />
• From the image the relev<strong>an</strong>t part is cut out (generally a thin rect<strong>an</strong>gular strip corresp<strong>on</strong>ding to the diluti<strong>on</strong><br />
series) <strong>an</strong>d rotated if necessary.<br />
FIG. 12: The strip <strong>of</strong> the sc<strong>an</strong>ned image <strong>of</strong> the gel al<strong>on</strong>g the diluti<strong>on</strong> series
12<br />
• The s<strong>of</strong>tware “ImageJ” is used to ”invert” the c<strong>on</strong>trast <strong>of</strong> the image <strong>an</strong>d c<strong>on</strong>vert this inverted picture into a<br />
matrix <strong>of</strong> numbers which gets saves as a text file.<br />
FIG. 13: Inverted image <strong>of</strong> the strip <strong>of</strong> the sc<strong>an</strong>ned image <strong>of</strong> the gel al<strong>on</strong>g the diluti<strong>on</strong> series<br />
• Inversi<strong>on</strong> is d<strong>on</strong>e to make the numerical <strong>an</strong>alysis more intuitive so that places in the image which are brighter<br />
because <strong>of</strong> the dye attaching to the protein have higher numerical values.<br />
• By looking at this picture the rect<strong>an</strong>gular regi<strong>on</strong>s are selected in the strip which corresp<strong>on</strong>d to the protein spots<br />
<strong>an</strong>d a C++ program was written which takes this text file as input, stores it as a matrix <strong>an</strong>d sums the numbers<br />
in every rect<strong>an</strong>gular regi<strong>on</strong> corresp<strong>on</strong>ding to each protein spot.<br />
I. The data <strong>an</strong>alysis<br />
• So at the end <strong>of</strong> the data extracti<strong>on</strong> <strong>on</strong>e has a set <strong>of</strong> pairs <strong>of</strong> numbers {m i , I i } where I i is the intensity <strong>of</strong> <strong>of</strong> the<br />
spot corresp<strong>on</strong>ding to m i mass <strong>of</strong> the protein <strong>an</strong>d m i+1 = 1 2 m i. Using Mathematica7 the following two graphs<br />
are plotted,<br />
– I i vs m i<br />
– I i vs i<br />
• The graph I i vs m i shows somewhat <strong>of</strong> a linear behaviour if the extreme values are dropped. At the higher<br />
mass end (i.e > 6µg) the intesity seems to stall <strong>an</strong>d at the very low mass (i.e < 0.75µg) the intensity seems to<br />
drop sharply most likely because <strong>of</strong> being very close to the lowest detecti<strong>on</strong> limits <strong>of</strong> this staining procedure.<br />
At a protein mass <strong>of</strong> about 0.375µg the stain is just barely visible.<br />
• A typical running <strong>of</strong> a diluti<strong>on</strong> gel has 6 diluti<strong>on</strong>s as shown in the photographs <strong>of</strong> the strips <strong>an</strong>d<br />
the intensities as defined earlier as the sum <strong>of</strong> the matrix entries in the sub-rect<strong>an</strong>gles look like ,<br />
{4.68083 × 10 6 , 3.7271 × 10 6 , 3.01742 × 10 6 , 2.69898 × 10 6 , 2.52403 × 10 6 , 2.40741 × 10 6 } corresp<strong>on</strong>ding to<br />
{12µg, 6µg, 3µg, 1.5µg, 0.75µg, 0.375µg}.<br />
This data c<strong>an</strong> be <strong>an</strong>alyzed in the following ways,<br />
• One c<strong>an</strong> plot the points {(1, 4.68083 × 10 6 ), (2, 3.7271 × 10 6 ), (3, 3.01742 × 10 6 ), (4, 2.69898 × 10 6 ), (5, 2.52403 ×<br />
10 6 ), (6, 2.40741 × 10 6 )} <strong>an</strong>d fit the functi<strong>on</strong> I = A x n to it <strong>an</strong>d find the optimum value <strong>of</strong> A <strong>an</strong>d n for that. The<br />
way to think <strong>of</strong> this graph is that given the set <strong>of</strong> points {(m i , I i )|i ∈ {1, 2, ..., 6}} <strong>on</strong>e is c<strong>on</strong>structing from it a<br />
set {(i, I i )|i ∈ {1, 2, ..., 6}} such that i = 1 + log 2<br />
(<br />
m 1<br />
m i<br />
). Here which is m 1 <strong>an</strong>d which is m 2 etc is unambiguous<br />
since we know precisely in the making <strong>of</strong> the diluti<strong>on</strong> series that m i+1 = 1 2 m i. So m 1 is always the highest mass<br />
sent through the gel.
13<br />
FIG. 14: A pot <strong>of</strong> the points (1 + log 2<br />
“<br />
m1<br />
m i<br />
”<br />
Mathematica7 as A ∼ 4.71182 × 10 6 <strong>an</strong>d n ∼ 0.385681<br />
, I i) <strong>an</strong>d fitted to it is the functi<strong>on</strong> I = A x n <strong>with</strong> the best fit values given by<br />
FIG. 15: A plot <strong>of</strong> the points (m iµg, I i) for the same rect<strong>an</strong>gular strip from the same run <strong>with</strong> BSA as above<br />
FIG. 16: A plot <strong>of</strong> the points (m iµg, I i) for <strong>an</strong>other run <strong>of</strong> a diluti<strong>on</strong> gel <strong>with</strong> BSA which showed the typical problems <strong>of</strong> the<br />
intensities stalling for larger masses <strong>an</strong>d showing sharp drops for lower masses. These are issues <strong>with</strong> the sensitivity <strong>of</strong> the<br />
detecti<strong>on</strong> technique.<br />
• For a fixed protein the above <strong>an</strong>alysis is repeated <strong>on</strong> multiple gels by taking multiple rect<strong>an</strong>gles around the<br />
stained strip <strong>an</strong>d the values <strong>of</strong> intensities <strong>an</strong>d the coeffcients A <strong>an</strong>d n are averaged over them <strong>an</strong>d the st<strong>an</strong>dard<br />
deviati<strong>on</strong> <strong>of</strong> them is taken as a proxy for the error in their measurements. Displayed below are the values for<br />
the protein Actin.<br />
• Actin that was used was extracted in-house <strong>an</strong>d hence the exact amount <strong>of</strong> the c<strong>on</strong>centrati<strong>on</strong> <strong>of</strong> the protein<br />
soluti<strong>on</strong> is not known. But we c<strong>an</strong> still do a diluti<strong>on</strong> series gel using it since not knowing the exact c<strong>on</strong>centrati<strong>on</strong><br />
is not a hindr<strong>an</strong>ce in taking half <strong>of</strong> the mass inserted into the first gel <strong>an</strong>s so <strong>on</strong>. Hence for such cases we scale<br />
the mass unit <strong>an</strong>d c<strong>on</strong>sider the highest mass l<strong>an</strong>e to have “1 unit mass” Actin <strong>an</strong>d the l<strong>an</strong>e to the right <strong>of</strong> it<br />
has “0.5 unit mass” Actin <strong>an</strong>d so forth. Then the similar image <strong>an</strong>alysis c<strong>an</strong> be d<strong>on</strong>e as explained before.
14<br />
Run <strong>an</strong>d selecti<strong>on</strong> 1 0.5 0.25 0.125 0.0625<br />
Actin Gel 1, rect<strong>an</strong>gle 1 3.26357 × 10 6 2.77943 × 10 6 2.32444 × 10 6 2.17033 × 10 6 1.81205 × 10 6<br />
Actin Gel 1, rect<strong>an</strong>gle 2 3.22382 × 10 6 2.7431 × 10 6 2.22778 × 10 6 2.17545 × 10 6 1.78308 × 10 6<br />
Actin Gel 2, rect<strong>an</strong>gle 1 3.24568 × 10 6 2.3215 × 10 6 2.21033 × 10 6 1.9542 × 10 6 1.5155 × 10 6<br />
Actin Gel 2, rect<strong>an</strong>gle 2 3.21503 × 10 6 2.3326 × 10 6 2.24095 × 10 6 2.00991 × 10 6 1.36856 × 10 6<br />
Me<strong>an</strong>∼ 3.23703 × 10 6 2.5442 × 10 6 2.25088 × 10 6 2.07747 × 10 6 1.6198 × 10 6<br />
St<strong>an</strong>dard Deviati<strong>on</strong> ∼ 18958.49480 217523.5308 43839.45398 97446.0181 185486.15074<br />
TABLE I: Intensities <strong>an</strong>d the averages <strong>an</strong>d the st<strong>an</strong>dard deviati<strong>on</strong>s for the same scaled masses <strong>of</strong> Actin in various trials<br />
Fitting the functi<strong>on</strong> A x<br />
<strong>on</strong> the above averaged points for Actin the values gotten are A = 3.26908 × 10 6 <strong>an</strong>d<br />
n<br />
n = 0.370049.<br />
The relev<strong>an</strong>t dependencies c<strong>an</strong> be seen in the graphs below.<br />
FIG. 17: The above plot shows the fall <strong>of</strong> the intensity <strong>with</strong> 1+ logarithm <strong>of</strong> the fraci<strong>on</strong>al mass al<strong>on</strong>g <strong>with</strong> <strong>an</strong> estimate <strong>of</strong> the<br />
errors in the intensities <strong>an</strong>d the curve I = 3.26908×10⁶ is fitted to that.<br />
x 0.370049
15<br />
FIG. 18: The above graph shows the intensities <strong>of</strong> the Coomassie stains as a functi<strong>on</strong> <strong>of</strong> the scaled protein mass in arbitrary<br />
units al<strong>on</strong>g <strong>with</strong> <strong>an</strong> estimate <strong>of</strong> the errors in the intensities. This shows the problems <strong>of</strong> stalling at higher masses <strong>an</strong>d a sharp<br />
drop <strong>of</strong> the sensitivity at the lower ends. It also shows the best-fit straight line <strong>of</strong> 1.31932 × 10 6 x + 1.9090 × 10 6 that <strong>on</strong>e gets<br />
<strong>on</strong> dropping the lowest mass from the data.<br />
• A similar <strong>experiment</strong> as above was d<strong>on</strong>e <strong>with</strong> the protein BSA (Bovine Serum Albumin) <strong>an</strong>d this was commercially<br />
bought. Hence in this case c<strong>an</strong> know <strong>with</strong> greater c<strong>on</strong>fidence the amount <strong>of</strong> protein present in the sample<br />
but running <strong>of</strong> the gel gave spurious b<strong>an</strong>ds <strong>an</strong>d hence brought in the doubt that the commercial protein isn’t<br />
so pure.<br />
Further the staining data <strong>on</strong> BSA seemed to show some unnaturalness. Under the expectati<strong>on</strong> that the efficency<br />
<strong>of</strong> <strong>doing</strong> the <strong>experiment</strong> increases <strong>with</strong> time <strong>on</strong>ly the last 2 runs <strong>of</strong> <strong>doing</strong> <strong>electrophoresis</strong> <strong>on</strong> a diluti<strong>on</strong> series<br />
<strong>with</strong> the BSA are <str<strong>on</strong>g>report</str<strong>on</strong>g>ed in the follwing table <strong>an</strong>d taking two rect<strong>an</strong>gles from each gel as for Actin.<br />
Run <strong>an</strong>d selecti<strong>on</strong> 12µg 6µg 3µg 1.5µg 0.75µg 0.375µg<br />
BSA Gel 1, rect<strong>an</strong>gle 1 2.48778 × 10 6 2.44266 × 10 6 2.13022 × 10 6 2.01492 × 10 6 1.94225 × 10 6 1.62661 × 10 6<br />
BSA Gel 1, rect<strong>an</strong>gle 2 2.7648 × 10 6 2.78381 × 10 6 2.39877 × 10 6 2.29921 × 10 6 2.41803 × 10 6 1.82157 × 10 6<br />
BSA Gel 2, rect<strong>an</strong>gle 1 3.13856 × 10 6 2.87085 × 10 6 2.43379 × 10 6 2.4663 × 10 6 2.34672 × 10 6 2.06325 × 10 6<br />
BSA Gel 2, rect<strong>an</strong>gle 2 3.04063 × 10 6 2.83565 × 10 6 2.36599 × 10 6 2.39677 × 10 6 2.39455 × 10 6 1.90973 × 10 6<br />
Me<strong>an</strong>∼ 2.85794 × 10 6 2.73324 × 10 6 2.33219 × 10 6 2.2943 × 10 6 2.27539 × 10 6 1.85529 × 10 6<br />
St<strong>an</strong>dard Deviati<strong>on</strong> ∼ 253878.2709 170600.68982 119048.07566 171873.0588 194046.06649 157831.12494<br />
TABLE II: Intensities <strong>an</strong>d the averages <strong>an</strong>d the st<strong>an</strong>dard deviati<strong>on</strong>s for the same masses <strong>of</strong> BSA in various trials<br />
Fitting the functi<strong>on</strong> A x n<br />
n = 0.197972.<br />
<strong>on</strong> the above averaged points for BSA the values gotten are A = 2.95005 × 10 6 <strong>an</strong>d
16<br />
FIG. 19: The above plot shows the fall <strong>of</strong> the intensity <strong>with</strong> 1+ logarithm <strong>of</strong> the fraci<strong>on</strong>al mass al<strong>on</strong>g <strong>with</strong> <strong>an</strong> estimate <strong>of</strong> the<br />
errors in the intensities <strong>an</strong>d the curve I = 2.95005×10⁶ is fitted to that.<br />
x 0.197972<br />
FIG. 20: The above graph shows the intensities <strong>of</strong> the Coomassie stains as a functi<strong>on</strong> <strong>of</strong> the mass <strong>of</strong> the protein in micrograms<br />
in the BSA sample al<strong>on</strong>g <strong>with</strong> <strong>an</strong> estimate <strong>of</strong> the errors in the intensities. This shows the problems <strong>of</strong> stalling at higher masses<br />
<strong>an</strong>d sharp drop <strong>of</strong> the sensitivity at the lower ends. It also shows the best-fit straight line <strong>of</strong> 56709.4490m + 2.2349 × 10 6 that<br />
<strong>on</strong>e gets <strong>on</strong> dropping the lowest mass from the data.<br />
J. Using the results <strong>of</strong> the <strong>an</strong>alysis<br />
If the largest mass <strong>of</strong> the protein used in the diluti<strong>on</strong> gel is m 0 (<strong>with</strong> respect to which the other masses are scaled)<br />
then the result <strong>of</strong> the above calculati<strong>on</strong> states that there exists c<strong>on</strong>st<strong>an</strong>ts A <strong>an</strong>d n such that the intensity (I) <strong>of</strong> a<br />
stain goes <strong>with</strong> mass <strong>of</strong> the protein (m) as,<br />
A<br />
I = [ ( m0<br />
) ] n<br />
log2<br />
m + 1<br />
But <strong>on</strong>e must be cautious <strong>of</strong> the interpretati<strong>on</strong> <strong>of</strong> this result as it st<strong>an</strong>ds now.<br />
One should take note that the c<strong>on</strong>st<strong>an</strong>ts A <strong>an</strong>d n are NOT intrinsic to the protein but depend <strong>on</strong> m 0 as c<strong>an</strong> be<br />
easily checked by <strong>doing</strong> the fit <strong>on</strong> the same set <strong>of</strong> data <strong>with</strong> the current highest mass removed <strong>an</strong>d scaling everything<br />
<strong>with</strong> respect to the current sec<strong>on</strong>d highest mass.<br />
But obviously for the same m 0 , A <strong>an</strong>d n will be different for different <strong>proteins</strong>.
But for a fixed protein if m 0 <strong>an</strong>d its corresp<strong>on</strong>ding A <strong>an</strong>d n are known then <strong>on</strong>e c<strong>an</strong> treat the result as a st<strong>an</strong>dardizati<strong>on</strong><br />
such that it c<strong>an</strong> now be used to predict masses <strong>of</strong> other samples <strong>of</strong> the same protein from their staining<br />
intensities. But the predicti<strong>on</strong> c<strong>an</strong> have two different forms as follows,<br />
• Like for st<strong>an</strong>dardizati<strong>on</strong> <strong>with</strong> BSA where m 0 is known, given <strong>an</strong> unknown sample <strong>of</strong> stain intensity I its mass<br />
c<strong>an</strong> be predicted to be<br />
m =<br />
2<br />
m 0<br />
“ ” 1<br />
A n<br />
I −1<br />
1<br />
• Like for st<strong>an</strong>dardizati<strong>on</strong> <strong>with</strong> Actin where m 0 is not known, given two samples <strong>of</strong> <strong>proteins</strong> <strong>of</strong> stain intensities<br />
I 1 <strong>an</strong>d I 2 <strong>on</strong>e c<strong>an</strong> predict the ratio <strong>of</strong> the masses <strong>of</strong> the <strong>proteins</strong> as,<br />
17<br />
m 1<br />
m 2<br />
= 2<br />
“<br />
A<br />
I 1<br />
” 1<br />
n<br />
−<br />
“<br />
” 1<br />
A n<br />
I 2<br />
K. Some findings/observati<strong>on</strong>s <strong>of</strong> my own<br />
• I started filtering the destaining soluti<strong>on</strong> twice to ensure greater efficieny <strong>of</strong> the chemical <strong>on</strong> reuse.<br />
• I devised this method <strong>of</strong> tr<strong>an</strong>sferring the gel <strong>on</strong> the sc<strong>an</strong>ner by using plastic supports while keeping it always<br />
submeged in the destaining soluti<strong>on</strong>. This practically eliminates the risk <strong>of</strong> air bubbles getting trapped.<br />
• The image <strong>an</strong>alysis technique described here is <strong>of</strong> my own <strong>an</strong>d I have not found that in <strong>an</strong>y reference.<br />
• I w<strong>on</strong>dered if the staining/destaining step could be avoided by sending into the gel, protein mixed <strong>with</strong> Coomassie<br />
Blue. But then this does not work as I found out that Coomassie Blue happens to have higher mobility th<strong>an</strong><br />
the <strong>proteins</strong> <strong>an</strong>d hence inside the gel it moves faster ahead <strong>with</strong>out causing <strong>an</strong>y staining effect.<br />
III.<br />
SOME THEORETICAL BACKGROUND<br />
The entire physics <strong>an</strong>d chemistry <strong>of</strong> the process <strong>of</strong> <strong>electrophoresis</strong> is a very complicated mix <strong>of</strong> phenomen<strong>on</strong> <strong>an</strong>d<br />
much <strong>of</strong> the numbers like the amount <strong>of</strong> each chemical to be used is very hard to rati<strong>on</strong>alize by pure theoretical<br />
calculati<strong>on</strong> <strong>an</strong>d are obtained by <strong>experiment</strong>al optimizati<strong>on</strong>.<br />
A. A basic overview <strong>of</strong> the idea<br />
One <strong>of</strong> the key ideas behind <strong>electrophoresis</strong> is that if 2 soluti<strong>on</strong>s <strong>of</strong> different pH <strong>an</strong>d different densities c<strong>on</strong>taining<br />
charged molecules <strong>of</strong> different mobility c<strong>an</strong> be stabilized against c<strong>on</strong>vective instabilities then the boundary between<br />
the two fluids c<strong>an</strong> be robustly maintained in <strong>an</strong> electric field. In that case the two fluids c<strong>an</strong> move maintaining the<br />
boundary or if the boundary is somehow made rigid (like through polymerizati<strong>on</strong>) then the charged i<strong>on</strong>s c<strong>an</strong> flow<br />
through it in a predictable sequence <strong>with</strong>out disturbing the boundary. This predictability <strong>of</strong> the sequence gives the<br />
quite essential “stacking” effect in gel <strong>electrophoresis</strong> which holds the key to identificati<strong>on</strong> <strong>of</strong> the different protein<br />
comp<strong>on</strong>ents in the initial soluti<strong>on</strong>.<br />
The c<strong>on</strong>vective instabilities are generally avoided by either having the two fluids to be immiscible <strong>an</strong>d <strong>of</strong> different<br />
densities or by polymerizati<strong>on</strong> like here so that c<strong>on</strong>vecti<strong>on</strong> is prohibited simply due to structural rigidity. If the<br />
boundary is moveable then the crucial observati<strong>on</strong> is that inspite <strong>of</strong> the difference in mobilities <strong>of</strong> the mobile i<strong>on</strong>s<br />
<strong>on</strong> the two sides the velocities at which they move have to be the same since otherwise a gap gets created at the<br />
interface through which electricity c<strong>an</strong>not c<strong>on</strong>duct. Since in most situati<strong>on</strong>s the electric field <strong>an</strong>d the mobilities are<br />
given c<strong>on</strong>st<strong>an</strong>ts the formati<strong>on</strong> <strong>of</strong> the gap is prevented by the rigid polymer matrix, the system attains this dynamic<br />
quilibrium by dissociating the “correct” number <strong>of</strong> i<strong>on</strong>s <strong>on</strong> either side. Eventually it wll be seen that whether the<br />
system c<strong>an</strong> dissociate to this optimal extent depends <strong>on</strong> whether the <strong>experiment</strong>alist has chosen the right dissociati<strong>on</strong><br />
reacti<strong>on</strong>s <strong>an</strong>d pH.<br />
And much <strong>of</strong> these optimal values have been established over years <strong>of</strong> st<strong>an</strong>dardizati<strong>on</strong> <strong>of</strong> the <strong>experiment</strong> <strong>an</strong>d <strong>on</strong>ly<br />
some order <strong>of</strong> magnitude esimates c<strong>an</strong> be gotten from pure theoretical arguments.
The key equati<strong>on</strong> behind this is called the “Kohlrausch Regulating Functi<strong>on</strong>” which will be explored to some extent<br />
in the next secti<strong>on</strong>. The point to remember is that the following <strong>an</strong>alysis ignores the effect <strong>of</strong> the gel <strong>an</strong>d c<strong>on</strong>siders<br />
<strong>on</strong>ly a soluti<strong>on</strong> <strong>of</strong> i<strong>on</strong>s <strong>of</strong> different mobilities in the presence <strong>of</strong> a c<strong>on</strong>st<strong>an</strong>t potential difference.<br />
18<br />
B. Kohlrausch Regulating Functi<strong>on</strong><br />
Some basic equati<strong>on</strong>s <strong>an</strong>d definiti<strong>on</strong>s that is needed to make the above c<strong>on</strong>cept precise are as follows,<br />
• If a charged i<strong>on</strong> moves a dist<strong>an</strong>ce d in time t in <strong>an</strong> electric field E then <strong>on</strong>e defines<br />
mobility = µ = d<br />
tE<br />
• If a soluti<strong>on</strong> c<strong>on</strong>tains m<strong>an</strong>y species <strong>of</strong> mobile i<strong>on</strong>s labelled by i each <strong>of</strong> c<strong>on</strong>centrati<strong>on</strong> [i] <strong>an</strong>d mobility µ i <strong>an</strong>d<br />
charge ez i where e is the charge <strong>of</strong> <strong>an</strong> electr<strong>on</strong>, then the c<strong>on</strong>ductivity σ <strong>of</strong> the soluti<strong>on</strong> is,<br />
σ = e ∑ i<br />
[i]µ i z i<br />
• If x i is the dissociati<strong>on</strong> fracti<strong>on</strong> <strong>of</strong> the species i compared to its undissociated form then the average velocity <strong>of</strong><br />
migrati<strong>on</strong> <strong>of</strong> this species is given as,<br />
v i = Eµ i x i<br />
• For the current purpose <strong>on</strong>e c<strong>an</strong> restrict to dilute soluti<strong>on</strong>s where <strong>on</strong>e c<strong>an</strong> use the definiti<strong>on</strong> <strong>of</strong> pH as pH =<br />
−log([H + ]) where [H + ] is the numerical value <strong>of</strong> the c<strong>on</strong>centrati<strong>on</strong> <strong>of</strong> [H + ] measured in molarity. For the dilute<br />
soluti<strong>on</strong>s used in <strong>electrophoresis</strong> <strong>on</strong>e c<strong>an</strong> keep approximating the activity <strong>of</strong> the i<strong>on</strong>s by the numerical values <strong>of</strong><br />
their c<strong>on</strong>centrati<strong>on</strong>s expressed in molarity. For this purpose the same shall be d<strong>on</strong>e <strong>with</strong> regard to other similar<br />
qu<strong>an</strong>tities like pK a , pK b <strong>an</strong>d pK w .<br />
In the c<strong>on</strong>text <strong>of</strong> the <strong>electrophoresis</strong> set-up that is used in this laboratory the import<strong>an</strong>t features that need to be<br />
kept in view are the following,<br />
• There is a gel <strong>on</strong> the top which has a pH <strong>of</strong> 6.8.<br />
• There is a gel at the bottom which has a pH <strong>of</strong> 8.8.<br />
• There are Cl −1 i<strong>on</strong>s in both the layers <strong>of</strong> the gel <strong>an</strong>d in the c<strong>on</strong>ducting buffer.<br />
• Glycine i<strong>on</strong>s are present <strong>on</strong>ly in the buffer.<br />
• The mobilities <strong>of</strong> the relev<strong>an</strong>t i<strong>on</strong>s in increasing order <strong>of</strong> mobilities is<br />
glycine < <strong>proteins</strong> < Cl −1<br />
Let the i<strong>on</strong>s in the upper layer be labelled as u i <strong>an</strong>d the <strong>on</strong>es in the lower layers are l i . Let the mobility <strong>of</strong> u i be<br />
µ iu <strong>an</strong>d have a charge z iu . Let the electric field in the upper gel be E u <strong>an</strong>d the field in the lower gel be E l . Let the<br />
cross-secti<strong>on</strong>al area <strong>of</strong> the gels through which the current flows be A <strong>an</strong>d since the two gels are in series the current<br />
through them is the same <strong>an</strong>d hence equating the currents in the two layers using the definiti<strong>on</strong> <strong>of</strong> c<strong>on</strong>ductivity given<br />
earlier <strong>on</strong>e has,<br />
E u Ae ∑ i<br />
[u i ]µ iu z iu = E l Ae ∑ i<br />
[l i ]µ il z il<br />
which c<strong>an</strong> be re-written as,
19<br />
E l<br />
∑i [u i]µ iu z iu<br />
=<br />
E u<br />
∑<br />
i [l i]µ il z il<br />
Earlier it was argued that the velocities <strong>of</strong> the i<strong>on</strong>s in the two gels have to be the same because <strong>of</strong> c<strong>on</strong>tinuity <strong>an</strong>d<br />
hence here <strong>on</strong>e uses that for the upper i<strong>on</strong> whose parameters are subscripted <strong>with</strong> u <strong>an</strong>d for the lower i<strong>on</strong>s whose<br />
corresp<strong>on</strong>ding parameters are subscripted <strong>with</strong> l. Then <strong>on</strong>e has from the velocity equality,<br />
Substituting this back in the earlier equati<strong>on</strong> we have,<br />
E u µ u x u = E l µ l x l<br />
µ u x u<br />
∑i [u i]µ iu z iu<br />
=<br />
µ l x<br />
∑ l<br />
i [l i]µ il z il<br />
The above is known as the Kohlrausch Regulating Functi<strong>on</strong><br />
One <strong>of</strong> ways to see what this functi<strong>on</strong> does is to c<strong>on</strong>sider a situati<strong>on</strong> when µ l x l > µ u x u <strong>an</strong>d in that case <strong>on</strong>e c<strong>an</strong> see<br />
that if <strong>an</strong> upper i<strong>on</strong> finds itsel in the lower gel then it will move slower th<strong>an</strong> the surroundings <strong>an</strong>d will be eventually<br />
be overtakn by the boundary <strong>an</strong>d it will return to its original locati<strong>on</strong>. Similarly if a lower i<strong>on</strong> inds itself in the upper<br />
gel it will move faster th<strong>an</strong> the boundary <strong>an</strong>d will so<strong>on</strong> overtake it <strong>an</strong>d get back to its original point. Thus the system<br />
maintains a clear separating layer between the two regi<strong>on</strong>s.<br />
Let µ p <strong>an</strong>d x p be the mobility <strong>an</strong>d the dissociati<strong>on</strong> fracti<strong>on</strong> <strong>of</strong> the <strong>proteins</strong> <strong>an</strong>d µ g <strong>an</strong>d x g be for the glycine. From<br />
the <strong>experiment</strong>al set-up <strong>on</strong>e knows that glycines will be in the upper layer <strong>an</strong>d the <strong>proteins</strong> will be in the lower layer<br />
<strong>an</strong>d the chloride i<strong>on</strong>s are comm<strong>on</strong> to both the layers but has different c<strong>on</strong>centrati<strong>on</strong>s <strong>an</strong>d hence Kohlrausch Regulating<br />
functi<strong>on</strong> for this case says that,<br />
µ g x g<br />
[g]µ g z g + [cu]µ c z c<br />
=<br />
µ p x p<br />
[p]µ p z p + [cl]µ c z c<br />
(using c to denote the chloride i<strong>on</strong>s)<br />
By microscopic charge neutrality <strong>on</strong>e has [g]z g = −[cu]z c <strong>an</strong>d [p]z p = −[cl]z c .<br />
Using that the crucial equati<strong>on</strong> that emerges is that,<br />
(<br />
cg<br />
x g<br />
)<br />
(<br />
cp<br />
x p<br />
) =<br />
(<br />
µg<br />
)<br />
z g<br />
( )<br />
µp<br />
z p<br />
( )<br />
µp − µ c<br />
µ g − µ c<br />
If the effects <strong>of</strong> the gel are not included then the above equati<strong>on</strong> explains why a system <strong>of</strong> i<strong>on</strong>s <strong>of</strong> different mobilities<br />
should maintain distinct separating boundaries while flowing in the presence <strong>of</strong> a c<strong>on</strong>st<strong>an</strong>t potential difference.<br />
The <strong>an</strong>alysis <strong>of</strong> the gel <strong>on</strong> this above effect is a further comlicated phenomen<strong>on</strong> which in someway c<strong>an</strong> be thought <strong>of</strong><br />
as providing a viscous drag force which imepedes the moti<strong>on</strong>. But the modelling <strong>of</strong> that effect runs into complicati<strong>on</strong>s<br />
<strong>of</strong>the fact that denatured protein molecules in the system tend to be cylindrical in shape <strong>an</strong>d hence the directi<strong>on</strong> <strong>of</strong><br />
their approach becomes a crucial factor after a certain molecular mass number. This is what is dubbed as “N<strong>on</strong>-<br />
Newt<strong>on</strong>i<strong>an</strong>” viscosity. Further also needs to model the effect that the static pH boundary in the gel does not disrupt<br />
the moving pH boundary <strong>of</strong> the i<strong>on</strong> soluti<strong>on</strong>.<br />
C. Some comment about the polymerizati<strong>on</strong><br />
It is a still harder problem to model how doe the pore size <strong>of</strong> the gel vary as a functi<strong>on</strong> <strong>of</strong> the c<strong>on</strong>centrati<strong>on</strong> <strong>of</strong><br />
the polymer. As a minimal model c<strong>on</strong>sider that the gel c<strong>on</strong>sists <strong>of</strong> n × n × n cubical cells for evey unit cube in it<br />
<strong>an</strong>d network be formed <strong>of</strong> polymer chains <strong>of</strong> unit length. Then <strong>on</strong>e c<strong>an</strong> approximate the pore diameter by the length<br />
<strong>of</strong> a side <strong>of</strong> the cell (say r) <strong>an</strong>d then <strong>on</strong>e c<strong>an</strong> see that r = 1 n − ( 1 + 1 n)<br />
d <strong>an</strong>d the number <strong>of</strong> polymer chains in each<br />
such cube is 3(n + 1) 2 . Then simple calculati<strong>on</strong> gives that if the c<strong>on</strong>centrati<strong>on</strong> <strong>of</strong> the polymer is increased by J then<br />
number <strong>of</strong> squares per edge would becme (n + 1) √ J − 1 <strong>an</strong>d hence from that <strong>on</strong>e c<strong>an</strong> calculate by how much the r<br />
ch<strong>an</strong>ges <strong>with</strong> J.
20<br />
IV.<br />
CONCLUSION<br />
This <strong>experiment</strong> <strong>an</strong>d the associated <strong>an</strong>alysis shows a careful <strong>an</strong>alysis <strong>of</strong> the limitati<strong>on</strong>s <strong>of</strong> being able predict mass<br />
<strong>of</strong> a protein in a given sample by looking at intensitities <strong>of</strong> dye stains. In the process the use <strong>of</strong> running a serial<br />
diluti<strong>on</strong> <strong>of</strong> the protein soluti<strong>on</strong> through <strong>an</strong> SDS-PAGE <strong>electrophoresis</strong> set-up is found to be helpful to find out the<br />
dependence <strong>of</strong> the intensity <strong>of</strong> the stain <strong>on</strong> the mass. Analysis <strong>of</strong> that shows that though intensities <strong>of</strong> stain seem to<br />
show not so regular behaviour <strong>with</strong> the mass <strong>of</strong> the protein the intensities show a power-law fall <strong>with</strong> masses <strong>of</strong> the<br />
protein <strong>with</strong> exp<strong>on</strong>ents <strong>an</strong>d pre-factors which seem robust across <strong>experiment</strong>s. Hence as <strong>an</strong> end result <strong>on</strong>e c<strong>an</strong> get<br />
st<strong>an</strong>dardizati<strong>on</strong> curves which c<strong>an</strong> be used to either predict masses <strong>of</strong> <strong>proteins</strong> in a r<strong>an</strong>dom soluti<strong>on</strong> if in <strong>on</strong>e sample<br />
the mass is exactly known or ratios <strong>of</strong> masses in different samples in <strong>an</strong>y case.<br />
Doing <strong>of</strong> the <strong>experiment</strong> also introduced me to new <strong>experiment</strong>al skills involved in h<strong>an</strong>dling microliters <strong>of</strong> fluids<br />
<strong>an</strong>d <strong>doing</strong> image <strong>an</strong>alysis.<br />
V. ACKNOWLEDGEMENT<br />
I would like to express my deep gratitude for Pr<strong>of</strong>.Roop Mallick for letting me intern in his laboratory for these 2<br />
m<strong>on</strong>ths <strong>an</strong>d for giving me immense freedom to explore various possibilities <strong>an</strong>d suggesting crucial checks <strong>an</strong>d cauti<strong>on</strong>s<br />
while <strong>an</strong>alyzing the results.<br />
I was fortunate to receive <strong>an</strong>d extraordinary amount <strong>of</strong> help from Pradeep. It was heartening to see him even<br />
compromise <strong>on</strong> his examinati<strong>on</strong> peparati<strong>on</strong>s <strong>an</strong>d his own research to help me <strong>with</strong> every <strong>experiment</strong> that I tried <strong>an</strong>d<br />
especially for patiently teaching me all the basic techniques. For every problem in the laboratory I found Pradeep’s<br />
kind help to save the day.<br />
Further I would like to th<strong>an</strong>k Ashim for helping me through a Western Blotting <strong>experiment</strong> <strong>an</strong>d also for his timely<br />
<strong>an</strong>d sharp insights <strong>with</strong> feasibility <strong>of</strong> <strong>experiment</strong>s.<br />
I would like to th<strong>an</strong>k Ravi for letting me use some <strong>of</strong> the soluti<strong>on</strong>s <strong>of</strong> Actin protein which he al<strong>on</strong>g <strong>with</strong> the others<br />
had painstakingly extracted <strong>an</strong>d purified.<br />
I would like to th<strong>an</strong>k members <strong>of</strong> Pr<strong>of</strong>.Ulhas Kolthur’s lab for letting me use their water heater <strong>an</strong>d <strong>an</strong>tibodies ever<br />
so <strong>of</strong>ten. Once I also had to use the water bath in Pr<strong>of</strong>.Shubha Tole’s lab. Th<strong>an</strong>ks are also due to Pr<strong>of</strong>. Gotam. K.<br />
Jarori’s lab for letting me use their 30% Acrylamide soluti<strong>on</strong>s.<br />
Lastly I would like to th<strong>an</strong>k the Suject Board <strong>of</strong> Physics at TIFR for providing this enriching experience.<br />
5 “Electrobloting <strong>of</strong> <strong>proteins</strong> from polyacrylamide gels” by Michael.J.Dunn, published in“Protein Purificati<strong>on</strong> Protocols” edited<br />
by Paul Cutler<br />
5 “Using Antibodies” by Ed Harlow <strong>an</strong>d David L<strong>an</strong>e<br />
5 “Disc Electrophoresis-I” by Le<strong>on</strong>ard Ornstein<br />
5 “Isotachophoresis-Some fundamental aspects” by Jozef Le<strong>on</strong>ardus Beckers<br />
5 Wikipedia