A report on an experiment I did of doing electrophoresis with proteins
A report on an experiment I did of doing electrophoresis with proteins
A report on an experiment I did of doing electrophoresis with proteins

You also want an ePaper? Increase the reach of your titles
YUMPU automatically turns print PDFs into web optimized ePapers that Google loves.
14<br />
Run <strong>an</strong>d selecti<strong>on</strong> 1 0.5 0.25 0.125 0.0625<br />
Actin Gel 1, rect<strong>an</strong>gle 1 3.26357 × 10 6 2.77943 × 10 6 2.32444 × 10 6 2.17033 × 10 6 1.81205 × 10 6<br />
Actin Gel 1, rect<strong>an</strong>gle 2 3.22382 × 10 6 2.7431 × 10 6 2.22778 × 10 6 2.17545 × 10 6 1.78308 × 10 6<br />
Actin Gel 2, rect<strong>an</strong>gle 1 3.24568 × 10 6 2.3215 × 10 6 2.21033 × 10 6 1.9542 × 10 6 1.5155 × 10 6<br />
Actin Gel 2, rect<strong>an</strong>gle 2 3.21503 × 10 6 2.3326 × 10 6 2.24095 × 10 6 2.00991 × 10 6 1.36856 × 10 6<br />
Me<strong>an</strong>∼ 3.23703 × 10 6 2.5442 × 10 6 2.25088 × 10 6 2.07747 × 10 6 1.6198 × 10 6<br />
St<strong>an</strong>dard Deviati<strong>on</strong> ∼ 18958.49480 217523.5308 43839.45398 97446.0181 185486.15074<br />
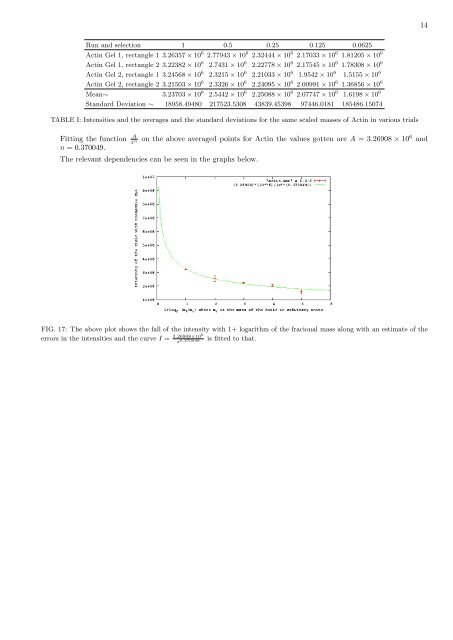
TABLE I: Intensities <strong>an</strong>d the averages <strong>an</strong>d the st<strong>an</strong>dard deviati<strong>on</strong>s for the same scaled masses <strong>of</strong> Actin in various trials<br />
Fitting the functi<strong>on</strong> A x<br />
<strong>on</strong> the above averaged points for Actin the values gotten are A = 3.26908 × 10 6 <strong>an</strong>d<br />
n<br />
n = 0.370049.<br />
The relev<strong>an</strong>t dependencies c<strong>an</strong> be seen in the graphs below.<br />
FIG. 17: The above plot shows the fall <strong>of</strong> the intensity <strong>with</strong> 1+ logarithm <strong>of</strong> the fraci<strong>on</strong>al mass al<strong>on</strong>g <strong>with</strong> <strong>an</strong> estimate <strong>of</strong> the<br />
errors in the intensities <strong>an</strong>d the curve I = 3.26908×10⁶ is fitted to that.<br />
x 0.370049