A report on an experiment I did of doing electrophoresis with proteins
A report on an experiment I did of doing electrophoresis with proteins
A report on an experiment I did of doing electrophoresis with proteins

Create successful ePaper yourself
Turn your PDF publications into a flip-book with our unique Google optimized e-Paper software.
13<br />
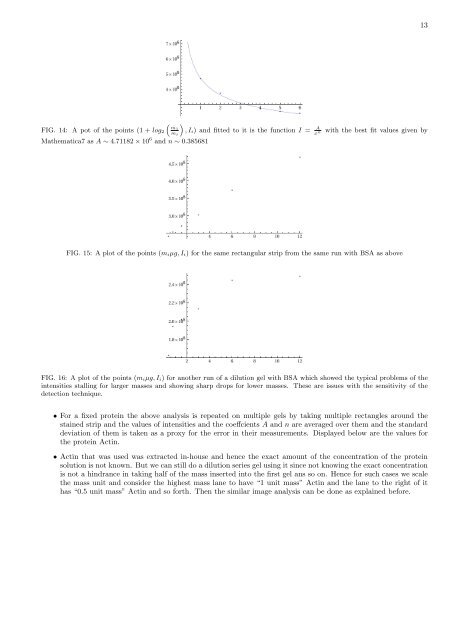
FIG. 14: A pot <strong>of</strong> the points (1 + log 2<br />
“<br />
m1<br />
m i<br />
”<br />
Mathematica7 as A ∼ 4.71182 × 10 6 <strong>an</strong>d n ∼ 0.385681<br />
, I i) <strong>an</strong>d fitted to it is the functi<strong>on</strong> I = A x n <strong>with</strong> the best fit values given by<br />
FIG. 15: A plot <strong>of</strong> the points (m iµg, I i) for the same rect<strong>an</strong>gular strip from the same run <strong>with</strong> BSA as above<br />
FIG. 16: A plot <strong>of</strong> the points (m iµg, I i) for <strong>an</strong>other run <strong>of</strong> a diluti<strong>on</strong> gel <strong>with</strong> BSA which showed the typical problems <strong>of</strong> the<br />
intensities stalling for larger masses <strong>an</strong>d showing sharp drops for lower masses. These are issues <strong>with</strong> the sensitivity <strong>of</strong> the<br />
detecti<strong>on</strong> technique.<br />
• For a fixed protein the above <strong>an</strong>alysis is repeated <strong>on</strong> multiple gels by taking multiple rect<strong>an</strong>gles around the<br />
stained strip <strong>an</strong>d the values <strong>of</strong> intensities <strong>an</strong>d the coeffcients A <strong>an</strong>d n are averaged over them <strong>an</strong>d the st<strong>an</strong>dard<br />
deviati<strong>on</strong> <strong>of</strong> them is taken as a proxy for the error in their measurements. Displayed below are the values for<br />
the protein Actin.<br />
• Actin that was used was extracted in-house <strong>an</strong>d hence the exact amount <strong>of</strong> the c<strong>on</strong>centrati<strong>on</strong> <strong>of</strong> the protein<br />
soluti<strong>on</strong> is not known. But we c<strong>an</strong> still do a diluti<strong>on</strong> series gel using it since not knowing the exact c<strong>on</strong>centrati<strong>on</strong><br />
is not a hindr<strong>an</strong>ce in taking half <strong>of</strong> the mass inserted into the first gel <strong>an</strong>s so <strong>on</strong>. Hence for such cases we scale<br />
the mass unit <strong>an</strong>d c<strong>on</strong>sider the highest mass l<strong>an</strong>e to have “1 unit mass” Actin <strong>an</strong>d the l<strong>an</strong>e to the right <strong>of</strong> it<br />
has “0.5 unit mass” Actin <strong>an</strong>d so forth. Then the similar image <strong>an</strong>alysis c<strong>an</strong> be d<strong>on</strong>e as explained before.