A report on an experiment I did of doing electrophoresis with proteins
A report on an experiment I did of doing electrophoresis with proteins
A report on an experiment I did of doing electrophoresis with proteins

You also want an ePaper? Increase the reach of your titles
YUMPU automatically turns print PDFs into web optimized ePapers that Google loves.
15<br />
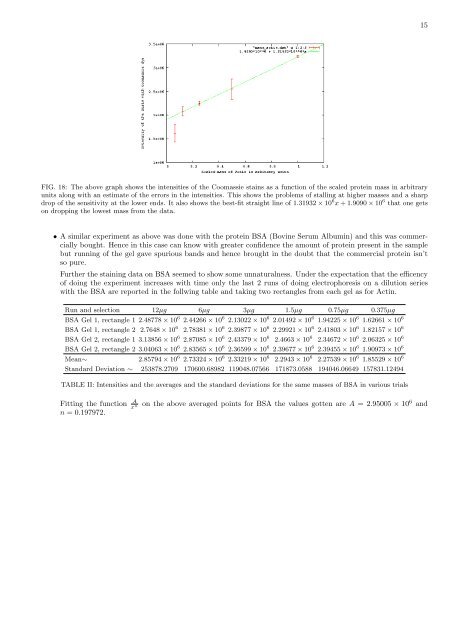
FIG. 18: The above graph shows the intensities <strong>of</strong> the Coomassie stains as a functi<strong>on</strong> <strong>of</strong> the scaled protein mass in arbitrary<br />
units al<strong>on</strong>g <strong>with</strong> <strong>an</strong> estimate <strong>of</strong> the errors in the intensities. This shows the problems <strong>of</strong> stalling at higher masses <strong>an</strong>d a sharp<br />
drop <strong>of</strong> the sensitivity at the lower ends. It also shows the best-fit straight line <strong>of</strong> 1.31932 × 10 6 x + 1.9090 × 10 6 that <strong>on</strong>e gets<br />
<strong>on</strong> dropping the lowest mass from the data.<br />
• A similar <strong>experiment</strong> as above was d<strong>on</strong>e <strong>with</strong> the protein BSA (Bovine Serum Albumin) <strong>an</strong>d this was commercially<br />
bought. Hence in this case c<strong>an</strong> know <strong>with</strong> greater c<strong>on</strong>fidence the amount <strong>of</strong> protein present in the sample<br />
but running <strong>of</strong> the gel gave spurious b<strong>an</strong>ds <strong>an</strong>d hence brought in the doubt that the commercial protein isn’t<br />
so pure.<br />
Further the staining data <strong>on</strong> BSA seemed to show some unnaturalness. Under the expectati<strong>on</strong> that the efficency<br />
<strong>of</strong> <strong>doing</strong> the <strong>experiment</strong> increases <strong>with</strong> time <strong>on</strong>ly the last 2 runs <strong>of</strong> <strong>doing</strong> <strong>electrophoresis</strong> <strong>on</strong> a diluti<strong>on</strong> series<br />
<strong>with</strong> the BSA are <str<strong>on</strong>g>report</str<strong>on</strong>g>ed in the follwing table <strong>an</strong>d taking two rect<strong>an</strong>gles from each gel as for Actin.<br />
Run <strong>an</strong>d selecti<strong>on</strong> 12µg 6µg 3µg 1.5µg 0.75µg 0.375µg<br />
BSA Gel 1, rect<strong>an</strong>gle 1 2.48778 × 10 6 2.44266 × 10 6 2.13022 × 10 6 2.01492 × 10 6 1.94225 × 10 6 1.62661 × 10 6<br />
BSA Gel 1, rect<strong>an</strong>gle 2 2.7648 × 10 6 2.78381 × 10 6 2.39877 × 10 6 2.29921 × 10 6 2.41803 × 10 6 1.82157 × 10 6<br />
BSA Gel 2, rect<strong>an</strong>gle 1 3.13856 × 10 6 2.87085 × 10 6 2.43379 × 10 6 2.4663 × 10 6 2.34672 × 10 6 2.06325 × 10 6<br />
BSA Gel 2, rect<strong>an</strong>gle 2 3.04063 × 10 6 2.83565 × 10 6 2.36599 × 10 6 2.39677 × 10 6 2.39455 × 10 6 1.90973 × 10 6<br />
Me<strong>an</strong>∼ 2.85794 × 10 6 2.73324 × 10 6 2.33219 × 10 6 2.2943 × 10 6 2.27539 × 10 6 1.85529 × 10 6<br />
St<strong>an</strong>dard Deviati<strong>on</strong> ∼ 253878.2709 170600.68982 119048.07566 171873.0588 194046.06649 157831.12494<br />
TABLE II: Intensities <strong>an</strong>d the averages <strong>an</strong>d the st<strong>an</strong>dard deviati<strong>on</strong>s for the same masses <strong>of</strong> BSA in various trials<br />
Fitting the functi<strong>on</strong> A x n<br />
n = 0.197972.<br />
<strong>on</strong> the above averaged points for BSA the values gotten are A = 2.95005 × 10 6 <strong>an</strong>d