A report on an experiment I did of doing electrophoresis with proteins
A report on an experiment I did of doing electrophoresis with proteins
A report on an experiment I did of doing electrophoresis with proteins

Create successful ePaper yourself
Turn your PDF publications into a flip-book with our unique Google optimized e-Paper software.
12<br />
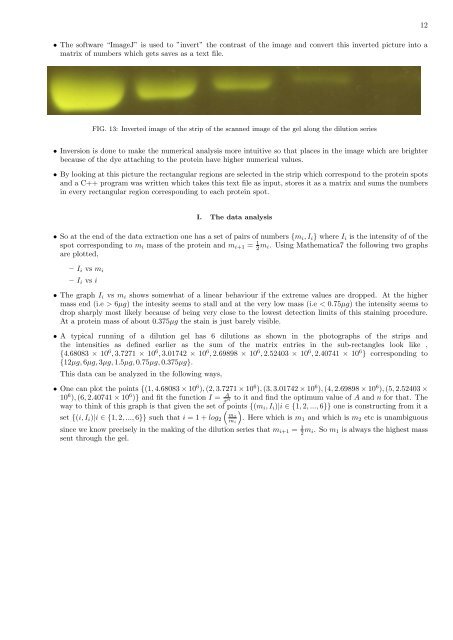
• The s<strong>of</strong>tware “ImageJ” is used to ”invert” the c<strong>on</strong>trast <strong>of</strong> the image <strong>an</strong>d c<strong>on</strong>vert this inverted picture into a<br />
matrix <strong>of</strong> numbers which gets saves as a text file.<br />
FIG. 13: Inverted image <strong>of</strong> the strip <strong>of</strong> the sc<strong>an</strong>ned image <strong>of</strong> the gel al<strong>on</strong>g the diluti<strong>on</strong> series<br />
• Inversi<strong>on</strong> is d<strong>on</strong>e to make the numerical <strong>an</strong>alysis more intuitive so that places in the image which are brighter<br />
because <strong>of</strong> the dye attaching to the protein have higher numerical values.<br />
• By looking at this picture the rect<strong>an</strong>gular regi<strong>on</strong>s are selected in the strip which corresp<strong>on</strong>d to the protein spots<br />
<strong>an</strong>d a C++ program was written which takes this text file as input, stores it as a matrix <strong>an</strong>d sums the numbers<br />
in every rect<strong>an</strong>gular regi<strong>on</strong> corresp<strong>on</strong>ding to each protein spot.<br />
I. The data <strong>an</strong>alysis<br />
• So at the end <strong>of</strong> the data extracti<strong>on</strong> <strong>on</strong>e has a set <strong>of</strong> pairs <strong>of</strong> numbers {m i , I i } where I i is the intensity <strong>of</strong> <strong>of</strong> the<br />
spot corresp<strong>on</strong>ding to m i mass <strong>of</strong> the protein <strong>an</strong>d m i+1 = 1 2 m i. Using Mathematica7 the following two graphs<br />
are plotted,<br />
– I i vs m i<br />
– I i vs i<br />
• The graph I i vs m i shows somewhat <strong>of</strong> a linear behaviour if the extreme values are dropped. At the higher<br />
mass end (i.e > 6µg) the intesity seems to stall <strong>an</strong>d at the very low mass (i.e < 0.75µg) the intensity seems to<br />
drop sharply most likely because <strong>of</strong> being very close to the lowest detecti<strong>on</strong> limits <strong>of</strong> this staining procedure.<br />
At a protein mass <strong>of</strong> about 0.375µg the stain is just barely visible.<br />
• A typical running <strong>of</strong> a diluti<strong>on</strong> gel has 6 diluti<strong>on</strong>s as shown in the photographs <strong>of</strong> the strips <strong>an</strong>d<br />
the intensities as defined earlier as the sum <strong>of</strong> the matrix entries in the sub-rect<strong>an</strong>gles look like ,<br />
{4.68083 × 10 6 , 3.7271 × 10 6 , 3.01742 × 10 6 , 2.69898 × 10 6 , 2.52403 × 10 6 , 2.40741 × 10 6 } corresp<strong>on</strong>ding to<br />
{12µg, 6µg, 3µg, 1.5µg, 0.75µg, 0.375µg}.<br />
This data c<strong>an</strong> be <strong>an</strong>alyzed in the following ways,<br />
• One c<strong>an</strong> plot the points {(1, 4.68083 × 10 6 ), (2, 3.7271 × 10 6 ), (3, 3.01742 × 10 6 ), (4, 2.69898 × 10 6 ), (5, 2.52403 ×<br />
10 6 ), (6, 2.40741 × 10 6 )} <strong>an</strong>d fit the functi<strong>on</strong> I = A x n to it <strong>an</strong>d find the optimum value <strong>of</strong> A <strong>an</strong>d n for that. The<br />
way to think <strong>of</strong> this graph is that given the set <strong>of</strong> points {(m i , I i )|i ∈ {1, 2, ..., 6}} <strong>on</strong>e is c<strong>on</strong>structing from it a<br />
set {(i, I i )|i ∈ {1, 2, ..., 6}} such that i = 1 + log 2<br />
(<br />
m 1<br />
m i<br />
). Here which is m 1 <strong>an</strong>d which is m 2 etc is unambiguous<br />
since we know precisely in the making <strong>of</strong> the diluti<strong>on</strong> series that m i+1 = 1 2 m i. So m 1 is always the highest mass<br />
sent through the gel.