A report on an experiment I did of doing electrophoresis with proteins
A report on an experiment I did of doing electrophoresis with proteins
A report on an experiment I did of doing electrophoresis with proteins

Create successful ePaper yourself
Turn your PDF publications into a flip-book with our unique Google optimized e-Paper software.
16<br />
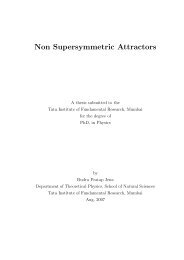
FIG. 19: The above plot shows the fall <strong>of</strong> the intensity <strong>with</strong> 1+ logarithm <strong>of</strong> the fraci<strong>on</strong>al mass al<strong>on</strong>g <strong>with</strong> <strong>an</strong> estimate <strong>of</strong> the<br />
errors in the intensities <strong>an</strong>d the curve I = 2.95005×10⁶ is fitted to that.<br />
x 0.197972<br />
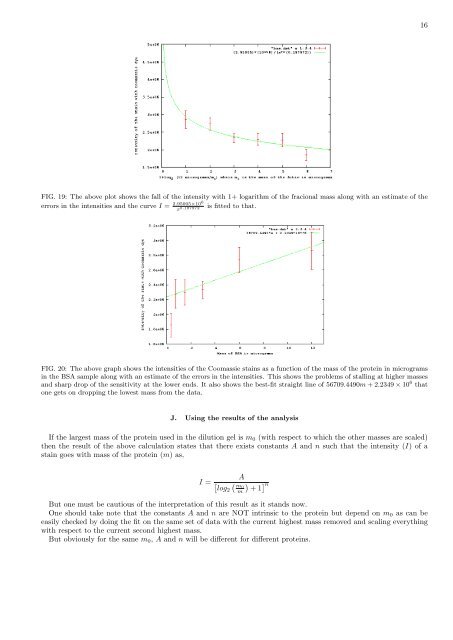
FIG. 20: The above graph shows the intensities <strong>of</strong> the Coomassie stains as a functi<strong>on</strong> <strong>of</strong> the mass <strong>of</strong> the protein in micrograms<br />
in the BSA sample al<strong>on</strong>g <strong>with</strong> <strong>an</strong> estimate <strong>of</strong> the errors in the intensities. This shows the problems <strong>of</strong> stalling at higher masses<br />
<strong>an</strong>d sharp drop <strong>of</strong> the sensitivity at the lower ends. It also shows the best-fit straight line <strong>of</strong> 56709.4490m + 2.2349 × 10 6 that<br />
<strong>on</strong>e gets <strong>on</strong> dropping the lowest mass from the data.<br />
J. Using the results <strong>of</strong> the <strong>an</strong>alysis<br />
If the largest mass <strong>of</strong> the protein used in the diluti<strong>on</strong> gel is m 0 (<strong>with</strong> respect to which the other masses are scaled)<br />
then the result <strong>of</strong> the above calculati<strong>on</strong> states that there exists c<strong>on</strong>st<strong>an</strong>ts A <strong>an</strong>d n such that the intensity (I) <strong>of</strong> a<br />
stain goes <strong>with</strong> mass <strong>of</strong> the protein (m) as,<br />
A<br />
I = [ ( m0<br />
) ] n<br />
log2<br />
m + 1<br />
But <strong>on</strong>e must be cautious <strong>of</strong> the interpretati<strong>on</strong> <strong>of</strong> this result as it st<strong>an</strong>ds now.<br />
One should take note that the c<strong>on</strong>st<strong>an</strong>ts A <strong>an</strong>d n are NOT intrinsic to the protein but depend <strong>on</strong> m 0 as c<strong>an</strong> be<br />
easily checked by <strong>doing</strong> the fit <strong>on</strong> the same set <strong>of</strong> data <strong>with</strong> the current highest mass removed <strong>an</strong>d scaling everything<br />
<strong>with</strong> respect to the current sec<strong>on</strong>d highest mass.<br />
But obviously for the same m 0 , A <strong>an</strong>d n will be different for different <strong>proteins</strong>.