Hydraulic Design of Activated sludge Tanks with CFD - Tauw
Hydraulic Design of Activated sludge Tanks with CFD - Tauw
Hydraulic Design of Activated sludge Tanks with CFD - Tauw

Create successful ePaper yourself
Turn your PDF publications into a flip-book with our unique Google optimized e-Paper software.
<strong>Hydraulic</strong> <strong>Design</strong> <strong>of</strong> <strong>Activated</strong> <strong>sludge</strong> <strong>Tanks</strong> <strong>with</strong> <strong>CFD</strong><br />
A.J. Bosma* and B.A. Reitsma 1<br />
1 <strong>Tauw</strong> bv, Deventer, The Netherlands<br />
*Corresponding author: P.O.box 113, 7400 AC Deventer, The Netherlands, anne.bosma@tauw.nl<br />
Abstract: The hydraulic design <strong>of</strong> wastewater<br />
treatment plants (WWTP) is usually based on<br />
general guidelines and experience. Research and<br />
development in this field is mainly focused on<br />
understanding and improvement <strong>of</strong> the biological<br />
processes. However, hydraulic design is an<br />
important factor in the performance <strong>of</strong> a<br />
wastewater treatment plant. The aeration tank is<br />
a process-step where hydraulic and biological<br />
behaviour are both important for overall<br />
performance.<br />
In this article we present modelling <strong>of</strong> the<br />
activated <strong>sludge</strong> tanks <strong>of</strong> the wastewater<br />
treatment plants in Amsterdam-West and<br />
Eindhoven. For both locations a number <strong>of</strong><br />
operational scenarios are evaluated using<br />
Computational Fluid Dynamics (<strong>CFD</strong>). These<br />
calculations provide useful information for the<br />
assessment <strong>of</strong> risks on short-circuit flows and<br />
sedimentation. The <strong>CFD</strong> results are compared<br />
<strong>with</strong> measurements and show good agreement.<br />
The gained insight in the hydraulic design<br />
improves the operation <strong>of</strong> the wastewater<br />
treatment plants and reduces energy and<br />
maintenance costs.<br />
Keywords: <strong>CFD</strong>, two-phase flow,<br />
measurements, wastewater treatment<br />
1. Introduction<br />
The wastewater treatment plants <strong>of</strong><br />
Amsterdam-West and Eindhoven are<br />
respectively the second and third largest in the<br />
Netherlands. Recently both sites have been<br />
expanded and redesigned to meet the stringent<br />
nitrogen and phosphate effluent regulations. A<br />
key item in the process <strong>of</strong> cleaning wastewater is<br />
the <strong>Activated</strong> <strong>sludge</strong> Tank (AT), where bacteria<br />
feed upon organic matter. The AT’s are<br />
subdivided in three or four reactors which the<br />
waste water will pass through: Anaerobic<br />
(oxygen depleted), Denitrification (oxygen lean),<br />
Facultative (nitrification <strong>of</strong> denitrification), and<br />
Nitrification or Aerated (oxygen rich) reactors.<br />
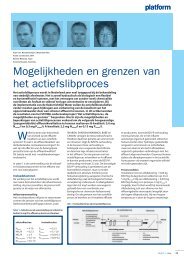
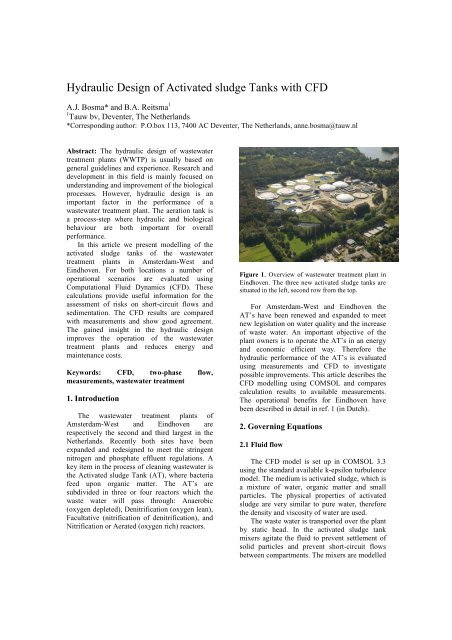
Figure 1. Overview <strong>of</strong> wastewater treatment plant in<br />
Eindhoven. The three new activated <strong>sludge</strong> tanks are<br />
situated in the left, second row from the top.<br />
For Amsterdam-West and Eindhoven the<br />
AT’s have been renewed and expanded to meet<br />
new legislation on water quality and the increase<br />
<strong>of</strong> waste water. An important objective <strong>of</strong> the<br />
plant owners is to operate the AT’s in an energy<br />
and economic efficient way. Therefore the<br />
hydraulic performance <strong>of</strong> the AT’s is evaluated<br />
using measurements and <strong>CFD</strong> to investigate<br />
possible improvements. This article describes the<br />
<strong>CFD</strong> modelling using COMSOL and compares<br />
calculation results to available measurements.<br />
The operational benefits for Eindhoven have<br />
been described in detail in ref. 1 (in Dutch).<br />
2. Governing Equations<br />
2.1 Fluid flow<br />
The <strong>CFD</strong> model is set up in COMSOL 3.3<br />
using the standard available k-epsilon turbulence<br />
model. The medium is activated <strong>sludge</strong>, which is<br />
a mixture <strong>of</strong> water, organic matter and small<br />
particles. The physical properties <strong>of</strong> activated<br />
<strong>sludge</strong> are very similar to pure water, therefore<br />
the density and viscosity <strong>of</strong> water are used.<br />
The waste water is transported over the plant<br />
by static head. In the activated <strong>sludge</strong> tank<br />
mixers agitate the fluid to prevent settlement <strong>of</strong><br />
solid particles and prevent short-circuit flows<br />
between compartments. The mixers are modelled
y a local volumetric force in the direction <strong>of</strong> the<br />
mixer. The volume corresponds to mixer size<br />
and the total volumetric force is obtained from<br />
manufacturer specifications.<br />
Recirculation pumps are used to control the<br />
biological processes in summer or winter and<br />
under various influent conditions, such as heavy<br />
rain or dry periods. The recirculation pumps are<br />
situated in the tank walls. They are modelled<br />
<strong>with</strong> boundary conditions, <strong>with</strong> a specified<br />
inflow or outflow velocity.<br />
2.2 Mixing <strong>with</strong> air bubbles<br />
In the aerated sections <strong>of</strong> the <strong>Activated</strong><br />
<strong>sludge</strong> Tank an oxygen rich environment is<br />
created to produce nitrate from ammonia, to<br />
reduce phosphates and organics. Pressurised air<br />
is released at the floor <strong>of</strong> the AT by dome or<br />
plate membrane systems. The movement <strong>of</strong> air<br />
bubbles is modelled <strong>with</strong> a general convection<br />
and diffusion equation. In this equation the<br />
diffusion <strong>of</strong> air bubbles in the fluid is specified<br />
as the total kinetic viscosity <strong>of</strong> the fluid divided<br />
by the Schmidt number, the latter is taken as a<br />
constant value: 0.7.<br />
The convection in the horizontal plane is<br />
obtained from the k-epsilon model. In the<br />
vertical direction the air velocity is given by the<br />
k-epsilon fluid velocity added <strong>with</strong> a constant,<br />
the standard rising bubble velocity V b0 . The<br />
bubble rise velocity V b0 is calculated according<br />
to Van Baten (ref. 3):<br />
V<br />
( ρ<br />
L<br />
− ρG<br />
) g<br />
g<br />
4( C / d ) ρ 3/ 4( C / d )<br />
b<br />
=<br />
3/<br />
≅<br />
0 D B L<br />
where ρ is density, C D the drag coefficient, and<br />
d B the average bubble diameter. Using a drag<br />
coefficient <strong>of</strong> deformed bubbles and average<br />
bubble diameter <strong>of</strong> 5 mm, V B0 is 0.20 m/s.<br />
Fluid and air interaction is modelled <strong>with</strong><br />
upward volumetric force generated by rising<br />
bubbles and bubble induced turbulence viscosity.<br />
Density variations, bubble break-up and<br />
coalescence have been neglected. The upward<br />
volumetric force is based on momentum<br />
exchange M D,L between fluid and air, described<br />
by Deen and Van Baten (ref 2,3).<br />
M<br />
D,<br />
L<br />
3 C<br />
= − VG<br />
ρ<br />
4 d<br />
D<br />
B<br />
u<br />
G<br />
− u<br />
L<br />
D<br />
( u − u )<br />
where V G is the volume <strong>of</strong> the gas phase, and u<br />
velocity vectors <strong>of</strong> the Liquid or the Gas phase.<br />
G<br />
L<br />
B<br />
The effect <strong>of</strong> bubble induced turbulence<br />
viscosity has been described by Deen (ref. 2),<br />
amongst others. The bubble induced turbulence<br />
viscosity was added to the model, but shows<br />
marginal difference to cases <strong>with</strong>out this<br />
increased viscosity. Probably the cause is the<br />
present numerical diffusion. With finer grids<br />
bubble induced turbulence viscosity can become<br />
more important.<br />
2. Boundary conditions<br />
2.1 Fluid flow<br />
The AT is constructed out <strong>of</strong> concrete walls<br />
and has free surface flow on top. The boundary<br />
conditions <strong>of</strong> the concrete walls are modelled<br />
<strong>with</strong> logarithmic wall functions. The actual<br />
roughness <strong>of</strong> concrete is in the order <strong>of</strong> 1 mm. In<br />
some areas a higher roughness is specified<br />
because <strong>of</strong> installed aeration systems and tubing.<br />
Therefore the standard wall functions are<br />
adjusted to meet specific circumstances,<br />
according to COMSOL helpdesk suggestions.<br />
Fluid surface is modelled <strong>with</strong> slip/symmetry<br />
boundary. Inflow is specified as velocity vectors.<br />
Turbulence conditions are calculated as indicated<br />
by COMSOL manual, <strong>with</strong> 5% turbulent<br />
intensity. Constant pressure is specified at the<br />
outlet opening.<br />
2.2 Air-phase<br />
The boundary conditions for the air-phase are<br />
specified as follows. The air supply from the<br />
dish or membrane systems on the tank floor is<br />
specified <strong>with</strong> a constant air flux. The wall<br />
boundaries are modelled <strong>with</strong> perfect isolation.<br />
Free convection conditions are used for the<br />
outflow and fluid surface. At the fluid inflow the<br />
concentration <strong>of</strong> air is zero.<br />
3. Numerical Model<br />
In order to decrease the model size, the<br />
compartments <strong>of</strong> the AT are analysed<br />
independently. The mesh is built carefully to<br />
avoid sharp corners on the joints <strong>of</strong> the<br />
cylindrical walls. The number <strong>of</strong> elements is<br />
around 33k.<br />
The k-epsilon model uses anisotropic<br />
diffusion for the Navier-Stokes equations to<br />
stabilize the solution. The turbulence equations<br />
are stabilized using isotropic and anisotropic<br />
diffusion.
The PARDISO solver was used for the<br />
solution process, which led to typical solution<br />
times <strong>of</strong> 3-4 hours. The computer system used is<br />
Linux SUSE 64bit server <strong>with</strong> two 2.8MHz dual<br />
core AMD 64 processors and 6 Gb memory.<br />
4. Case 1 Oxidation ring Eindhoven<br />
4.1 Situation<br />
4.2 Objectives<br />
The objectives <strong>of</strong> <strong>CFD</strong> analysis <strong>of</strong> the<br />
Eindhoven AT are to investigate risks <strong>of</strong> short<br />
circuit flow, energy savings and to support<br />
process control decisions regarding the number<br />
<strong>of</strong> mixers in operation. Process control wants to<br />
maintain correct fluid velocities in the tank to<br />
control biological processes and prevent settling.<br />
For this purpose 24 cases have been<br />
evaluated. To validate the calculation results two<br />
cases are compared to velocity measurements.<br />
4.3 Validation <strong>with</strong> measurements<br />
Figure 2. Overview <strong>of</strong> the geometry model <strong>of</strong> the AT<br />
Eindhoven.<br />
Figure 2 shows the geometrical model <strong>of</strong> the<br />
AT Eindhoven. The oxidation reactor is the outer<br />
ring <strong>of</strong> the three sections. Mixed Liquor<br />
Suspended Solids (MLSS) enters the outer<br />
reactor through overflow sections in the dividing<br />
wall. Three recirculation pumps transfer a<br />
fraction <strong>of</strong> the MLSS back towards the<br />
Denitrification reactor (Middle ring). Six mixers<br />
can be used to prevent settlement <strong>of</strong> solids. The<br />
MLSS leaves the AT through small openings on<br />
the tank floor and flows to the secondary<br />
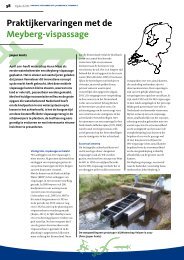
sedimentation tanks. Figure 3 provides a view on<br />
the oxidation ring during construction.<br />
Velocity measurements were performed for<br />
the Site Acceptance Test <strong>of</strong> the mixers. The<br />
measurements are performed by Aqua Vision<br />
The Netherlands, using Acoustic Doppler<br />
Current Pr<strong>of</strong>iler (ACDP) (ref 4.). On two<br />
accessible locations the 2D velocity pr<strong>of</strong>iles have<br />
been generated. The results <strong>of</strong> the measurements<br />
are compared to the simulations. Figure 4 shows<br />
a velocity pr<strong>of</strong>ile generated by ACDP (top) and<br />
shows corresponding calculation result (bottom).<br />
Figure 3. View on the oxidation reactor <strong>of</strong> the AT<br />
in Eindhoven during construction. In the left wall<br />
three recirculation pumps are visible, the centre shows<br />
two mixers in front <strong>of</strong> aeration panels on the floor.<br />
The right side shows the outlets towards the secondary<br />
sedimentation tanks.<br />
Figure 4. Comparison <strong>of</strong> velocity field cross-section.<br />
Top figure is a measurement result and bottom figure<br />
is calculation results at the corresponding location and<br />
process-conditions.
Parameter Validation 1 Validation 2<br />
Influent (m 3 /h) 2,361 8,750<br />
Sludge recirculation (m 3 /h) 1,452 3,784<br />
Reflux factor OX-DEN 8 * Influent 8 * Influent<br />
Airflow (Nm 3 /h) 6,070 9,326<br />
Air panels winter section Off Off<br />
Mixers in operation (DEN) 2 2<br />
Mixers in operation (OX) 6 6<br />
Average velocity measured<br />
pr<strong>of</strong>ile (m/s)<br />
Calculated velocity location<br />
measurements (m/s)<br />
Calculated average velocity<br />
oxidation reactor (m/s)<br />
0.308 0.267<br />
0.35 0.27<br />
0.36 0.28<br />
The measurements and simulations agree<br />
relatively well. The error for validation 1 is 12%<br />
for validation 2 it is 2%. Error sources are found<br />
in establishing exact values <strong>of</strong> process conditions<br />
during measurements, since measurements have<br />
been performed at a full scale plant in operation.<br />
Other error sources are the simplified geometry<br />
and rather coarse mesh which had to be used to<br />
keep manageable model-sizes.<br />
Figure 5. Velocity pr<strong>of</strong>ile Case A in horizontal plane<br />
at 2.5 m from tank floor<br />
For Case B, <strong>with</strong> maximum reflux flows, the<br />
average velocity in the oxidation reactor drops to<br />
0.21 m/s. This indicates the velocity is below the<br />
threshold and there is risk <strong>of</strong> settling <strong>of</strong> <strong>sludge</strong><br />
particles. In these circumstances four mixers are<br />
not sufficient for safe operation.<br />
4.4 Results<br />
The effects <strong>of</strong> several process parameters on<br />
the average velocity in the oxidation reactor have<br />
been studied. Among the parameters are:<br />
Capacity <strong>of</strong> the recirculation pumps between<br />
oxidation and denitrification reactor, Influent<br />
discharge, number <strong>of</strong> mixers in operation, and air<br />
supply. The effect <strong>of</strong> all parameters is described<br />
in detail in (ref. 1). In this article we give an<br />
example <strong>of</strong> the improved understanding <strong>of</strong> the<br />
AT by comparing two cases A and B.<br />
In both cases four out <strong>of</strong> the six mixers are in<br />
operation, in dry weather conditions for influent<br />
and <strong>with</strong> maximum aeration. For case A the<br />
recirculation pumps between the oxidation<br />
reactor and denitrification reactor operate at 50%<br />
<strong>of</strong> their maximum discharge. In case B the<br />
capacity is increased up to 100%. These flows<br />
have considerable effect on average velocity in<br />
the reactor because they amount 4 to 8 times the<br />
influent flow.<br />
For Case A the average velocity in the<br />
oxidation ring is 0.25 m/s. A general safe<br />
threshold for settling is 0.25 m/s, which means<br />
the velocity in case A is just sufficient.<br />
Figure 6. Velocity pr<strong>of</strong>ile Case B in horizontal plane<br />
at 2.5 m from tank floor.<br />
Figure 7. Streamline plot <strong>of</strong> case B to demonstrate<br />
recirculation at start and finish <strong>of</strong> air panels.<br />
Aeration panels are positioned on the tank<br />
floor (‘south-east’ section in Figure 7). The<br />
aeration section causes spiral flow in front and<br />
behind the aeration section. With all mixers in<br />
operation most <strong>of</strong> the spiral flow disappears.
4.5 Conclusion<br />
<strong>CFD</strong> analysis makes it possible to evaluate<br />
the effect <strong>of</strong> changing process conditions <strong>with</strong>out<br />
the need for real world testing. This is useful to<br />
construct process control guidelines, especially<br />
for rare events. At the same time every day<br />
operation benefits by reduction <strong>of</strong> risks on<br />
shortcircuit flow and reduction <strong>of</strong> excessive<br />
mixing power, which saves energy and<br />
maintenance costs.<br />
5. Case 2 Facultative (FCT) reactor<br />
Amsterdam-West<br />
5.1 Situation<br />
The WWTP <strong>of</strong> Amsterdam-West is currently<br />
the second largest <strong>of</strong> The Netherlands and is in<br />
full operation since nov 2005. The plant has<br />
seven AT’s (Figure 8), <strong>with</strong> three <strong>of</strong> them<br />
mirrored to the other four. The current work<br />
focuses on the hydraulics <strong>of</strong> the Facultative Tank<br />
(FCT). The FCT can be operated as nitrification<br />
tank (oxygen rich) or as denitrification tank<br />
(oxygen lean). Therefore the FCT provides<br />
flexibility to the plant operators to deal <strong>with</strong><br />
fluctuations summer and winter and the waste<br />
water flows.<br />
P440 L<br />
P430 H<br />
5.2 Objectives<br />
The FCT has four mixers to maintain correct<br />
rotation direction <strong>of</strong> the activated <strong>sludge</strong> and<br />
prevent settlement <strong>of</strong> <strong>sludge</strong> particles. Settlement<br />
<strong>of</strong> <strong>sludge</strong> particles occurs when average velocity<br />
drops below 0.25 m/s. Without aeration<br />
velocities up to 0.50 m/s are recorded. <strong>CFD</strong> is<br />
used to indicate possible energy savings and to<br />
asses the risk on short-circuit flows.<br />
5.3 Validation <strong>with</strong> measurements<br />
The Site Approval Test <strong>of</strong> the mixers was<br />
performed by the manufacturer, ITT Flygt. The<br />
velocity measurements were performed using<br />
calibrated rotors. The rotors were positioned<br />
pair-wise in opposite directions in order to record<br />
any spiral flow. The average velocity is<br />
calculated by counting the revolutions <strong>of</strong> the<br />
rotors over one minute. Due to aerated sections<br />
and the AT lay-out it was possible to measure at<br />
one specific location, indicated <strong>with</strong> a red dot in<br />
Figure 8.<br />
Parameter Validation 1 Validation 2<br />
Influent (m 3 /h) 1,314 2,500<br />
Reflux factor NIT-FCT 3.42 *Influent 0 * Influent<br />
Airflow (Nm 3 /h) 0 2,800<br />
Mixers in operation (FCT) 4 2<br />
P220 L<br />
P340 H<br />
P330 L<br />
Average velocity measured<br />
pr<strong>of</strong>ile (m/s)<br />
0.51 0.29<br />
Calculated velocity location<br />
0.50 0.21<br />
measurements (m/s)<br />
Calculated average velocity<br />
0.50 0.31<br />
NIT FCT<br />
DNT<br />
ANT<br />
oxidation reactor (m/s)<br />
C<br />
P320 L<br />
P310 H<br />
P420 H<br />
P410 L<br />
B<br />
A<br />
P210 L<br />
Figure 8. Overview <strong>of</strong> one AT <strong>of</strong> the WWTP<br />
Amsterdam-West. Subject <strong>of</strong> investigation is the FCT<br />
or Facultative Tank.<br />
The FCT is a relatively narrow reactor and has<br />
four mixers. The aeration is performed <strong>with</strong><br />
racks <strong>of</strong> membrane dishes on the tank floor.<br />
Measurements and <strong>CFD</strong> analysis agree well<br />
in case there is no aeration (Validation 1). With<br />
aeration active (Validation 2) the measurement<br />
results agree less to the calculation results.<br />
The calculation results indicate heavy<br />
recirculation behind the aerated section.<br />
However in measurements the flow is stagnant at<br />
the lower section, not backwards. At this point<br />
the origin <strong>of</strong> this discrepancy is unknown. For<br />
further analysis the volume averaged values <strong>of</strong><br />
the FCT are considered.
5.4 Results<br />
For Amsterdam-West eight cases have been<br />
analysed. Figure 9 shows calculation results <strong>of</strong><br />
validation 2 as an example <strong>of</strong> the effect <strong>of</strong><br />
aeration on the MLSS flow. At the front and<br />
behind the two aeration sections spiral flow is<br />
noticed.<br />
Figure 10. Example <strong>of</strong> short circuit flow in the FCT<br />
reactor, caused by spiral flow <strong>of</strong> the aeration section.<br />
Figure 10 shows that part <strong>of</strong> the entering<br />
fluid passes straight through to the exit. This is<br />
caused by the short distance between the aeration<br />
section and the inlet/outlet. The spiral flow after<br />
the aerated section creates the possibility for<br />
short-circuit-flows. Results <strong>of</strong> other cases show<br />
that this effect is diminished when more mixers<br />
are switched on.<br />
In the measurements the spiral flow at the<br />
opposite side <strong>of</strong> the FCT is less pronounced than<br />
the calculations indicate. Reduction <strong>of</strong> the<br />
number <strong>of</strong> mixers in operation should be checked<br />
<strong>with</strong> the operational efficiency <strong>of</strong> the AT. The<br />
<strong>CFD</strong> analysis provides valuable indications for<br />
process optimisation.<br />
Figure 9. Calculation results <strong>of</strong> validation 2. Velocity<br />
distribution (top figure) and streamlines (bottom<br />
figure).<br />
In Validation 2 the flow pattern is very<br />
turbulent (Figure 9). This is caused by the<br />
narrow geometry <strong>of</strong> the FCT and the short<br />
distances between mixers, recirculation pumps,<br />
aerations sections and inlet/outlet flows. Because<br />
<strong>of</strong> the large variations in velocity distribution<br />
much attention was given to construct a mesh<br />
and anisotropic diffusion was used to stabilise<br />
the solution process.<br />
Evaluation <strong>of</strong> eight cases leads to the<br />
following suggestions for operation <strong>of</strong> the FCT.<br />
Without aeration it is safe to operate the FCT<br />
<strong>with</strong> two out <strong>of</strong> four mixers in operation<br />
regarding the average velocity. With aeration it<br />
is still possible to operate FCT <strong>with</strong> two mixers,<br />
however risks on short-circuit flows between the<br />
inlet and outlet are substantial.<br />
5.5 Conclusion FCT Amsterdam-West<br />
Calculations and measurements show that<br />
two out <strong>of</strong> four mixers are sufficient to prevent<br />
<strong>sludge</strong> settling. However in case <strong>of</strong> aeration there<br />
is a risk on short-circuit flows <strong>with</strong> two mixers.<br />
In practice process conditions have to be<br />
monitored when aeration is present. When bypassing<br />
<strong>of</strong> the FCT is detected, extra mixers can<br />
be switched on to solve the problem.<br />
6. Conclusions<br />
<strong>CFD</strong> analysis <strong>with</strong> COMSOL is used to<br />
optimise operation <strong>of</strong> the <strong>Activated</strong> Sludge<br />
<strong>Tanks</strong> <strong>of</strong> the WWTP <strong>of</strong> Eindhoven and<br />
Amsterdam-West. This leads to the following<br />
conclusions.<br />
The modelling <strong>of</strong> aeration is possible <strong>with</strong><br />
COMSOL using a diffusion and convection<br />
equation for the gas-phase. Calculation results<br />
and measurements agree relatively well.
<strong>CFD</strong> makes it possible to evaluate the effect<br />
<strong>of</strong> process conditions <strong>with</strong>out the need for<br />
expensive and time consuming measurements.<br />
This is useful to deduct process control<br />
guidelines, especially for rare events. At the<br />
same time every day operation benefits by<br />
reduction <strong>of</strong> excessive mixing power, saving<br />
energy and maintenance costs.<br />
The current investigation evaluates the<br />
performance <strong>of</strong> existing <strong>Activated</strong> <strong>sludge</strong> <strong>Tanks</strong>.<br />
Measurements are essential to check the results<br />
<strong>of</strong> <strong>CFD</strong> analysis. With the current experience<br />
<strong>Tauw</strong> is able to incorporate <strong>CFD</strong> in the design <strong>of</strong><br />
<strong>Activated</strong> <strong>sludge</strong> <strong>Tanks</strong>. <strong>CFD</strong> will become a<br />
valuable tool in the design <strong>of</strong> these tailor made<br />
and capital intensive constructions.<br />
WWTP Amsterdam-West is owned by:<br />
Waternet, Amsterdam, The Netherlands<br />
www.waternet.nl<br />
Further improvement is expected from<br />
increasing the mesh elements. Possible ways to<br />
achieve this are additional internal memory for<br />
the hardware or solver improvements to deal<br />
<strong>with</strong> larger models more effectively.<br />
7. References<br />
1. Anne Bosma, Marlies Verhoeven et al., Meten<br />
en modelleren van het stromingsgedrag in de<br />
actief slibtanks van de rwzi Eindhoven met <strong>CFD</strong>,<br />
Afvalwaterwetenschap, 2, 115-128 (2007)<br />
2. N.G.Deen, An Experimental and<br />
Computational Study <strong>of</strong> Fluid Dynamics in Gas-<br />
Liquid Chemical Reactors. Ph.D. thesis. 117<br />
pages, Aalborg University, Esbjerg (2001).<br />
3. J.M. van Baten, J. Ellenberger, R. Krishna,<br />
Hydrodynamics <strong>of</strong> internal air-lift reactors:<br />
experiments versus <strong>CFD</strong> simulations, Chemical<br />
Engineering and Processing, 42, 733-742<br />
(2003)<br />
4. J.W.Mol, Verwerking van snelheidsmetingen<br />
RWZI Eindhoven, Aqua Vision B.V., Utrecht<br />
(2006)<br />
9. Acknowledgements<br />
The positive support <strong>of</strong> the waste water treatment<br />
plant owners and operators proved essential for<br />
this work and is greatly appreciated.<br />
WWTP Eindhoven is owned by: Waterboard De<br />
Dommel, Boxtel, The Netherlands<br />
www.dedommel.nl