Chapter 6: Impedance measurements
Chapter 6: Impedance measurements
Chapter 6: Impedance measurements

You also want an ePaper? Increase the reach of your titles
YUMPU automatically turns print PDFs into web optimized ePapers that Google loves.
Acoustic impedance <strong>measurements</strong><br />
Surface impedance technique, influence of vertical obstacles<br />
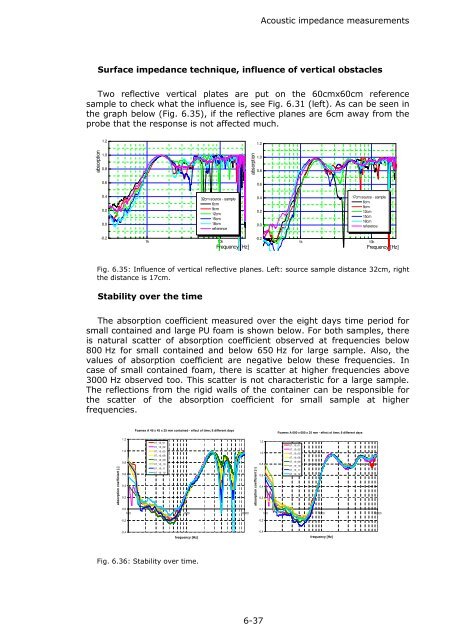
Two reflective vertical plates are put on the 60cmx60cm reference<br />
sample to check what the influence is, see Fig. 6.31 (left). As can be seen in<br />
the graph below (Fig. 6.35), if the reflective planes are 6cm away from the<br />
probe that the response is not affected much.<br />
1.2<br />
1.2<br />
absorption<br />
1.0<br />
0.8<br />
absorption<br />
1.0<br />
0.8<br />
0.6<br />
0.6<br />
0.4<br />
0.2<br />
0.0<br />
32cm source - sample<br />
6cm<br />
9cm<br />
12cm<br />
15cm<br />
18cm<br />
reference<br />
0.4<br />
0.2<br />
0.0<br />
17cm source - sample<br />
6cm<br />
9cm<br />
12cm<br />
15cm<br />
18cm<br />
reference<br />
-0.2<br />
1k<br />
10k<br />
Frequency [Hz]<br />
-0.2<br />
1k<br />
10k<br />
Frequency [Hz]<br />
Fig. 6.35: Influence of vertical reflective planes. Left: source sample distance 32cm, right<br />
the distance is 17cm.<br />
Stability over the time<br />
The absorption coefficient measured over the eight days time period for<br />
small contained and large PU foam is shown below. For both samples, there<br />
is natural scatter of absorption coefficient observed at frequencies below<br />
800 Hz for small contained and below 650 Hz for large sample. Also, the<br />
values of absorption coefficient are negative below these frequencies. In<br />
case of small contained foam, there is scatter at higher frequencies above<br />
3000 Hz observed too. This scatter is not characteristic for a large sample.<br />
The reflections from the rigid walls of the container can be responsible for<br />
the scatter of the absorption coefficient for small sample at higher<br />
frequencies.<br />
Foamex A 45 x 45 x 25 mm contained - effect of time; 8 different days<br />
Foamex A 600 x 600 x 25 mm - effect of time; 8 different days<br />
absorption coefficient [-]<br />
1,2<br />
1,0<br />
0,8<br />
0,6<br />
0,4<br />
0,2<br />
07_10_01<br />
07_10_02<br />
07_10_05<br />
07_10_08<br />
07_10_09<br />
07_10_10<br />
07_10_11<br />
07_10_12<br />
absorption coefficient [-]<br />
1,2<br />
1,0<br />
0,8<br />
0,6<br />
0,4<br />
0,2<br />
07_10_01<br />
07_10_02<br />
07_10_05<br />
07_10_08<br />
07_10_09<br />
07_10_10<br />
07_10_11<br />
07_10_12<br />
0,0<br />
-0,2<br />
100 1000 10000<br />
0,0<br />
-0,2<br />
100 1000 10000<br />
-0,4<br />
frequency [Hz]<br />
-0,4<br />
frequency [Hz]<br />
Fig. 6.36: Stability over time.<br />
6-37