Chapter 6: Impedance measurements
Chapter 6: Impedance measurements
Chapter 6: Impedance measurements

Create successful ePaper yourself
Turn your PDF publications into a flip-book with our unique Google optimized e-Paper software.
Acoustic impedance <strong>measurements</strong><br />
Output [V]<br />
1<br />
0,1<br />
R=1<br />
0,01<br />
0,001<br />
0,0001<br />
0,00001<br />
R=0<br />
100 1k 10k<br />
Frequency [Hz]<br />
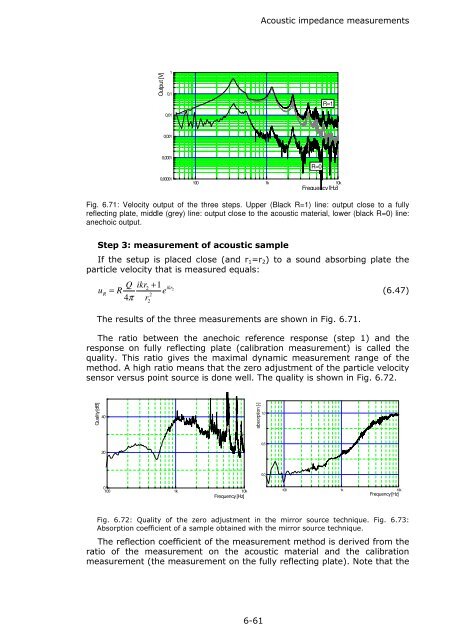
Fig. 6.71: Velocity output of the three steps. Upper (Black R=1) line: output close to a fully<br />
reflecting plate, middle (grey) line: output close to the acoustic material, lower (black R=0) line:<br />
anechoic output.<br />
Step 3: measurement of acoustic sample<br />
If the setup is placed close (and r 1 =r 2 ) to a sound absorbing plate the<br />
particle velocity that is measured equals:<br />
Q ikr + 1<br />
u R e<br />
2 ikr2<br />
R<br />
= (6.47)<br />
2<br />
4π<br />
r2<br />
The results of the three <strong>measurements</strong> are shown in Fig. 6.71.<br />
The ratio between the anechoic reference response (step 1) and the<br />
response on fully reflecting plate (calibration measurement) is called the<br />
quality. This ratio gives the maximal dynamic measurement range of the<br />
method. A high ratio means that the zero adjustment of the particle velocity<br />
sensor versus point source is done well. The quality is shown in Fig. 6.72.<br />
Quality [dB]<br />
40<br />
absorption [-]<br />
1,0<br />
20<br />
0,5<br />
0,0<br />
0<br />
100 1k 10k<br />
Frequency [Hz]<br />
100 1k 10k<br />
Frequency [Hz]<br />
Fig. 6.72: Quality of the zero adjustment in the mirror source technique. Fig. 6.73:<br />
Absorption coefficient of a sample obtained with the mirror source technique.<br />
The reflection coefficient of the measurement method is derived from the<br />
ratio of the measurement on the acoustic material and the calibration<br />
measurement (the measurement on the fully reflecting plate). Note that the<br />
6-61