sowm_2015__int__africa_full_report_low_res
sowm_2015__int__africa_full_report_low_res
sowm_2015__int__africa_full_report_low_res

Create successful ePaper yourself
Turn your PDF publications into a flip-book with our unique Google optimized e-Paper software.
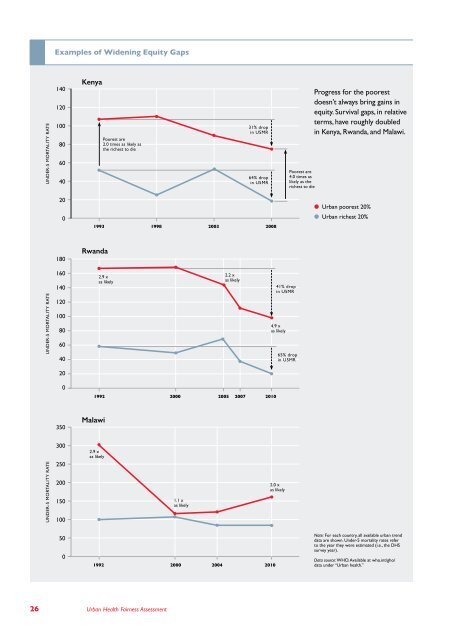
Examples of Widening Equity Gaps<br />
UNDER-5 MORTALITY RATE<br />
140<br />
120<br />
100<br />
80<br />
60<br />
40<br />
Kenya<br />
Poo<strong>res</strong>t are<br />
2.0 times as likely as<br />
the richest to die<br />
31% drop<br />
in U5MR<br />
64% drop<br />
in U5MR<br />
Poo<strong>res</strong>t are<br />
4.0 times as<br />
likely as the<br />
richest to die<br />
Prog<strong>res</strong>s for the poo<strong>res</strong>t<br />
doesn’t always bring gains in<br />
equity. Survival gaps, in relative<br />
terms, have roughly doubled<br />
in Kenya, Rwanda, and Malawi.<br />
20<br />
0<br />
1993 1998 2003 2008<br />
● Urban poo<strong>res</strong>t 20%<br />
● Urban richest 20%<br />
180<br />
Rwanda<br />
UNDER-5 MORTALITY RATE<br />
160<br />
140<br />
120<br />
100<br />
80<br />
60<br />
40<br />
2.9 x<br />
as likely<br />
2.2 x<br />
as likely<br />
41% drop<br />
in U5MR<br />
4.9 x<br />
as likely<br />
65% drop<br />
in U5MR<br />
20<br />
0<br />
1992<br />
2000 2005 2007 2010<br />
350<br />
Malawi<br />
UNDER-5 MORTALITY RATE<br />
300<br />
250<br />
200<br />
150<br />
100<br />
2.9 x<br />
as likely<br />
1.1 x<br />
as likely<br />
2.0 x<br />
as likely<br />
50<br />
0<br />
1992<br />
2000<br />
2004<br />
2010<br />
Note: For each country, all available urban trend<br />
data are shown. Under-5 mortality rates refer<br />
to the year they were estimated (i.e., the DHS<br />
survey year).<br />
Data source: WHO. Available at who.<strong>int</strong>/gho/<br />
data under “Urban health.”<br />
26 Urban Health Fairness Assessment