sowm_2015__int__africa_full_report_low_res
sowm_2015__int__africa_full_report_low_res
sowm_2015__int__africa_full_report_low_res

Create successful ePaper yourself
Turn your PDF publications into a flip-book with our unique Google optimized e-Paper software.
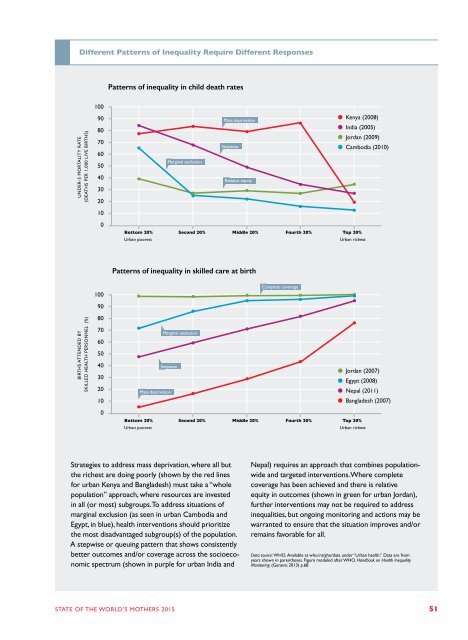
Different Patterns of Inequality Require Different Responses<br />
Patterns of inequality in child death rates<br />
100<br />
UNDER-5 MORTALITY RATE<br />
(DEATHS PER 1,000 LIVE BIRTHS)<br />
90<br />
80<br />
70<br />
60<br />
50<br />
40<br />
30<br />
20<br />
Marginal exclusion<br />
Mass deprivation<br />
Stepwise<br />
Relative equity<br />
● Kenya (2008)<br />
● India (2005)<br />
● Jordan (2009)<br />
● Cambodia (2010)<br />
10<br />
0<br />
Bottom 20% Second 20% Middle 20% Fourth 20% Top 20%<br />
Urban poo<strong>res</strong>t<br />
Urban richest<br />
Patterns of inequality in skilled care at birth<br />
100<br />
Complete coverage<br />
90<br />
BIRTHS ATTENDED BY<br />
SKILLED HEALTH PERSONNEL (%)<br />
80<br />
70<br />
60<br />
50<br />
40<br />
30<br />
20<br />
10<br />
Stepwise<br />
Mass deprivation<br />
Marginal exclusion<br />
● Jordan (2007)<br />
● Egypt (2008)<br />
● Nepal (2011)<br />
● Bangladesh (2007)<br />
0<br />
Bottom 20% Second 20% Middle 20% Fourth 20% Top 20%<br />
Urban poo<strong>res</strong>t<br />
Urban richest<br />
Strategies to add<strong>res</strong>s mass deprivation, where all but<br />
the richest are doing poorly (shown by the red lines<br />
for urban Kenya and Bangladesh) must take a “whole<br />
population” approach, where <strong>res</strong>ources are invested<br />
in all (or most) subgroups. To add<strong>res</strong>s situations of<br />
marginal exclusion (as seen in urban Cambodia and<br />
Egypt, in blue), health <strong>int</strong>erventions should prioritize<br />
the most disadvantaged subgroup(s) of the population.<br />
A stepwise or queuing pattern that shows consistently<br />
better outcomes and/or coverage across the socioeconomic<br />
spectrum (shown in purple for urban India and<br />
Nepal) requi<strong>res</strong> an approach that combines populationwide<br />
and targeted <strong>int</strong>erventions. Where complete<br />
coverage has been achieved and there is relative<br />
equity in outcomes (shown in green for urban Jordan),<br />
further <strong>int</strong>erventions may not be required to add<strong>res</strong>s<br />
inequalities, but ongoing monitoring and actions may be<br />
warranted to ensure that the situation improves and/or<br />
remains favorable for all.<br />
Data source: WHO. Available at who.<strong>int</strong>/gho/data under “Urban health.” Data are from<br />
years shown in parentheses. Figure modeled after WHO. Handbook on Health Inequality<br />
Monitoring. (Geneva: 2013) p.68<br />
STATE OF THE WORLD’S MOTHERS <strong>2015</strong> 51