BALANCE SHEETS AS AT 31 JANUARY <strong>2009</strong> Group Company Note <strong>2009</strong> 2008 <strong>2009</strong> 2008 RM RM RM RM Non-current Assets Property, plant and equipment 15 331,935,185 230,111,106 239,998 239,152 Investment properties 16 4,945,079 - - - Prepaid leasehold rentals 17 14,008,606 11,850,917 - - Intangible assets 18 11,311,065 9,372,427 - - Subsidiaries 19 - - 67,079,030 44,909,029 Associates 20 874,614,717 824,158,560 615,153,100 594,851,458 Unquoted investments 21 1,304,003 247,500 - - Trade receivable 27 5,452,368 5,480,229 - - Deferred tax assets 22 2,682,503 3,238,982 - - 1,246,253,526 1,084,459,721 682,472,128 639,999,639 Current Assets Assets held-for-sale 23 1,250,035 6,872,376 - - Inventories 24 17,946,285 15,673,769 - - Quoted investments 21 3,004,215 61,333 2,942,882 - Amounts owing from subsidiaries 25 - - 63,435,147 97,133,626 Amount owing from an associate 26 35,949 35,542 35,949 35,542 Trade and other receivables 27 73,461,985 93,698,822 100,836 1,102,814 Tax recoverable 2,082,126 2,862,725 111,628 1,219,658 Deposits, cash and bank balances 29 67,748,785 75,281,482 11,491,949 22,949,062 165,529,380 194,486,049 78,118,391 122,440,702 Less: Current Liabilities Liabilities directly associated with assets held-for-sale 23 35,504 - - - Trade and other payables 30 66,861,439 50,737,080 184,156 290,563 Deferred revenue 31 1,321,892 902,376 - - Current tax liabilities 283,118 469,141 - Hire-purchase and finance lease payables 32 1,012,296 1,251,663 - - Interest-bearing bank borrowings 33 194,607,373 184,957,894 - - 264,121,622 238,318,154 184,156 290,563 Net Current (Liabilities)/Assets (98,592,242) (43,832,105) 77,934,235 122,150,139 Less: Non-current Liabilities Deferred tax liabilities 22 118,227 132,312 - - Hire-purchase and finance lease payables 32 319,052 1,264,413 - - Interest-bearing bank borrowings 33 10,799,445 10,040,873 - - 11,236,724 11,437,598 - - Deferred revenue 31 12,596,492 10,245,915 - - 1,123,828,068 1,018,944,103 760,406,363 762,149,778 Capital And Reserves Attributable to Equity Holders Of The Company Share capital 34 323,389,830 323,333,830 323,389,830 323,333,830 Irredeemable Convertible Non-Cumulative Preference Shares 34 3,500,000 - - - Share premium 35 452,695,351 385,717,362 386,147,751 385,717,362 Exchange fluctuation reserve 3,057,622 (586,751) - - Capital reserve - 2,343,241 - - Share options reserve 495,184 1,307,219 495,184 1,197,429 Retained earnings 36 324,225,650 287,377,699 50,373,598 51,901,157 1,107,363,637 999,492,600 760,406,363 762,149,778 Minority interests 16,464,431 19,451,503 - - Total equity 1,123,828,068 1,018,944,103 760,406,363 762,149,778 The accounting policies on pages 42 to 55 and the notes on pages 56 to 102 form an integral part of these financial statements. 36 <strong>Goldis</strong> <strong>Berhad</strong> (515802-U) annual report <strong>2009</strong>
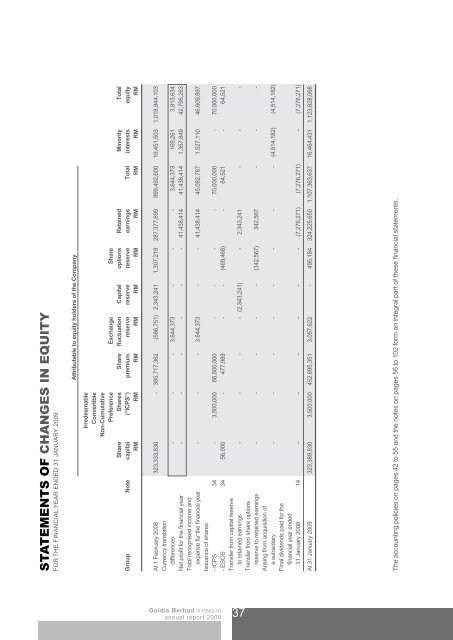
STATEMENTS OF CHANGES IN EQUITY FOR THE FINANCIAL YEAR ENDED 31 JANUARY <strong>2009</strong> Attributable to equity holders of the Company Irredeemable Convertible Non-Cumulative Preference Exchange Share Share Shares Share fluctuation Capital options Retained Minority Total Group Note capital (“ICPS”) premium reserve reserve reserve earnings Total interests equity RM RM RM RM RM RM RM RM RM RM At 1 February 2008 323,333,830 - 385,717,362 (586,751) 2,343,241 1,307,219 287,377,699 999,492,600 19,451,503 1,018,944,103 Currency translation differences - - - 3,644,373 - - - 3,644,373 169,261 3,813,634 Net profit for the financial year - - - - - - 41,438,414 41,438,414 1,357,849 42,796,263 Total recognised income and expense for the financial year - - - 3,644,373 - - 41,438,414 45,082,787 1,527,110 46,609,897 Issuance of shares - ICPS 34 - 3,500,000 66,500,000 - - - - 70,000,000 - 70,000,000 - ESOS 34 56,000 - 477,989 - - (469,468) - 64,521 - 64,521 Transfer from capital reserve to retained earnings - - - - (2,343,241) - 2,343,241 - - - Transfer from share options reserve to retained earnings - - - - - (342,567) 342,567 - - - Arising from acquisition of a subsidiary - - - - - - - - (4,514,182) (4,514,182) Final dividends paid for the financial year ended 31 January 2008 14 - - - - - - (7,276,271) (7,276,271) - (7,276,271) At 31 January <strong>2009</strong> 323,389,830 3,500,000 452,695,351 3,057,622 - 495,184 324,225,650 1,107,363,637 16,464,431 1,123,828,068 The accounting policies on pages 42 to 55 and the notes on pages 56 to 102 form an integral part of these financial statements. <strong>Goldis</strong> <strong>Berhad</strong> (515802-U) annual report <strong>2009</strong> 37