A systematic approach to quality function deployment with a full ...
A systematic approach to quality function deployment with a full ...
A systematic approach to quality function deployment with a full ...

You also want an ePaper? Increase the reach of your titles
YUMPU automatically turns print PDFs into web optimized ePapers that Google loves.
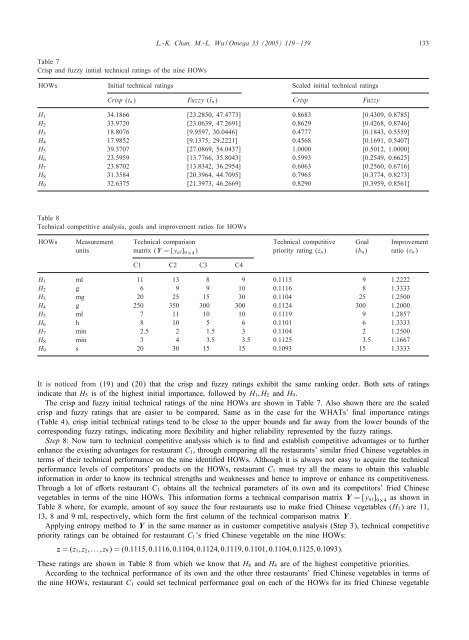
Table 7<br />
Crisp and fuzzy initial technical ratings of the nine HOWs<br />
L.-K. Chan, M.-L. Wu / Omega 33 (2005) 119 – 139 133<br />
HOWs Initial technical ratings Scaled initial technical ratings<br />
Crisp (tn) Fuzzy (˜tn) Crisp Fuzzy<br />
H1 34.1866 [23.2850, 47.4773] 0.8683 [0.4309, 0.8785]<br />
H2 33.9720 [23.0639, 47.2691] 0.8629 [0.4268, 0.8746]<br />
H3 18.8076 [9.9597, 30.0446] 0.4777 [0.1843, 0.5559]<br />
H4 17.9852 [9.1375, 29.2221] 0.4568 [0.1691, 0.5407]<br />
H5 39.3707 [27.0869, 54.0437] 1.0000 [0.5012, 1.0000]<br />
H6 23.5959 [13.7766, 35.8043] 0.5993 [0.2549, 0.6625]<br />
H7 23.8702 [13.8342, 36.2954] 0.6063 [0.2560, 0.6716]<br />
H8 31.3584 [20.3964, 44.7095] 0.7965 [0.3774, 0.8273]<br />
H9 32.6375 [21.3973, 46.2669] 0.8290 [0.3959, 0.8561]<br />
Table 8<br />
Technical competitive analysis, goals and improvement ratios for HOWs<br />
HOWs Measurement Technical comparison Technical competitive Goal Improvement<br />
units matrix (Y =[ynl] 9×4 ) priority rating (zn) (bn) ratio (vn)<br />
C1 C2 C3 C4<br />
H1 ml 11 13 8 9 0.1115 9 1.2222<br />
H2 g 6 9 9 10 0.1116 8 1.3333<br />
H3 mg 20 25 15 30 0.1104 25 1.2500<br />
H4 g 250 350 300 300 0.1124 300 1.2000<br />
H5 ml 7 11 10 10 0.1119 9 1.2857<br />
H6 h 8 10 5 6 0.1101 6 1.3333<br />
H7 min 2.5 2 1.5 3 0.1104 2 1.2500<br />
H8 min 3 4 3.5 3.5 0.1125 3.5 1.1667<br />
H9 s 20 30 15 15 0.1093 15 1.3333<br />
It is noticed from (19) and (20) that the crisp and fuzzy ratings exhibit the same ranking order. Both sets of ratings<br />
indicate that H5 is of the highest initial importance, followed by H1;H2 and H9.<br />
The crisp and fuzzy initial technical ratings of the nine HOWs are shown in Table 7. Also shown there are the scaled<br />
crisp and fuzzy ratings that are easier <strong>to</strong> be compared. Same as in the case for the WHATs’ nal importance ratings<br />
(Table 4), crisp initial technical ratings tend <strong>to</strong> be close <strong>to</strong> the upper bounds and far away from the lower bounds of the<br />
corresponding fuzzy ratings, indicating more exibility and higher reliability represented by the fuzzy ratings.<br />
Step 8: Now turn <strong>to</strong> technical competitive analysis which is <strong>to</strong> nd and establish competitive advantages or <strong>to</strong> further<br />
enhance the existing advantages for restaurant C1, through comparing all the restaurants’ similar fried Chinese vegetables in<br />
terms of their technical performance on the nine identi ed HOWs. Although it is always not easy <strong>to</strong> acquire the technical<br />
performance levels of competi<strong>to</strong>rs’ products on the HOWs, restaurant C1 must try all the means <strong>to</strong> obtain this valuable<br />
information in order <strong>to</strong> know its technical strengths and weaknesses and hence <strong>to</strong> improve or enhance its competitiveness.<br />
Through a lot of e orts restaurant C1 obtains all the technical parameters of its own and its competi<strong>to</strong>rs’ fried Chinese<br />
vegetables in terms of the nine HOWs. This information forms a technical comparison matrix Y =[ynl] 9×4 as shown in<br />
Table 8 where, for example, amount of soy sauce the four restaurants use <strong>to</strong> make fried Chinese vegetables (H1) are 11,<br />
13, 8 and 9 ml, respectively, which form the rst column of the technical comparison matrix Y.<br />
Applying entropy method <strong>to</strong> Y in the same manner as in cus<strong>to</strong>mer competitive analysis (Step 3), technical competitive<br />
priority ratings can be obtained for restaurant C1’s fried Chinese vegetable on the nine HOWs:<br />
z =(z1;z2;:::;z9)=(0:1115; 0:1116; 0:1104; 0:1124; 0:1119; 0:1101; 0:1104; 0:1125; 0:1093):<br />
These ratings are shown in Table 8 from which we know that H8 and H4 are of the highest competitive priorities.<br />
According <strong>to</strong> the technical performance of its own and the other three restaurants’ fried Chinese vegetables in terms of<br />
the nine HOWs, restaurant C1 could set technical performance goal on each of the HOWs for its fried Chinese vegetable