Red Hat Developer Toolset 1.x User Guide - Linux
Red Hat Developer Toolset 1.x User Guide - Linux
Red Hat Developer Toolset 1.x User Guide - Linux

You also want an ePaper? Increase the reach of your titles
YUMPU automatically turns print PDFs into web optimized ePapers that Google loves.
4 8 Chapter 8. Valgrind<br />
Chapter 8. Valgrind<br />
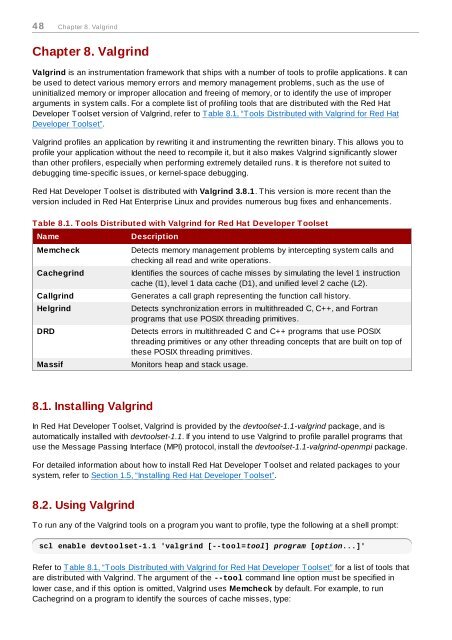
Valgrind is an instrumentation framework that ships with a number of tools to profile applications. It can<br />
be used to detect various memory errors and memory management problems, such as the use of<br />
uninitialized memory or improper allocation and freeing of memory, or to identify the use of improper<br />
arguments in system calls. For a complete list of profiling tools that are distributed with the <strong>Red</strong> <strong>Hat</strong><br />
<strong>Developer</strong> <strong>Toolset</strong> version of Valgrind, refer to Table 8.1, “Tools Distributed with Valgrind for <strong>Red</strong> <strong>Hat</strong><br />
<strong>Developer</strong> <strong>Toolset</strong>”.<br />
Valgrind profiles an application by rewriting it and instrumenting the rewritten binary. This allows you to<br />
profile your application without the need to recompile it, but it also makes Valgrind significantly slower<br />
than other profilers, especially when performing extremely detailed runs. It is therefore not suited to<br />
debugging time-specific issues, or kernel-space debugging.<br />
<strong>Red</strong> <strong>Hat</strong> <strong>Developer</strong> <strong>Toolset</strong> is distributed with Valgrind 3.8.1. This version is more recent than the<br />
version included in <strong>Red</strong> <strong>Hat</strong> Enterprise <strong>Linux</strong> and provides numerous bug fixes and enhancements.<br />
Table 8.1. Tools Distributed with Valgrind for <strong>Red</strong> <strong>Hat</strong> <strong>Developer</strong> <strong>Toolset</strong><br />
Name<br />
Memcheck<br />
Cachegrind<br />
Callgrind<br />
Helgrind<br />
DRD<br />
Massif<br />
Description<br />
Detects memory management problems by intercepting system calls and<br />
checking all read and write operations.<br />
Identifies the sources of cache misses by simulating the level 1 instruction<br />
cache (I1), level 1 data cache (D1), and unified level 2 cache (L2).<br />
Generates a call graph representing the function call history.<br />
Detects synchronization errors in multithreaded C, C++, and Fortran<br />
programs that use POSIX threading primitives.<br />
Detects errors in multithreaded C and C++ programs that use POSIX<br />
threading primitives or any other threading concepts that are built on top of<br />
these POSIX threading primitives.<br />
Monitors heap and stack usage.<br />
8.1. Installing Valgrind<br />
In <strong>Red</strong> <strong>Hat</strong> <strong>Developer</strong> <strong>Toolset</strong>, Valgrind is provided by the devtoolset-1.1-valgrind package, and is<br />
automatically installed with devtoolset-1.1. If you intend to use Valgrind to profile parallel programs that<br />
use the Message Passing Interface (MPI) protocol, install the devtoolset-1.1-valgrind-openmpi package.<br />
For detailed information about how to install <strong>Red</strong> <strong>Hat</strong> <strong>Developer</strong> <strong>Toolset</strong> and related packages to your<br />
system, refer to Section 1.5, “Installing <strong>Red</strong> <strong>Hat</strong> <strong>Developer</strong> <strong>Toolset</strong>”.<br />
8.2. Using Valgrind<br />
To run any of the Valgrind tools on a program you want to profile, type the following at a shell prompt:<br />
scl enable devtoolset-1.1 'valgrind [--tool=tool] program [option...]'<br />
Refer to Table 8.1, “Tools Distributed with Valgrind for <strong>Red</strong> <strong>Hat</strong> <strong>Developer</strong> <strong>Toolset</strong>” for a list of tools that<br />
are distributed with Valgrind. The argument of the --tool command line option must be specified in<br />
lower case, and if this option is omitted, Valgrind uses Memcheck by default. For example, to run<br />
Cachegrind on a program to identify the sources of cache misses, type: