Balancing of a Water and Air System (PDF
Balancing of a Water and Air System (PDF
Balancing of a Water and Air System (PDF

You also want an ePaper? Increase the reach of your titles
YUMPU automatically turns print PDFs into web optimized ePapers that Google loves.
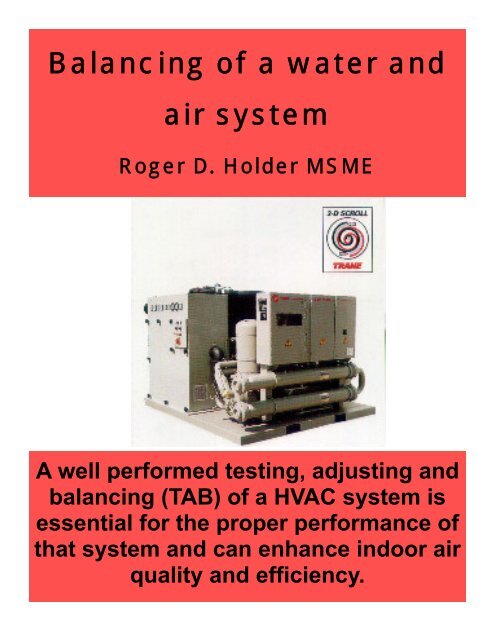
<strong>Balancing</strong> <strong>of</strong> a water <strong>and</strong><br />
air system<br />
Roger D. Holder MSME<br />
A well performed testing, adjusting <strong>and</strong><br />
balancing (TAB) <strong>of</strong> a HVAC system is<br />
essential for the proper performance <strong>of</strong><br />
that system <strong>and</strong> can enhance indoor air<br />
quality <strong>and</strong> efficiency.
2<br />
2
3<br />
8 TBA (Testing, <strong>Balancing</strong> <strong>and</strong> Adjusting)<br />
9 Testing <strong>and</strong> <strong>Balancing</strong><br />
Preliminary <strong>of</strong>fice work<br />
Preliminary field inspection<br />
Preliminary procedures<br />
10 The Preliminary Procedures<br />
<strong>Air</strong> Side<br />
<strong>Water</strong> Side<br />
Boiler<br />
Chiller <strong>and</strong> Condenser<br />
Electrical<br />
Controls<br />
12 The <strong>Balancing</strong> Procedures<br />
<strong>Air</strong> Side<br />
<strong>Water</strong> Side<br />
13 <strong>Air</strong>flow Measurement<br />
CFM, FPM, FT²<br />
Duct Flow<br />
Pitot tube Traverses<br />
Round Duct<br />
Square or Rectangular<br />
3
4<br />
Flat Oval<br />
20 Duct Friction loss<br />
20 Duct Velocity<br />
21 <strong>Balancing</strong> devices<br />
Volume dampers<br />
Turning vanes<br />
23 <strong>Air</strong> <strong>Balancing</strong> Tolerances<br />
24 Dual-Duct systems<br />
25 VAV system<br />
26 Fan tracking<br />
26 Volumetric tracking<br />
26 Plenum Pressurization tracking<br />
27 Induction systems<br />
28 Duct system pressure<br />
Static pressure<br />
Velocity pressure<br />
Total pressure<br />
29 Calculation <strong>of</strong> CFM from Heat flow<br />
<strong>Air</strong> Density<br />
Enthalpy<br />
47 Kitchen Ventilation<br />
4
5<br />
<strong>Air</strong> <strong>Balancing</strong><br />
Multiple Hood system<br />
50 Hydronic <strong>Balancing</strong> system<br />
Heat at reduced flow rate<br />
53 Hydronic pressure measuring instruments<br />
55 Hydronic flow measuring<br />
56 Venturi<br />
61 <strong>Water</strong> side balancing<br />
Equipment<br />
Record Keeping<br />
62 Sizing <strong>Balancing</strong> Valves<br />
63 Hydronic balancing Methods<br />
Preparation<br />
<strong>System</strong> Preparation<br />
Pump start up<br />
Confirmation <strong>of</strong> system venting<br />
<strong>Balancing</strong><br />
<strong>Balancing</strong> by Temperature Difference<br />
Proportional balancing<br />
5
6<br />
69 Pump Hydronic Volume Measurement<br />
Verification <strong>of</strong> Impeller size<br />
Determine Pump flow<br />
71 Centrifugal pump performance<br />
72 Net positive suction head<br />
73 Valves<br />
Automatic valves<br />
Two-way valves<br />
Three-way valves<br />
77 Constant volume water balancing procedure<br />
79 Variable volume water balancing procedure<br />
80 Expansion or compression tanks<br />
82 <strong>Air</strong> Separators<br />
83 Strainers<br />
83 Valves<br />
Manual valves<br />
Gate valves<br />
Globe valves<br />
Plug valves<br />
Ball valves<br />
Butterfly valves<br />
6
7<br />
87 Series Loop<br />
88 One pipe main<br />
90 Primary-Secondary<br />
91 <strong>Water</strong> cooling chiller<br />
95 <strong>Air</strong> cooled chiller<br />
97 Field Performance testing <strong>of</strong> chillers<br />
General Procedures<br />
Cooling tower testing<br />
104 Report <strong>of</strong> results<br />
104 Evaluating the test<br />
108 Cooling towers<br />
<strong>Water</strong> Temperature<br />
Inlet air temperature<br />
<strong>Water</strong> flow rate measurement<br />
Fan motor power<br />
Wind Velocity<br />
7
8<br />
<strong>Balancing</strong> <strong>of</strong> a water <strong>and</strong> air system<br />
Roger D. Holder MSME<br />
A well performed testing, adjusting <strong>and</strong> balancing (TAB) <strong>of</strong> a HVAC system is essential<br />
for the proper performance <strong>of</strong> that system <strong>and</strong> can enhance indoor air quality <strong>and</strong><br />
efficiency. Chapter 37 <strong>of</strong> the ASHRAE 2003 HVAC Applications H<strong>and</strong>book gives the<br />
following definition <strong>of</strong> TAB:<br />
HVAC system testing, adjusting, <strong>and</strong> balancing (TAB) is the process <strong>of</strong> checking <strong>and</strong><br />
adjusting all environmental systems in a building to produce the design objectives. This<br />
process includes.<br />
(1) <strong>Balancing</strong> air <strong>and</strong> water distribution systems<br />
(2) Adjusting the total system to provide design quantities<br />
(3) Electrical measurement<br />
(4) Establishing quantitative performance <strong>of</strong> all equipment<br />
(5) Verifying automatic control system operation <strong>and</strong> sequences <strong>of</strong> operation<br />
(6) Sound <strong>and</strong> vibration measurement<br />
These procedures are accomplished by checking installations for conformity to design,<br />
measuring <strong>and</strong> establishing the fluid quantities <strong>of</strong> the system as required meeting design<br />
specifications, <strong>and</strong> recording <strong>and</strong> reporting the results.<br />
The following definitions used in this chapter. Refer to ASHRAE Terminology <strong>of</strong> HVAC&R<br />
(1991) for additional definitions.<br />
Test. Determine quantitative performance <strong>of</strong> equipment.<br />
Adjust. Regulate the specified fluid flow rate <strong>and</strong> air patterns at the terminal equipment<br />
(e.g., reduce fan speed, adjust a damper).<br />
Balance. Proportion flows in the distribution system (submains, branches, <strong>and</strong><br />
terminals) according to specified design quantities.<br />
Balanced <strong>System</strong>. A system designed to deliver heat transfer required for occupant<br />
comfort or process load at design conditions. A minimum heat transfer <strong>of</strong> 97% should be<br />
provided to the space or load served at design flow. The flow required for minimum heat<br />
transfer establishes the system’s flow tolerance. The fluid distribution system should be<br />
designed to allow flow to maintain the required tolerance <strong>and</strong> verify its performance.<br />
Procedure. An approach to <strong>and</strong> execution <strong>of</strong> a sequence <strong>of</strong> work operations to yield<br />
repeatable results.<br />
Report forms. Test data sheets arranged in logical order for submission <strong>and</strong> review. They<br />
should also form the permanent record to be used as the basis for any future TAB work.<br />
Terminal. A point where the controlled medium (fluid or energy) enters or leaves the<br />
distribution system. In air systems, these may be variable- or constant-volume boxes,<br />
registers, grilles, diffusers, louvers, <strong>and</strong> hoods. In water systems, these may be heat<br />
transfer coils, fan-coil units, convectors, or finned-tube radiation or radiant panels.<br />
8
9<br />
Testing <strong>and</strong> <strong>Balancing</strong> HVAC<br />
A systematic approach is called for when balancing a HVAC air <strong>and</strong> water systems. The<br />
following is a general procedure that can be applied to all systems.<br />
1. Preliminary <strong>of</strong>fice work.<br />
a. Gather <strong>and</strong> prepare report forms.<br />
b. Gather plans <strong>and</strong> specifications.<br />
Gather all applicable plans <strong>and</strong> specifications to include contract drawings, shop<br />
drawings, “as-built” drawings, schematics <strong>and</strong> Manufacturers’ catalogs showing<br />
equipment data such as the description, capacities, <strong>and</strong> recommendations on testing <strong>of</strong><br />
their equipment <strong>and</strong> equipment performance curves. All items will not be available, the<br />
more information that can be gathered. Better underst<strong>and</strong>ing <strong>of</strong> a system <strong>and</strong> its<br />
components is needed to do a proper balancing. Study the plans <strong>and</strong> specifications to<br />
become familiar with the system <strong>and</strong> the Design Intent. Color <strong>and</strong> label the system <strong>and</strong> all<br />
<strong>of</strong> its components. This will make plans easier to reed.<br />
Design Intent as defined in ASHRAE Guideline 1 as a detailed explanation <strong>of</strong> the ideas,<br />
concepts, <strong>and</strong> criteria that defined work before starting. The design intent document<br />
utilized to provide a written record <strong>of</strong> these ideas, concepts, <strong>and</strong> criteria. Welldocumented<br />
design intent benefits the engineer during the design process. When<br />
objectives that are poorly defined at the beginning <strong>of</strong> the project, changes in the design<br />
may occur after the design is complete or worse. It helps the engineer to communicate<br />
his or her intentions to the design team. This early communication with the team as to<br />
there expectations helps the engineer better define scope <strong>of</strong> the work <strong>and</strong> avoid making<br />
costly changes later. The definition <strong>of</strong> Design Intent has served the industry with varying<br />
degrees <strong>of</strong> success.<br />
The basis <strong>of</strong> design intent is that all information necessary to accomplish the design<br />
including weather data, interior <strong>and</strong> exterior environmental criteria, other pertinent<br />
design assumption, cost goals, <strong>and</strong> references to applicable codes, st<strong>and</strong>ard,<br />
regulations, <strong>and</strong> guidelines be gather first.<br />
Make out the report forms for each system being tested. Report forms will include<br />
equipment test sheets <strong>and</strong> balancing sheets for the distribution system. It is also<br />
recommend that a schematic drawing <strong>of</strong> each system be made. Schematics may be very<br />
detailed showing the central system with pressure <strong>and</strong> temperature drops across<br />
components, duct <strong>and</strong> pipe sizes, terminal devices, balancing valves <strong>and</strong> dampers,<br />
required <strong>and</strong> actual flow quantities, etc. Do as much paperwork in the <strong>of</strong>fice as possible.<br />
2. Preliminary field inspection.<br />
c. Inspect the job site<br />
d. Inspect the distribution system.<br />
e. Inspect the equipment.<br />
9
10<br />
Preliminary Procedures<br />
1. Review contract documents <strong>and</strong> plans for all <strong>of</strong> the HVAC system.<br />
2. Review approved shop drawing <strong>and</strong> equipment submittals.<br />
3. Prepare system schematics.<br />
4. Insert preliminary data on test report forms.<br />
5. Review electrical characteristics <strong>of</strong> equipment <strong>and</strong> assure that safety controls are<br />
operating <strong>and</strong> that all motor starters have the proper heater coils or overload protection.<br />
6. Review completely the systems ready to be balance <strong>and</strong> verify that all balancing<br />
devices have been installed.<br />
7. Confirm that all HVAC <strong>and</strong> temperature control system have been tested, strainers<br />
cleaned, systems flushed, etc., <strong>and</strong> are ready to be balance. Clean or temporary air filters<br />
should be in place as specified.<br />
8. Confirm that all building components, such as ceiling plenums that affect system<br />
balance, are in place <strong>and</strong> sealed, <strong>and</strong> that all windows, door, etc., are installed <strong>and</strong><br />
closed.<br />
9. Confirm that all instruments are in good order.<br />
Inspect the job site to see that the building is architecturally ready for balancing. For<br />
instance, are all the walls, windows, door, <strong>and</strong> ceilings installed? If the conditioned<br />
space isn’t architecturally sealed, abnormal pressures <strong>and</strong> temperatures will adversely<br />
affect the system balance. Next, walk the air <strong>and</strong> water distribution system to ensure that<br />
they are intact, <strong>and</strong> aren’t missing components such as dampers, valves, pressure <strong>and</strong><br />
temperature taps, coils, terminal boxes, diffusers, grilles, etc. Lastly, inspect the<br />
equipment. Check that motors, fans, pumps, chillers, compressors, boilers, drives, etc.<br />
are mechanically <strong>and</strong> electrically ready. The following is a general list <strong>of</strong> items to be<br />
checked.<br />
The Preliminary Procedures<br />
<strong>Air</strong> Side<br />
1. Ductwork intact <strong>and</strong> properly sealed.<br />
2. Set all volume control damper <strong>and</strong> variable air volume boxes to the full open position,<br />
unless system diversity requires balancing in zones.<br />
3. Set outside air dampers to the minimum position.<br />
4. Ductwork leak tested.<br />
5. Access doors installed <strong>and</strong> properly secured.<br />
6. Ductwork installed according to the drawings <strong>and</strong> specification.<br />
7. Ductwork free from debris.<br />
8. Dampers, including fire <strong>and</strong> smoke dampers, installed <strong>and</strong> accessible.<br />
9. Terminal boxes, reheat coils, electrical reheat, etc., installed, functional <strong>and</strong><br />
accessible.<br />
10. All other air distribution devices such as diffusers, etc., installed <strong>and</strong> functional.<br />
11. Return air has an unobstructed path from each conditioned space back to the unit.<br />
12. Filters clean <strong>and</strong> correctly installed.<br />
10
11<br />
13. Filter frame properly installed <strong>and</strong> sealed.<br />
14. Coils cleaned <strong>and</strong> properly installed.<br />
15. Drive components installed.<br />
16. Sheaves properly aligned <strong>and</strong> tight on their shafts.<br />
17. Verify correct fan rotations <strong>and</strong> speeds.<br />
18. Belts adjusted for the correct tension.<br />
19. Belt guard properly installed.<br />
20. Automatic control dampers installed <strong>and</strong> functional.<br />
21. Fan vortex dampers functional.<br />
22. Fan housings installed <strong>and</strong> properly sealed according to the drawings <strong>and</strong><br />
specifications.<br />
23. Flexible connections installed properly.<br />
24. Fan wheel aligned properly <strong>and</strong> adequate clearance in the housing.<br />
25. Fan bearing lubricated<br />
26. Check motor amperages <strong>and</strong> voltages; make necessary adjustments.<br />
<strong>Water</strong> Side<br />
1. Strainers <strong>and</strong> piping free from debris, cleaned, <strong>and</strong> flushed.<br />
2. Set all balancing devices to full open position.<br />
3. Construction strainer baskets replaced with permanent baskets.<br />
4. Set mixing valves <strong>and</strong> control valves to full coil flow; close coil by-pass valves.<br />
5. <strong>System</strong> filled to the proper level <strong>and</strong> the pressure-reducing valve set.<br />
6. Automatic <strong>and</strong> manual air vents properly installed <strong>and</strong> functional<br />
7. All air purged from the system.<br />
8. <strong>Water</strong> in the expansion tanks at the proper level.<br />
9. All valves, flow meters, <strong>and</strong> temperature/pressure tap installed correctly, accessible<br />
<strong>and</strong> functional.<br />
10. Terminal coils installed, piped correctly, <strong>and</strong> accessible.<br />
11. Pumps properly aligned, grouted <strong>and</strong> anchored.<br />
12. Verify correct pump rotations <strong>and</strong> proper drive alignments.<br />
13. Vibration isolators properly installed <strong>and</strong> adjusted.<br />
14. Flexible connections installed properly.<br />
15. Measure <strong>and</strong> record pump motor amperages <strong>and</strong> voltages.<br />
16. Check pump flow before balancing coils.<br />
17. Proceed with air systems balancing.<br />
Boiler<br />
1. All operating <strong>and</strong> safety setting for temperature <strong>and</strong> pressure are correct.<br />
2. Pressure relief valve functional.<br />
3. Boiler started <strong>and</strong> operating properly.<br />
Chiller <strong>and</strong> Condenser<br />
11
12<br />
1. All operating <strong>and</strong> safety settings for temperature <strong>and</strong> pressure are correct.<br />
2. Chiller, condenser started, <strong>and</strong> operating correctly.<br />
Electrical<br />
1. Motors wired <strong>and</strong> energized.<br />
2. Proper starter <strong>and</strong> overload protection installed.<br />
3. Correct fuses installed.<br />
4. Motors properly secured on their frames.<br />
5. Motor bearings lubricated.<br />
Controls<br />
1. Controls complete <strong>and</strong> functional.<br />
2. Make initial tests on all fans <strong>and</strong> pump applicable to the system being balanced.<br />
3. Balance <strong>and</strong> adjust the distribution system.<br />
4. Adjust the fan or pump as needed.<br />
5. Take final reading.<br />
6. Complete reports.<br />
The <strong>Balancing</strong> Procedures<br />
<strong>Air</strong>side procedures<br />
1. All related HVAC <strong>and</strong> exhaust air system should be operating.<br />
2. Determine whether any other HVAC or exhaust air system could affect the system<br />
ready to be balanced.<br />
3. Make Pitot tube traverses on all main supply <strong>and</strong> major branch ducts where possible<br />
to determine the air distribution. Take extreme care that there is no damage to hepa<br />
filters by debris being pulled or pushed into them.<br />
4. Adjust balancing dampers <strong>of</strong> each major branch duct that is high on airflow. A<br />
minimum <strong>of</strong> one branch duct-balancing damper shall remain fully open.<br />
5. Measure <strong>and</strong> record the airflow <strong>of</strong> each terminal device in the system without<br />
adjusting any terminal outlet. Flow measuring hoods are the preferred airflow-measuring<br />
device.<br />
6. The total airflow for the terminal outlets should be close to the Pitot tube traverse air<br />
measurement <strong>of</strong> that branch, <strong>and</strong> the main duct traverse air measurement should be<br />
within 10% <strong>of</strong> the total <strong>of</strong> all terminal outlet air measurements.<br />
7. Check for excessive duct leakage if total terminal outlet air measurements are less<br />
than 95% <strong>of</strong> the main duct traverse air measurements.<br />
8. Adjust the terminals that are highest on airflow to about 10% under design airflow.<br />
9. Next, adjust each terminal outlet throughout the zone or system to design airflow <strong>and</strong><br />
record measurements <strong>and</strong> make any necessary branch damper adjustments.<br />
10. An additional adjusting pass throughout the system may be necessary. Make final<br />
adjustments to the fan drive where required. Record all data.<br />
11. Adjust terminal device vanes to minimize drafts <strong>and</strong> for proper air distribution.<br />
12. Measure <strong>and</strong> record system static pressures.<br />
12
13<br />
13. Measure <strong>and</strong> record all required outdoor air, return air, mixed air, <strong>and</strong> supply air dry<br />
bulb a wet bulb temperatures. Measure <strong>and</strong> record all plenum static pressures.<br />
14. Measure <strong>and</strong> record all coil entering air <strong>and</strong> leaving air dry bulb <strong>and</strong> wet bulb<br />
temperatures. Measure <strong>and</strong> record all coil pressure differentials.<br />
15. Measure <strong>and</strong> record final fan motor full load amperages <strong>and</strong> voltages.<br />
16. If the airflow is low, proceed with a proportional balancing. Proportional balancing<br />
is purporting the air equally by dividing the total airflow by the design airflow to get the<br />
percentage <strong>of</strong> airflow. Then multiplying the percentage <strong>of</strong> airflow to the design airflow for<br />
the percentage <strong>of</strong> air to set to.<br />
<strong>Water</strong>side procedures<br />
1. Continually check system <strong>and</strong> vent air from high points <strong>and</strong> circuits with lower flows<br />
during hydronic balancing. Periodically check <strong>and</strong> clean strainers.<br />
2. Using “pump shut<strong>of</strong>f head,” verify each pump head, operating curve <strong>and</strong> impeller size.<br />
3. Adjust pump to design flow <strong>and</strong> record data.<br />
4. Adjust boilers <strong>and</strong> or chillers to design flows <strong>and</strong> temperatures <strong>and</strong> record data. If the<br />
Pump is pumping water to coils first start there, always fallow the piping.<br />
5. If flow-measuring devices are used, record the flow data throughout the system before<br />
adjusting the system.<br />
6. Measure <strong>and</strong> record pressure drops through all coils <strong>and</strong> or units. Compare with<br />
submittal data for high <strong>and</strong> low flows.<br />
7. Adjust high flows to near design.<br />
8. Adjust pump flow to design <strong>and</strong> check pressures, amperages <strong>and</strong> voltages.<br />
9. Set bypass balancing cocks to 90% <strong>of</strong> maximum flow through coils that have threeway<br />
control valves.<br />
10. Repeat the above procedures until all coils <strong>and</strong> units are operating within 10% <strong>of</strong><br />
design. When coils in parallel are above five coils, balance the coil nearest to the pump<br />
to the coil at the end <strong>of</strong> the piping. The first coil is set at 80% to 85% <strong>of</strong> design flow<br />
depending on the number <strong>of</strong> coils; increase the percentage equally for each coil to the<br />
end <strong>of</strong> piping, then check the first coil flow.<br />
11. Measure <strong>and</strong> record final pump pressure, amperages, <strong>and</strong> voltages.<br />
12. Measure <strong>and</strong> record all coil <strong>and</strong> or unit pressure drops entering <strong>and</strong> leaving water<br />
temperatures.<br />
13. Measure <strong>and</strong> record all data from all flow measuring devices.<br />
<strong>Air</strong>flow Measurement<br />
CFM = cubic feet per minute<br />
FPM = velocity in feet per minute<br />
FT² = area in foot square<br />
13
14<br />
The basic airflow equation for any free area is<br />
{airflow (cfm) = area (ft²) X velocity (fpm)}<br />
2000 cfm = 2ft² X 1000 fpm<br />
{area (ft²) = airflow (cfm) / velocity (fpm)}<br />
2ft²= 2000 cfm / 1000 fpm<br />
{velocity (fpm) = airflow (cfm) / area (ft²)}<br />
1000 fpm = 2000 cfm / 2ft²<br />
{Velocity fpm = 4005 X √ Velocity pressure}<br />
997.2 fpm = 4005 X √ 0.062 in. w.g.<br />
Free area defined as the total minimum area <strong>of</strong> openings in an air outlet or inlet device<br />
through which air can pass. Free area <strong>of</strong> return air or supply air grilles may be as low as<br />
50% <strong>of</strong> the duct connection size. The free cross-sectional area <strong>of</strong> a duct normally is<br />
100%. If other data are not available, it may be assumed that all similar return air or<br />
supply air grilles would have similar free areas when measured with the same<br />
instrument.<br />
<strong>Air</strong>flow equation for a return air or supply air grilles<br />
{<strong>Air</strong>flow (cfm) = area (ft²) X velocity (fpm) X % <strong>of</strong> free area}<br />
2250 cfm = 3 ft² X 1000 fpm X 75% free area<br />
{% <strong>of</strong> free area = airflow (cfm) / area (ft²) X velocity (fpm)}<br />
75% = 2250 cfm / 3 ft² X 1000 fpm<br />
Example 1: find the cfm <strong>of</strong> a duct <strong>of</strong> 24”X12” with a velocity <strong>of</strong> 1000 fpm. Find the cfm <strong>of</strong><br />
the duct.<br />
Solution<br />
24”X12”/144= 2 ft²<br />
2 ft² X 1000 fpm = 2000 cfm<br />
Example 2: A 48”X36” return air grille has a measured average velocity <strong>of</strong> 370 fpm. A<br />
Pitot tube traverse <strong>of</strong> the connecting duct indicates airflow <strong>of</strong> 2975 cfm. Find the return<br />
air grille free area percentage.<br />
Solution<br />
Free area is equal to; duct airflow in cfm divided by grille velocity in fpm, Divided by the<br />
area <strong>of</strong> the grill times 100<br />
2975 cfm / 370 fpm = 8.04<br />
48”X36”/144= 12 ft² grill<br />
8.04 / 12 ft² = 0.67<br />
0.67 X 100 = 67% free area<br />
14
15<br />
15<br />
Example 3: Find the nearest st<strong>and</strong>ard size round duct to h<strong>and</strong>le 4600 cfm at a velocity <strong>of</strong><br />
1000 fpm.<br />
Solution<br />
Area <strong>of</strong> the duct in ft² is equal to: <strong>Air</strong>flow cfm / Velocity fpm<br />
Food square to inch square is equal to: ft² X 144 = in²<br />
In² to duct radius is equal to: √ square root <strong>of</strong>; area in² / ∏ (3.14)<br />
Radius to diameter is equal to: radius X 2 = diameter<br />
4600 cfm / 1000 fpm = 4.6 ft²<br />
4.6 ft² X 144 = 662.4 in²<br />
662.4 in² / 3.14 ∏ = 210.95<br />
Duct Flow<br />
√ <strong>of</strong> 210.95 = 14.52<br />
14.52 X 2 = 29.05<br />
29.05” diameter <strong>of</strong> a duct for 4600 cfm at 1000 fpm<br />
The preferred method <strong>of</strong> measuring duct volumetric flow is the pitot-tube traverse<br />
average. The maximum straight run should be obtained before <strong>and</strong> after the traverse<br />
station. To obtain the best duct velocity pr<strong>of</strong>ile, measuring points should be located as<br />
shown in Chapter 14 <strong>of</strong> the 2001 ASHRAE H<strong>and</strong>book—Fundamentals <strong>and</strong> ASHRAE<br />
St<strong>and</strong>ard 111. When using factory-fabricated volume-measuring stations, the<br />
measurements should be checked against a pitot-tube traverse.<br />
Power input to a fan’s driver should be used as only a guide to indicate its delivery; it<br />
may also be used to verify performance determined by a reliable method (e.g., pitot-tube<br />
traverse <strong>of</strong> system’s main) that considers possible system effects. For some fans, the<br />
flow rate is not proportional to the power needed to drive them. In some cases, as with<br />
forward-curved-blade fans, the same power is required for two or more flow rates. The<br />
backward-curved-blade centrifugal fan is the only type with a flow rate that varies directly<br />
with the power input.<br />
Pitot Tube Traverses<br />
Procedures<br />
• To accomplish repeatable traverse measurements, take the measurements in a<br />
specific, measured pattern, as indicated in 3.2. below.<br />
• Duct size must not change in a traversed section.<br />
• Face the Pitot tube into the air stream, parallel to the ductwork at each measurement<br />
point, <strong>and</strong> measure the velocity.<br />
• Convert velocity pressure to fpm velocity before averaging if the traverse is taken at<br />
other than st<strong>and</strong>ard conditions.<br />
• Take traverse measurements at actual conditions <strong>and</strong> actual cubic feet per minute<br />
[Actual CFM]. Correct Actual CFM to st<strong>and</strong>ard CFM [St<strong>and</strong>ard CFM] when specified by<br />
15
16<br />
using the density correction.<br />
• With figure 3.2 Verify that velocity measurements are acceptable. A traverse plane is<br />
suitable for flow measurements if more than 75% <strong>of</strong> the velocity pressure readings are<br />
greater than 1/10 <strong>of</strong> the maximum velocity measurement <strong>and</strong> are not negative.<br />
• Show all traverses in the final report which will show duct size, static pressure at the<br />
traverse, velocity pressure <strong>and</strong> corresponding velocity, duct area, <strong>and</strong> the airflow. If the<br />
traverse is taken in other than st<strong>and</strong>ard conditions, show barometric pressure <strong>and</strong><br />
temperature. Show density corrections for each traverse.<br />
Round Duct Traverse<br />
For field traverses any duct that are greater than 10" (250 mm) diameter, use the st<strong>and</strong>ard<br />
Pitot tube. Two holes located 90" apart in the same plane are required to make a Pitot<br />
tube traverse <strong>of</strong> a round duct. The Pitot tube must be marked so that velocity pressure<br />
readings (10 for each hole) can be taken at centers <strong>of</strong> equal concentric areas. Pitot tube<br />
locations for traversing round ducts with 20 readings are as follows in Figure 3.1.<br />
16
17<br />
For traverses taken in round duct equal to or less than 10" (250 mm) in diameter, a l/8" (3<br />
mm) diameter Pitot tube shall be used. The 1/8" (3 mm) diameter Pitot tube must be<br />
marked so that 12 velocity pressures (six for each hole) can be taken at the center <strong>of</strong><br />
equal concentric areas. Pitot tube locations for traversing the round duct with 12<br />
readings are given in Figure 3.2:<br />
Square or Rectangular Duct Traverse<br />
Performing a Pitot tube traverse <strong>of</strong> a square or rectangular duct, the number <strong>and</strong> spacing<br />
<strong>of</strong> the holes in the duct <strong>and</strong> the markings on the Pitot tube are determined using the<br />
following method:<br />
The minimum number <strong>of</strong> readings taken in a square or rectangle duct is 4. This would be<br />
for a duct with height <strong>and</strong> width 4" (100 m) or less. The number <strong>of</strong> readings for each side<br />
will be based on Figure 3.3.<br />
17
18<br />
For any duct with a side greater than 100” (2400 mm), the maximum distance between<br />
holes shall not exceed 12” (300 mm). For all readings, the corner reading shall be located<br />
l/2 the distance between readings. For example, a 12” (300 mm) duct width will have 3<br />
readings 4” (100 m) apart with the first reading taken 2“ (50 mm) from the duct wall.<br />
18
19<br />
Flat Oval Duct Traverses<br />
For field readings, flat oval ducts may be traversed by two different methods depending<br />
on the dimensions <strong>of</strong> the duct.<br />
If the width <strong>of</strong> rectangle EF to GH as shown in Figure 3.4 is less than the diameter <strong>of</strong> the<br />
semi-circle (Line EG), then traverse as a circle using the Equal Area Method (Figure 3.1 or<br />
3.2) at (A-B) <strong>and</strong> (C-D). The area <strong>of</strong> the oval will be computed by adding the area <strong>of</strong> the<br />
circle to the area <strong>of</strong> the rectangle.<br />
If the width <strong>of</strong> rectangle EF to GH as shown in Figure 3.5 is greater than or equal to the<br />
diameter <strong>of</strong> the semi-circle (Line EG), then traverse as a rectangle (Figure 3.3). For the<br />
two semi-circles traverse the plane (A-B) <strong>and</strong> (C-D) using the spacing shown in round<br />
duct traverse (Figures 3.1 or 3.2). The area will be computed by adding the area <strong>of</strong> the<br />
circle to the area <strong>of</strong> the rectangle.<br />
19
20<br />
.06<br />
”<br />
.08<br />
”<br />
.10<br />
”<br />
.12<br />
”<br />
.14<br />
”<br />
CFM <strong>of</strong> Ducts at a Friction Loss in inches <strong>of</strong> water<br />
Per 100 feet <strong>of</strong> duct at 29.29”<br />
Duct sizes in inches<br />
5” 6” 7” 8” 9” 10” 12” 14” 16” 18” 20” 22”<br />
52 85 123 175 240 320 505 775 1100 1500 1940 2450<br />
60 97 143 210 270 365 600 900 1390 1725 2290 2950<br />
68 109 162 240 315 420 690 1000 1460 1975 2610 3150<br />
75 120 178 255 345 485 750 1110 1600 2200 2900 3600<br />
84 130 195 270 387 510 830 1200 1750 2400 3180 3950<br />
CFM <strong>of</strong> Ducts at different Velocity<br />
Velocity in Feet per minutes at 29.92”<br />
Ducts 5” 6” 7” 8” 9” 10” 12” 14” 16” 18” 20” 22”<br />
FPM<br />
600 83 120 160 208 265 330 475 650 850 1040 1300 1600<br />
800 110 160 210 280 350 440 625 850 1150 1600 1750 2100<br />
1000 138 195 265 345 440 550 790 1090 1400 1780 2190 2420<br />
If an installation has an inadequate straight length <strong>of</strong> ductwork or no ductwork to allow a pitottube<br />
traverse, the procedure from Sauer <strong>and</strong> Howell (1990) can be followed: a vane<br />
anemometer reads air velocities at multiple points across the face <strong>of</strong> a coil to determine a loss<br />
coefficient.<br />
20
21<br />
<strong>Balancing</strong> Devices<br />
Volume Dampers<br />
<strong>Balancing</strong> dampers are a primary component in duct systems, <strong>and</strong> their importance should not<br />
be ignored. <strong>Balancing</strong> dampers are used to control the volume <strong>of</strong> airflow in the system by<br />
creating a resistance to flow. <strong>Balancing</strong> dampers can produce unnecessary resistance <strong>and</strong><br />
noise problems, <strong>and</strong> will not control the air as intended if improperly selected,<br />
located, installed, or adjusted.<br />
The relationship between the position <strong>of</strong> a damper <strong>and</strong> its percentage <strong>of</strong> airflow with respect to<br />
the airflow through a fully open damper is termed its “flow characteristic.”<br />
Opposed-blade dampers are generally recommended for large ducts because they provide<br />
better control <strong>of</strong> the airflow, <strong>and</strong> therefore have better flow characteristics than parallel blade<br />
dampers. The actual effect <strong>of</strong> closing a damper can only be determined from field<br />
measurements. Proper location <strong>of</strong> balancing dampers not only permits efficient air distribution<br />
but also equalizes the pressure drops in the different airflow paths within the system (Figure<br />
6.1). Manually operated opposed-blade or single-blade, quadrant-type volume dampers must be<br />
installed in every zone duct <strong>of</strong> a multi-zone system <strong>and</strong> each branch duct take<strong>of</strong>f to control the<br />
amount <strong>of</strong> air entering the branch.<br />
Manual dampers should be provided in each branch take<strong>of</strong>f to control the airflow to grilles <strong>and</strong><br />
diffusers. Single-blade or opposed-blade volume dampers located immediately behind diffusers<br />
21
22<br />
<strong>and</strong> grilles should not be used for balancing because when throttled they create noise, change<br />
the flow factor, can be easily tampered with <strong>and</strong> are an unnecessary expense. Proper<br />
installation <strong>and</strong> location <strong>of</strong> balancing dampers in the take<strong>of</strong>fs eliminates the need for volume<br />
controls at grilles <strong>and</strong> diffusers. Each damper should be adjustable with a locking quadrant<br />
h<strong>and</strong>le or regulator <strong>and</strong> end bearings that have sufficient strength <strong>and</strong> rigidity for the pressures<br />
being controlled. The locking quadrant must be located outside the vapor seal <strong>of</strong> the insulation.<br />
Generally, parallel-blade dampers are used in mixing plenum applications, <strong>and</strong> opposed-blade<br />
dampers are used in a volume-control application. It should be noted that only a slight opening<br />
<strong>of</strong> an opposed blade volume damper might generate a relatively high noise level as the air<br />
passes through. To minimize generated duct noise at volume dampers, dampers should be<br />
located at least two duct diameters from a fitting <strong>and</strong> as far as possible from an outlet/inlet.<br />
A spin-in collar with a volume damper is used to make a run out to a grille or diffuser. They can<br />
be conical, bell mouth, flanged or notched. They should be used for ducts with velocities below<br />
1000 fpm (5.1 m/s) <strong>and</strong> under 0.50” static pressure. The round damper must have a square rod<br />
with end bearings <strong>and</strong> st<strong>and</strong><strong>of</strong>f for externally insulated ducts <strong>and</strong> locking quadrants. The square<br />
rod must be continuous for all dampers 12” (300 mm) <strong>and</strong> above. The damper should also be<br />
stiffened to prevent movement in the airstreams.<br />
Splitter devices <strong>of</strong>fer little or no control <strong>of</strong> air volume in ducts. They should be regarded as air<br />
diverters only with maximum effectiveness when present in duct systems exhibiting low<br />
resistance to airflow. When used as a diverter, splitter devices must have at least one push rod<br />
with a locking device. The push rod must be connected to the leading edge <strong>of</strong> the splitter at 90<br />
degrees to the blade, not controlled by the quadrant h<strong>and</strong>le on the pivot shaft. Splitter devices<br />
should be long enough to divert the airflow in the duct. As a minimum, the length should be<br />
twice the size <strong>of</strong> the smallest throat <strong>of</strong> the nested connection.<br />
The use <strong>of</strong> adjustable extractors (Figure 6.2) is not generally recommended because they can<br />
cause turbulence in the main trunk line, thereby increasing the system total pressure <strong>and</strong><br />
affecting the performance <strong>of</strong> other branch outlets downstream. Extractors are not balancing<br />
devices <strong>and</strong> should not be used at branch or main duct take<strong>of</strong>fs to provide volume control.<br />
Extractors are principally used to divert air to branch ducts when they are the full height <strong>of</strong> the<br />
duct.<br />
22
23<br />
Turning Vanes<br />
Turning vanes (Figure 6.3) reduce the pressure loss <strong>and</strong> provide a uniform velocity distribution<br />
downstream from mitered rectangular elbows when smooth radius rectangular elbows are not<br />
used. Turning vanes should be installed so that the air entering <strong>and</strong> leaving the vanes is parallel<br />
to the duct walls. Double thickness or single thickness with a trailing (extended) edge turning<br />
vanes should be used in all rectangular elbows.<br />
<strong>Air</strong> <strong>Balancing</strong> Tolerances<br />
All air quantities shall be measured according to National St<strong>and</strong>ards. All air<br />
balancing tolerances shall be superseded by the specification if different. Total air<br />
quantity to each space shall be within ± 10% <strong>of</strong> design. Terminals shall be adjusted to<br />
design quantities in accordance with Figure 6.5.<br />
23
24<br />
Dual-Duct <strong>System</strong>s<br />
Most constant-volume dual-duct systems are designed to h<strong>and</strong>le part <strong>of</strong> the total<br />
system’s supply through the cold duct <strong>and</strong> smaller air quantities through the hot duct.<br />
<strong>Balancing</strong> should be accomplished as follows:<br />
1. When adjusting multizone or dual-duct constant-volume systems. establish the ratio<br />
<strong>of</strong> the design volume through the cooling coil to total fan volume to achieve the desired<br />
diversity factor. Keep the proportion <strong>of</strong> cold to total air constant during the balance.<br />
However, check each zone or branch with this component on full cooling. If the design<br />
calls for full flow through the cooling coil, the entire system should be set to full flow<br />
through the cooling side while making tests. Perform the same procedure for the hot-air<br />
side.<br />
2. Check the leaving air temperature at the nearest terminal to verify that hot <strong>and</strong> cold<br />
damper inlet leakage is not greater than the established maximum allowable leakage.<br />
3. Check apparatus <strong>and</strong> main trunks, as outlined in the section on Equipment <strong>and</strong><br />
<strong>System</strong> Check.<br />
4. Determine whether static pressure at the end <strong>of</strong> the system (the longest duct run) is at<br />
or above the minimum required for mixing box operation. Proceed to the extreme end <strong>of</strong><br />
the system <strong>and</strong> check the static pressure with an inclined manometer. Pressure should<br />
exceed the minimum static pressure recommended by the mixing box manufacturer.<br />
5. Proportionately balance diffusers or grilles on the low-pressure side <strong>of</strong> the box, as<br />
described for low-pressure systems in the previous section.<br />
6. Change control settings to full heating, <strong>and</strong> ensure that the controls <strong>and</strong> dual-duct<br />
boxes function properly. Spot-check the airflow at several diffusers. Check for<br />
stratification.<br />
7. If the engineer has included a diversity factor in selecting the main apparatus, it will<br />
not be possible to get full flow from all boxes simultaneously, as outlined in item 3 under<br />
Equipment <strong>and</strong> <strong>System</strong> Check. Mixing boxes closest to the fan should be set to the<br />
opposite hot or cold deck to the more-critical-season airflow to force the air to the end <strong>of</strong><br />
the system.<br />
24
25<br />
<strong>Balancing</strong> the VAV <strong>System</strong><br />
The general procedure for balancing a VAV system is.<br />
1. Determine the required maximum air volume to be delivered by the supply <strong>and</strong> return<br />
air fans. Load diversity usually means that the volume will be somewhat less than the<br />
outlet total.<br />
2. Obtain fan curves on these units, <strong>and</strong> request information on surge characteristics<br />
from the fan manufacturer.<br />
3. If inlet vortex damper is used, obtain the fan manufacturer’s data on damper control<br />
(deaeration) <strong>of</strong> the fan when used with the damper. If speed control is used, find the<br />
maximum <strong>and</strong> minimum speed that can be used on the project.<br />
4. Obtain from the manufacturer the minimum <strong>and</strong> maximum operating pressures for<br />
terminal or variable-volume boxes to be used on the project.<br />
5. Construct a theoretical system curve, including an approximate surge area. The<br />
system curve starts at the boxes’ minimum inlet static pressure, plus system loss at<br />
minimum flow, <strong>and</strong> terminates at the design maximum flow. The operating range using<br />
an inlet vane damper is between the surge line intersection with the system curve <strong>and</strong><br />
the maximum design flow. When variable speed control is used, the operating range is<br />
between.<br />
1. The minimum speed that can produce the necessary minimum box static pressure at<br />
minimum flow still in the fan’s stable range<br />
2. The maximum speed necessary to obtain maximum design flow<br />
6. Position the terminal boxes to the proportion <strong>of</strong> maximum fan air volume to total<br />
installed terminal maximum volume.<br />
7. Set the fan to operate at approximate design speed (increase about 5% for a fully open<br />
inlet vane damper).<br />
8. Check a representative number <strong>of</strong> terminal boxes. If static pressure varies widely, or if<br />
airflow at several boxes is below flow, check every box.<br />
9. Run a total air traverse with a pitot tube.<br />
10. Increase speed if static pressure <strong>and</strong>/or volume are low. If volume is correct but<br />
static is high, reduce speed. If static is high or correct but volume is low, check for<br />
system effect at the fan. If there is no system effect, go over all terminals <strong>and</strong> adjust them<br />
to the proper volume.<br />
11. Run Steps (7) through (10) with the return or exhaust fan set at design flow as<br />
measured by a pitot-tube traverse <strong>and</strong> with the system set on minimum outside air.<br />
12. Proportion the outlets, <strong>and</strong> verify design volume with the VAV box on maximum flow.<br />
25
26<br />
Verify minimum flow setting.<br />
13. Set terminals to minimum, <strong>and</strong> adjust the inlet vane or speed controller until<br />
minimum static pressure <strong>and</strong> airflow are obtained.<br />
14. Temperature control personnel, balancing personnel, <strong>and</strong> the design engineer should<br />
agree on the final placement <strong>of</strong> the sensor for the static pressure controller. This sensor<br />
must be placed in a representative location in the supply duct to sense average<br />
maximum <strong>and</strong> minimum static pressures in the system.<br />
15. Check return air fan speed or its inlet vane damper, which tracks or adjusts to the<br />
supply fan airflow, to ensure proper outside air volume.<br />
16. Operate the system on 100% outside air (weather permitting), <strong>and</strong> check supply <strong>and</strong><br />
return fans for proper power <strong>and</strong> static pressure.<br />
Fan Tracking<br />
As supply system airflows <strong>and</strong> pressures change, consideration must be given as to how<br />
the return air, outside air <strong>and</strong> relief air track.<br />
Volumetric Tracking<br />
Volumetric tracking is the preferred method <strong>of</strong> measurement. Tracking is accomplished<br />
by measuring the airflows <strong>of</strong> two fan systems. This maintains a difference for constant<br />
minimum outside air volume <strong>and</strong> building pressurization. Fan selection is critical to<br />
prevent surges or unstable operation <strong>of</strong> the controls. Surge can occur as the fan<br />
approaches a point where there is insufficient air entering the fan wheel to completely fill<br />
the space between the blades. Surge will be indicated by a fluctuation in CFM <strong>and</strong> static<br />
pressure, <strong>and</strong> will create a noisy operation.<br />
Sizing <strong>of</strong> the calibrated airflow station is also critical in the air h<strong>and</strong>ling unit operation.<br />
Unstable operation <strong>of</strong> controls occurs when the velocity drops below 600 fpm (3 m/s)<br />
where the air measuring station is out <strong>of</strong> range. Most transducers require at least 0.02”wc<br />
<strong>of</strong> pressure to operate properly. Consideration must also be made on the high end to not<br />
exceed the transducer’s range.<br />
Plenum Pressurization Tracking<br />
Plenum pressurization is the control <strong>of</strong> fan speed <strong>and</strong> minimum outside air<br />
volumes by constant plenum pressure. The control <strong>of</strong> supply fan speed or vane control is<br />
accomplished by maintaining a constant duct pressure at various volumes at a point<br />
designated for control, usually 2/3 distance down the supply duct. The minimum outside<br />
air volume is maintained with a constant mixed air plenum pressure controlling the<br />
return air damper. The purge (exhaust) damper is controlled by building pressure. The<br />
return fan speed is controlled by a constant return fan discharge plenum pressure. The<br />
26
27<br />
maximum out-side air damper for economizer is controlled by mixed air temperature.<br />
Prior to setting, the plenum pressure tracking, the supply, return <strong>and</strong> exhaust system<br />
must be balanced. The supply duct static pressure set point is measured <strong>and</strong> recorded<br />
(Point A) (Figure 10.1). With the system set for maximum airflow, return air damper<br />
closed, economizer <strong>and</strong> relief air dampers 100% open, set the return/relief airflow, adjust,<br />
measure <strong>and</strong> record. Read <strong>and</strong> record the discharge air static pressure <strong>of</strong> the return/<br />
relief fan (Point B), which will be the static pressure controller set point. Set the building<br />
pressure controller to maintain <strong>and</strong> control the relief air dampers. Read <strong>and</strong> record the<br />
set point. Release the economizer dampers <strong>and</strong> set to minimum outside condition. Adjust<br />
the mixed air pressure sensor to obtain the minimum outside air. Read <strong>and</strong> record the<br />
mixed air pressure sensor set point (Point C).<br />
Set the supply system to minimum airflow <strong>and</strong> verify the mixed air pressure sensor is<br />
controlling by measuring <strong>and</strong> recording system static pr<strong>of</strong>iles with the system at<br />
maximum, a midpoint <strong>and</strong> minimum airflow.<br />
Induction <strong>System</strong>s<br />
Most induction systems use high-velocity air distribution. <strong>Balancing</strong> should be<br />
accomplished as follows:<br />
1. For apparatus <strong>and</strong> main trunk capacities, perform general VAV balancing procedures.<br />
2. Determine primary airflow at each terminal unit by reading the unit plenum pressure<br />
with a manometer <strong>and</strong> locating the point on the charts (or curves) <strong>of</strong> air quantity versus<br />
27
28<br />
static pressure supplied by the unit manufacturer.<br />
3. Normally, about three complete passes around the entire system are required for<br />
proper adjustment. Make a final pass without adjustments to record the end result.<br />
4. To provide the quietest possible operation, adjust the fan to run at the slowest speed<br />
that provides sufficient nozzle pressure to all units with minimum throttling <strong>of</strong> all unit <strong>and</strong><br />
riser dampers.<br />
5. After balancing each induction system with minimum outside air, reposition to allow<br />
maximum outside air <strong>and</strong> check power <strong>and</strong> static pressure readings.<br />
Duct <strong>System</strong> Pressure<br />
The duct system designer calculates the static pressure losses <strong>of</strong> the straight section <strong>of</strong><br />
ductwork using engineering tables <strong>and</strong> charts. To these losses, the losses <strong>of</strong> the entire<br />
duct fitting are calculated <strong>and</strong> added along with the pressure loss data <strong>of</strong> all<br />
manufactured items such as filters, coils, dampers <strong>and</strong> diffusers or grills. The duct<br />
system fan(s) are selected from the total static pressure losses <strong>of</strong> the longest run(s) <strong>of</strong><br />
the supply air <strong>and</strong> return air ducts connected to the fan(s).<br />
The three duct pressure that technicians measure in the field are total pressure (TP),<br />
static pressure (SP), <strong>and</strong> velocity pressure (Vp). The three pressures are related by the<br />
following equation:<br />
Total pressure in w.g. (TP) = Static pressure in w.g. (SP) + Velocity pressure in w.g. (Vp)<br />
Static pressure<br />
Static pressure (SP) is exerted equally in all directions at any point or cross section <strong>of</strong><br />
the duct. It also is a measure <strong>of</strong> the potential energy to produce <strong>and</strong> maintain airflow<br />
against duct resistance. Static pressure may be positive or negative to the atmosphere,<br />
but it can be measured indirectly by subtracting the velocity pressure from the total<br />
pressure (SP = TP – Vp).<br />
Velocity pressure<br />
Velocity pressure (Vp) is exerted only in the direction <strong>of</strong> airflow <strong>and</strong> is a measure <strong>of</strong><br />
kinetic energy resulting from the airflow. Velocity pressure cannot be measured directly<br />
by a pitot tube <strong>and</strong> pressure gauge or manometer, but it can be measured indirectly by<br />
subtracting the static pressure from the total pressure (Vp = TP – SP).<br />
Vp = (Velocity in fpm / 4005)²<br />
Total pressure<br />
Total pressure (TP) <strong>of</strong> a duct is measured by the impact <strong>of</strong> the moving air stream on the<br />
end <strong>of</strong> a Pitot tube directly facing <strong>and</strong> perpendicular to the airflow. Total pressure<br />
28
29<br />
determines how much energy is in the airflow at any point in the system. Total pressure<br />
always decline in value from the fan to any terminal device (diffuser or grille), but it can<br />
be measured indirectly by adding the static pressure to the Velocity pressure (TP = SP +<br />
Vp).<br />
Example 4: A 48 X 16 in. duct h<strong>and</strong>les 10,700 cfm at 2.3 in. w.g. static pressure. Find the<br />
total pressure <strong>and</strong> velocity pressure <strong>of</strong> the duct.<br />
Velocity fpm = cfm / area in ft²<br />
Velocity pressure = (velocity fpm / 4005)²<br />
Total pressure = static pressure + velocity pressure<br />
10,700 cfm / (48 X 16 / 144) = 2006 fpm<br />
(2006 fpm / 4005)² = 0.25 in. w.g. velocity pressure<br />
2.3 in. w.g. static pressure + 0.25 in. w.g. velocity pressure = 2.55 in. w.g. total pressure<br />
Calculation <strong>of</strong> CFM from Heat flow<br />
The temperature <strong>of</strong> air decreases progressively as the air passes through an evaporator<br />
coil. The drop in air temperature is greatest across the first row <strong>of</strong> the coil <strong>and</strong><br />
diminishes as the air passes across each succeeding row. The fact that the temperature<br />
difference between the air <strong>and</strong> the refrigerant is greatest across the first row, <strong>and</strong><br />
becomes less <strong>and</strong> less as the temperature <strong>of</strong> the air is reduced in passing across each<br />
succeeding row. The temperature difference is least across the last row <strong>of</strong> the coil.<br />
External factors affect coil performance. Principal among these are the circulation,<br />
velocity, <strong>and</strong> distribution <strong>of</strong> air in the refrigerated space <strong>and</strong> over the coil. These factors<br />
29
30<br />
are closely related <strong>and</strong> in many cases is dependent one on the other.<br />
Heat from the product or condition space is carried to the evaporator by air circulation.<br />
When air circulation is inadequate, heat is not carried from the product or condition<br />
space to the evaporator at a rate sufficient to allow the evaporator to perform at peak<br />
efficiency or capacity. It is important also that the circulation <strong>of</strong> air is evenly distributed<br />
in all parts <strong>of</strong> the refrigerated space <strong>and</strong> over the coil. Poor distribution <strong>of</strong> the air<br />
circulating can result in uneven temperatures <strong>and</strong> dead spots in the air condition space.<br />
Uneven distribution <strong>of</strong> air over the coil surface causes some parts <strong>of</strong> the surface to<br />
function less efficiently than other <strong>and</strong> lowers evaporator capacity <strong>and</strong> efficiency.<br />
When air velocity is low, the air passing over the coil stays in contact with the coil<br />
surface longer. More heat is removed <strong>and</strong> is cooled with a greater range. Thus, the<br />
temperature difference increases, the refrigerant temperature decreases, resulting in a<br />
loss <strong>of</strong> capacity <strong>and</strong> efficiency because the rate <strong>of</strong> heat transfer is lowered. As air<br />
velocity increases, a greater quantity <strong>of</strong> air is brought into contact with the evaporator<br />
coil. Consequently, the temperature difference decreases, the refrigerant temperature<br />
increases, resulting in a gain <strong>of</strong> capacity <strong>and</strong> efficiency because the rate <strong>of</strong> heat transfer<br />
is increases.<br />
<strong>Air</strong> volume change across the coil will increase or decrease the refrigerant temperature<br />
that increases or decreases the efficiency <strong>and</strong> capacity <strong>of</strong> a system. Increasing the heat<br />
by increasing the airflow or increasing the evaporating coil size by 10% will be decrease<br />
<strong>of</strong> water removed from the air by 2% to 4%, but there will be a 4% to 8% capacity<br />
increase. This will result in a change <strong>of</strong> the load in the system from a 72% to 74%<br />
sensible heat increase <strong>and</strong> from a 28% to 26% latent heat decrease. An increase <strong>of</strong> the<br />
refrigerant temperature <strong>of</strong> 1ºF will increase compressor efficiency by 1% to 2%.<br />
The reason for the increase in heat <strong>and</strong> the increase in refrigeration temperature is due to<br />
the increasing size <strong>and</strong>/or airflow <strong>of</strong> the overall coil. Over size an evaporating coil or<br />
increase airflow, decreases the water removing capacity <strong>of</strong> a coil.<br />
Decrease heat by a decrease <strong>of</strong> airflow or an evaporating coil size by 10% will result in a<br />
2% to 4% increase <strong>of</strong> water removed from the air, will cause a 4% to 8% capacity<br />
decrease. The capacity decrease results in a 72% to 70% decrease <strong>of</strong> sensible heat<br />
change to the load in the system, thereby causing a 28% to 30% latent heat increases. A<br />
decrease <strong>of</strong> the refrigerant temperature <strong>of</strong> 1ºF will decrease compressor efficiency by 1%<br />
to 2%.<br />
The decrease compression efficiency is caused by the decrease in heat, <strong>and</strong> the<br />
refrigeration temperature that is due to the decreasing size <strong>and</strong>/or airflow <strong>of</strong> the overall<br />
coil. Under sizing an evaporating coil or a decrease <strong>of</strong> refrigerant temperature, increases<br />
30
31<br />
the water removing capacity <strong>of</strong> a coil.<br />
Lowering the refrigeration below the airs dew point in an existing evaporator coil to<br />
remove more water from the air or to increase water-removing capacity. This can be<br />
done by lowing the airflow or downsizing the coil but not increasing the coil size. The<br />
coolest refrigerant temperature is 34 degrees (no ice on the coil).<br />
It is possible to check the airflow <strong>of</strong> a Fan coil by knowing the air entering <strong>and</strong> the<br />
leaving air-dry bulb <strong>and</strong> well bulb temperature.<br />
Calculation <strong>of</strong> heat<br />
Calculation <strong>of</strong> heat movement from the air to the refrigerant is done by the loss <strong>of</strong> heat in<br />
the air. <strong>Air</strong> that enters the evaporator has heat. This heat is called the enthalpy <strong>of</strong> the air.<br />
Enthalpy <strong>of</strong> air is defined as the sum <strong>of</strong> the internal energy <strong>of</strong> the air. <strong>Air</strong> heat is called<br />
Enthalpy because it is a combination <strong>of</strong> sensible <strong>and</strong> latent heat. Sensible heat raises or<br />
lowers the temperature <strong>of</strong> the air. Latent heat adds or removes the water from the air.<br />
The formula for this heat movement is.<br />
<strong>Air</strong> Density X 60 X CFM X ∆ Enthalpy = BTUH<br />
The first part <strong>of</strong> this equation is the weight <strong>of</strong> the air in pounds <strong>of</strong> air per hour (air density<br />
X 60 X Cfm), the next part (∆ enthalpy) is the total heat removed per pound <strong>of</strong> air in<br />
enthalpy.<br />
Pounds <strong>of</strong> <strong>Air</strong> per hour = <strong>Air</strong> Density X 60 X CFM<br />
∆ Enthalpy = Enthalpy <strong>of</strong> the air into an evaporator (h1) - Enthalpy <strong>of</strong> the air <strong>of</strong> an evaporator (h2)<br />
The formula for CFM = BTUH / (<strong>Air</strong> density X 60 X ∆ Enthalpy)<br />
Btuh is the total heat that has been removed from the air. In a water system the total heat<br />
add to the water in a fan coil or a chiller is equal to<br />
Btuh = GPM X 60 X 8.337 X ∆ Temperature water<br />
31
32<br />
<strong>Air</strong> Density<br />
<strong>Air</strong> density is defined as the mass per unit volume <strong>of</strong> air. As the temperature <strong>of</strong> a given<br />
mass <strong>of</strong> air increases, its volume increases [i.e. thermal expansion] <strong>and</strong> its density<br />
decreases. As the temperature <strong>of</strong> a given mass <strong>of</strong> air decreases, its volume decreases<br />
<strong>and</strong> its density increases.<br />
100ºF dry bulb <strong>and</strong> 30% RH a 1lb <strong>of</strong> air is 14.4F³ a density <strong>of</strong> 0.0694<br />
62ºF dry bulb <strong>and</strong> 30% RH a 1lb <strong>of</strong> air is 13.2F³ a density <strong>of</strong> 0.0757<br />
As the relative humidity increases at a given temperature the given mass <strong>of</strong> air increases<br />
<strong>and</strong> it’s, volume increases <strong>and</strong> density decreases. As the relative humidity decreases at<br />
a given temperature, the given mass <strong>of</strong> air <strong>and</strong> volume decreases <strong>and</strong> its density<br />
increases.<br />
76ºF dry bulb <strong>and</strong> 100% RH a 1lb <strong>of</strong> air is 13.9F³ a density <strong>of</strong> 0.0719<br />
76°F dry bulb <strong>and</strong> 0% RH a 1lb <strong>of</strong> air is 13.5F³ a density <strong>of</strong> 0.0740<br />
The Foot³ for one pound <strong>of</strong> air must be located first before air density can be calculated<br />
using the formula. <strong>Air</strong> density is equal to one pound <strong>of</strong> air divided by the foot³ per pound<br />
<strong>of</strong> air (<strong>Air</strong> Density = 1lb / ft³). One pound <strong>of</strong> air changes its Foot³ with the dry <strong>and</strong> wet<br />
bulb (See Table 8A, 8B). The formula <strong>of</strong> total heat uses the air density <strong>of</strong> the air leaving<br />
the evaporator. To using, Table 8 A&B for ft³ <strong>and</strong> 9 A to C for air density.<br />
To use table 8:<br />
(1) Measure the dry bulb temperature with a digital thermometer <strong>of</strong> the air leaving the<br />
evaporator.<br />
(2) Measure the wet bulb (water vaporization temperature) temperature with a digital<br />
sling psychrometer <strong>of</strong> the air leaving the evaporator.<br />
(3) Find the measured indoor entering dry bulb temperature on the left side <strong>of</strong> the table<br />
<strong>and</strong> the wet bulb temperature on top line.<br />
(4) Where the lines cross is the Foot³. See table 8A & 8B<br />
(5) Divide the Foot³ by 1 pound for air density.<br />
See Table 9 <strong>and</strong> 9B & 9C for air density<br />
62ºF dry bulb <strong>and</strong> 46º wet bulb 1lb <strong>of</strong> air is 13.21F³ with a density <strong>of</strong> 0.0756<br />
Foot³ <strong>of</strong> one pound <strong>of</strong> air<br />
32
33<br />
Table 8A<br />
Dry Bulb on left, Wet Bulb on top<br />
70 68 66 64 62 60 58 56 54 52 50 48 46 44<br />
70 13.69 13.65 13.62 13.59 13.56 13.54 13.51 13.49 13.46 13.44 13.42 13.39 13.37 13.35<br />
69 13.63 13.60 13.57 13.54 13.52 13.49 13.46 13.44 13.42 13.39 13.37 13.35 13.33<br />
68 13.61 13.58 13.55 13.52 13.49 13.67 13.44 13.42 13.39 13.37 13.35 13.33 13.31<br />
67 13.56 13.53 13.50 13.47 13.45 13.42 13.40 13.78 13.35 13.33 13.31 13.29<br />
66 13.54 13.51 13.48 13.45 13.43 13.40 13.38 13.36 13.33 13.31 13.29 13.27<br />
65 13.49 13.46 13.43 13.41 13.38 13.36 13.33 13.31 13.29 13.27 13.25<br />
64 13.47 13.44 13.41 13.39 13.36 13.34 13.31 13.29 13.27 13.25 13.23<br />
63 13.42 13.39 13.37 13.34 13.32 13.29 13.27 13.25 13.23 13.21<br />
62 13.40 13.37 13.35 13.32 13.30 13.27 13.25 13.23 13.21 13.19<br />
61 13.35 13.32 13.30 13.28 13.25 13.23 13.21 13.19 13.17<br />
60 13.33 13.30 13.28 13.25 13.23 13.21 13.19 13.17 13.15<br />
Foot³ <strong>of</strong> one pound <strong>of</strong> air at 29.92”<br />
33
34<br />
Table 8B<br />
Dry Bulb on left, Wet Bulb on top<br />
34
35<br />
60 58 56 54 52 50 48 46 44 42 40 38 36 34<br />
65 13.43 13.40 13.38 13.35 13.33 13.31 13.29 13.27 13.25 13.23<br />
64 13.41 13.38 13.36 13.33 13.31 13.29 13.27 13.25 13.23 13.21<br />
63 13.39 13.36 13.34 13.31 13.29 13.27 13.25 13.23 13.21 13.19 13.17<br />
62 13.37 13.34 13.32 13.29 13.27 13.25 13.22 13.21 13.19 13.17 13.15<br />
61 13.35 13.32 13.29 13.27 13.25 13.23 13.21 13.19 13.17 13.15 13.13<br />
60 13.33 13.30 13.27 13.25 13.23 13.21 13.19 13.17 13.15 13.13 13.11<br />
59 13.28 13.25 13.23 13.21 13.19 13.17 13.15 13.13 13.11 13.09 13.08<br />
58 13.26 13.23 13.21 13.19 13.17 13.15 13.13 13.11 13.09 13.07 13.05<br />
57 13.21 13.19 13.17 13.15 13.13 13.11 13.09 13.07 13.05 13.03<br />
56 13.19 13.17 13.15 13.13 13.11 13.8 13.07 13.05 13.03 13.01<br />
55 13.15 13.13 13.11 13.08 13.06 13.04 13.03 13.01 12.99 12.97<br />
54 13.13 13.11 13.08 13.06 13.04 13.03 13.01 12.98 12.97 12.95<br />
53 13.08 13.06 13.04 13.03 13.00 12.98 12.97 12.95 12.93<br />
52 13.06 13.04 13.03 13.00 12.98 12.96 12.95 12.93 12.91 12.89<br />
51 13.02 13.00 12.98 12.96 12.95 12.93 12.91 12.89 12.87<br />
50 13.00 12.98 12.96 12.94 12.92 12.91 12.88 12.87 12.85<br />
49 12.96 12.94 12.92 12.90 12.88 12.87 12.85 12.83<br />
48 12.94 12.92 12.90 12.88 12.87 12.85 12.83 12.81<br />
47 12.90 12.88 12.86 12.84 12.83 12.81 12.79<br />
46 12.88 12.86 12.84 12.82 12.80 12.79 12.77<br />
45 12.84 12.82 12.80 12.78 12.77 12.75<br />
44 12.82 12.80 12.78 12.76 12.75 12.73<br />
43 12.78 12.76 12.74 12.73 12.71<br />
42 12.76 12.74 12.72 12.71 12.69<br />
41 12.72 12.70 12.69 12.67<br />
40 12.70 12.68 12.66 12.65<br />
39 12.66 12.64 12.63<br />
38 12.64 12.62 12.61<br />
37 12.60 12.59<br />
60 58 56 54 52 50 48 46 44 42 40 38 36 34<br />
Foot³ <strong>of</strong> one pound <strong>of</strong> air at 29.92”<br />
35
36<br />
Table 8A & 8B<br />
<strong>Air</strong> density change with altitudes table 9 is the correction for altitude<br />
Table 9<strong>Air</strong> Density at Altitudes<br />
36
37<br />
Foot³ per 1lb Altitude<br />
0 Feet<br />
Altitude<br />
1,000 Feet<br />
Altitude<br />
3,000 Feet<br />
37<br />
Altitude<br />
5,000 Feet<br />
Altitude<br />
7,000 Feet<br />
Altitude<br />
9,000 Feet<br />
12.0 0.08333 0.08033 0.07467 0.06933 0.06433 0.05958<br />
12.1 0.08264 0.07967 0.07405 0.06876 0.06380 0.05909<br />
12.2 0.08197 0.07902 0.07344 0.06820 0.06328 0.05861<br />
12.3 0.08130 0.07837 0.07285 0.06764 0.06276 0.05813<br />
12.4 0.08065 0.07774 0.07226 0.06710 0.06226 0.05766<br />
12.5 0.08000 0.07712 0.07168 0.06656 0.06176 0.05720<br />
12.6 0.07937 0.07651 0.07111 0.06603 0.06127 0.05675<br />
12.7 0.07874 0.07591 0.07055 0.06551 0.06079 0.05630<br />
12.8 0.07813 0.07531 0.07000 0.06500 0.06031 0.05586<br />
12.9 0.07752 0.07473 0.06946 0.06450 0.05984 0.05543<br />
13.0 0.07682 0.07415 0.06892 0.06400 0.05938 0.05500<br />
13.1 0.07634 0.07359 0.06840 0.06351 0.05893 0.05458<br />
13.2 0.07576 0.07303 0.06788 0.06303 0.05848 0.05417<br />
13.3 0.07519 0.07248 0.06737 0.06256 0.05805 0.05376<br />
13.4 0.07463 0.07194 0.06687 0.06209 0.05761 0.05336<br />
13.5 0.07407 0.07141 0.06637 0.06163 0.05719 0.05296<br />
13.6 0.07353 0.07088 0.06588 0.06118 0.05676 0.05257<br />
13.7 0.07299 0.07036 0.06540 0.06073 0.05635 0.05219<br />
13.8 0.07246 0.06986 0.06493 0.06029 0.05594 0.05181<br />
13.9 0.07194 0.06935 0.06446 0.05986 0.05554 0.05144<br />
14.0 0.07143 0.06886 0.06400 0.05943 0.05514 0.05107<br />
14.1 0.07092 0.06837 0.06355 0.05901 0.05475 0.05071<br />
14.2 0.07042 0.06789 0.06310 0.05859 0.05437 0.05035<br />
14.3 0.06993 0.06741 0.06266 0.05818 0.05399 0.05000<br />
14.4 0.06944 0.06694 0.06222 0.05778 0.05361 0.04965<br />
14.5 0.06897 0.06648 0.06179 0.05738 0.05324 0.04931<br />
14.6 0.06849 0.06603 0.06137 0.05699 0.05288 0.04897<br />
14.7 0.06803 0.06558 0.06095 0.05660 0.05252 0.04864<br />
14.8 0.06757 0.06514 0.06054 0.05622 0.05216 0.04831<br />
14.9 0.06711 0.06470 0.06013 0.05584 0.05181 0.04799<br />
15.0 0.06667 0.06427 0.05973 0.05547 0.05147 0.04767<br />
Foot³ per 1lb Altitude<br />
0 Feet<br />
Altitude<br />
1,000 Feet<br />
Altitude<br />
3,000 Feet<br />
Altitude<br />
5,000 Feet<br />
Altitude<br />
7,000 Feet<br />
Altitude<br />
9,000 Feet
38<br />
Table 9<br />
Altitude correction for Cu ft per 1 pound <strong>of</strong> <strong>Air</strong>: Cu ft per 1 pound <strong>of</strong> <strong>Air</strong> / Altitude Ratio<br />
Altitude correction for <strong>Air</strong> density is: <strong>Air</strong> density X Altitude Ratio<br />
Table 9 B<br />
<strong>Air</strong> Density at 29.92”<br />
Dry Bulb on left, Wet Bulb on top<br />
70 68 66 64 62 60 58 56 54 52 50 48 46 44<br />
70 0.0731 0.0732 0.0734 0.0736 0.0737 0.0738 0.0739 0.0741 0.0743 0.0744 0.0745 0.0747 0.0748 0.0749<br />
69 0.0733 0.0735 0.0736 0.0738 0.0739 0.0741 0.0743 0.0744 0.0745 0.0747 0.0748 0.0749 0.0750<br />
68 0.0735 0.0736 0.0737 0.0739 0.0741 0.0743 0.0744 0.0745 0.0747 0.0748 0.0749 0.0750 0.0751<br />
67 0.0737 0.0738 0.0740 0.0742 0.0744 0.0745 0.0746 0.0748 0.0749 0.0750 0.0751 0.0752<br />
66 0.0738 0.0739 0.0742 0.0743 0.0745 0.0746 0.0747 0.0749 0.0750 0.0751 0.0752 0.0754<br />
65 0.0741 0.0743 0.0744 0.0746 0.0747 0.0749 0.0750 0.0751 0.0752 0.0753 0.0754<br />
64 0.0743 0.0744 0.0745 0.0747 0.0748 0.0750 0.0751 0.0752 0.0753 0.0754 0.0755<br />
63 0.0745 0.0746 0.0748 0.0749 0.0751 0.0752 0.0753 0.0754 0.0755 0.0757<br />
62 0.0746 0.0747 0.0749 0.0751 0.0752 0.0753 0.0754 0.0755 0.0757 0.0758<br />
61 0.0748 0.0751 0.0752 0.0753 0.0754 0.0755 0.0757 0.0758 0.0759<br />
60 0.0750 0.0752 0.0753 0.0754 0.0755 0.0757 0.0758 0.0759 0.0760<br />
38
39<br />
Table 9 C <strong>Air</strong> Density at 29.29”<br />
Dry Bulb on left, Wet Bulb on top<br />
60 58 56 54 52 50 48 46 44 42 40 38 36 34<br />
65 0.0744 0.0746 0.0747 0.0749 0.0750 0.0751 0.0752 0.0753 0.0754 0.0755<br />
64 0.0745 0.0747 0.0748 0.0750 0.0751 0.0752 0.0753 0.0754 0.0755 0.0757<br />
63 0.0746 0.0748 0.0749 0.0751 0.0752 0.0753 0.0754 0.0755 0.0757 0.0758 0.0759<br />
62 0.0747 0.0749 0.0751 0.0752 0.0753 0.0754 0.0755 0.0757 0.0758 0.0759 0.0760<br />
61 0.0748 0.0751 0.0752 0.0753 0.0754 0.0755 0.0757 0.0758 0.0759 0.0760 0.0762<br />
60 0.0750 0.0752 0.0753 0.0754 0.0755 0.0757 0.0758 0.0759 0.0760 0.0762 0.0763<br />
59 0.0753 0.0754 0.0755 0.0757 0.0758 0.0759 0.0760 0.0762 0.0763 0.0764 0.0765<br />
58 0.0754 0.0755 0.0757 0.0758 0.0759 0.0760 0.0762 0.0763 0.0764 0.0765 0.0767<br />
57 0.0757 0.0758 0.0759 0.0760 0.0762 0.0763 0.0764 0.0765 0.0767 0.0768<br />
56 0.0758 0.0759 0.0760 0.0762 0.0763 0.0764 0.0765 0.0767 0.0768 0.0769<br />
55 0.0760 0.0762 0.0763 0.0764 0.0765 0.0767 0.0768 0.0769 0.0770 0.0771<br />
54 0.0762 0.0763 0.0764 0.0765 0.0767 0.0768 0.0769 0.0770 0.0771 0.0772<br />
53 0.0764 0.0765<br />
0.0767<br />
39<br />
0.0768 0.0769 0.0770 0.0771 0.0772 0.0774<br />
52 0.0765 0.0767 0.0768 0.0769 0.0770 0.0771 0.0772 0.0774 0.0775 0.0776<br />
51 0.0768 0.0769 0.0770 0.0771 0.0772 0.0774 0.0775 0.0776 0.0777<br />
50 0.0769 0.0770 0.0771 0.0772 0.0774 0.0775 0.0776 0.0777 0.0779<br />
49 0.0771 0.0772 0.0774 0.0775 0.0776 0.0777 0.0779 0.0780<br />
48 0.0772 0.0774 0.0775 0.0776 0.0777 0.0779 0.0780 0.0781<br />
47 0.0775 0.0776 0.0778 0.0779 0.0780 0.0781 0.0782<br />
46 0.0776 0.0778 0.0779 0.0780 0.0781 0.0782 0.0783<br />
45 0.0779 0.0780 0.0781 0.0782 0.0783 0.0784<br />
44 0.0780 0.0781 0.0782 0.0784 0.0785 0.0786<br />
43 0.0782 0.0784 0.0785 0.0786 0.0787<br />
42 0.0784 0.0785 0.0786 0.0787 0.0788<br />
41 0.0786 0.0787 0.0789 0.0790<br />
40 0.0787 0.0789 0.0790 0.0791<br />
39 0.0790 0.0791 0.0792<br />
38 0.0791 0.0792 0.0793<br />
37 0.0793 0.0794
40<br />
Enthalpy<br />
(H1-H2)<br />
Enthalpy <strong>of</strong> air is defined as the sum <strong>of</strong> the internal energy <strong>of</strong> the air. <strong>Air</strong> heat is called<br />
Enthalpy because it is a combination <strong>of</strong> sensible <strong>and</strong> latent heat. Sensible<br />
heat raises or lowers the temperature <strong>of</strong> the air. Latent heat adds or removes the water<br />
from the air.<br />
The air that enters an evaporator has heat <strong>and</strong> that heat can be measured by the wet<br />
bulb temperature. Wet bulb is a good indication <strong>of</strong> the total heat <strong>of</strong> the air the enthalpy.<br />
• <strong>Air</strong> at 67ºF dry bulb <strong>and</strong> 67ºF wet bulb has an enthalpy <strong>of</strong> 31.62.<br />
• <strong>Air</strong> at 70ºF dry bulb <strong>and</strong> 67ºF wet bulb has an enthalpy <strong>of</strong> 31.59.<br />
• <strong>Air</strong> at 80ºF dry bulb <strong>and</strong> 67ºF wet bulb has an enthalpy <strong>of</strong> 31.51.<br />
• <strong>Air</strong> at 90ºF dry bulb <strong>and</strong> 67ºF wet bulb has an enthalpy <strong>of</strong> 31.43.<br />
When calculating the total heat that an evaporator has removed from the air the wet bulb<br />
is taken from the air going in <strong>and</strong> out <strong>of</strong> the evaporator (∆ enthalpy (h1-h2)).<br />
Example 5: using table 11<br />
• <strong>Air</strong> going in to an evaporator coil at 80ºF dry bulb <strong>and</strong> 67ºF wet bulb has an enthalpy <strong>of</strong><br />
31.62.<br />
• <strong>Air</strong> coming out <strong>of</strong> an evaporator coil at 62ºF dry bulb <strong>and</strong> 57ºF wet bulb has an enthalpy<br />
<strong>of</strong> 24.48.The ∆ enthalpy (h1-h2) is 31.62-24.48= 7.14 ∆ enthalpy.<br />
Table 11<br />
Enthalpy at saturation, Btu per pound <strong>of</strong> dry air at 29.92”<br />
40
41<br />
41<br />
Wet-Bulb (F) .0 .1 .2 .3 .4 .5 .6 .7 .8 .9 Wet-Bulb (F)<br />
30<br />
31<br />
32<br />
33<br />
34<br />
10.92<br />
11.33<br />
11.76<br />
12.17<br />
12.59<br />
10.96<br />
11.37<br />
11.80<br />
12.21<br />
12.63<br />
11.00<br />
11.41<br />
11.84<br />
12.25<br />
12.67<br />
11.04<br />
11.45<br />
11.88<br />
12.29<br />
12.71<br />
11.08<br />
11.49<br />
11.92<br />
12.33<br />
12.75<br />
11.12<br />
11.53<br />
11.96<br />
12.38<br />
12.80<br />
11.16<br />
11.57<br />
12.00<br />
12.42<br />
12.84<br />
11.20<br />
11.61<br />
12.04<br />
12.46<br />
12.88<br />
11.24<br />
11.65<br />
12.08<br />
12.50<br />
12.92<br />
11.29<br />
11.70<br />
12.12<br />
12.54<br />
12.97<br />
30<br />
31<br />
32<br />
33<br />
34<br />
35<br />
36<br />
37<br />
38<br />
39<br />
13.01<br />
13.44<br />
13.87<br />
14.32<br />
14.77<br />
13.05<br />
13.48<br />
13.92<br />
14.36<br />
14.82<br />
13.09<br />
13.53<br />
13.96<br />
14.41<br />
14.86<br />
13.14<br />
13.57<br />
14.01<br />
14.45<br />
14.91<br />
13.18<br />
13.61<br />
14.05<br />
14.50<br />
14.96<br />
13.22<br />
13.66<br />
14.10<br />
14.54<br />
15.00<br />
13.27<br />
13.70<br />
14.14<br />
14.59<br />
15.05<br />
13.31<br />
13.74<br />
14.19<br />
14.64<br />
15.09<br />
13.35<br />
13.79<br />
14.23<br />
14.68<br />
15.14<br />
13.40<br />
13.83<br />
14.28<br />
14.73<br />
15.18<br />
35<br />
36<br />
37<br />
38<br />
39<br />
40<br />
41<br />
42<br />
43<br />
44<br />
15.23<br />
15.70<br />
16.17<br />
16.66<br />
17.15<br />
15.28<br />
15.75<br />
16.22<br />
16.71<br />
17.20<br />
15.32<br />
15.80<br />
16.27<br />
16.76<br />
17.25<br />
15.37<br />
15.84<br />
16.32<br />
16.80<br />
17.30<br />
15.42<br />
15.89<br />
16.32<br />
16.80<br />
17.30<br />
15.47<br />
15.94<br />
16.42<br />
16.90<br />
17.40<br />
15.51<br />
15.99<br />
16.46<br />
16.95<br />
17.45<br />
15.56<br />
16.04<br />
16.51<br />
17.00<br />
17.50<br />
15.61<br />
16.08<br />
16.56<br />
17.05<br />
17.55<br />
15.65<br />
16.13<br />
16.61<br />
17.10<br />
17.60<br />
40<br />
41<br />
42<br />
43<br />
44<br />
45<br />
46<br />
47<br />
48<br />
49<br />
17.65<br />
18.16<br />
18.68<br />
19.21<br />
19.75<br />
17.70<br />
18.21<br />
18.73<br />
19.26<br />
19.81<br />
17.75<br />
18.26<br />
18.79<br />
19.32<br />
19.86<br />
17.80<br />
18.32<br />
18.84<br />
19.37<br />
19.92<br />
17.85<br />
18.37<br />
18.89<br />
19.43<br />
19.97<br />
17.91<br />
18.42<br />
18.95<br />
19.48<br />
20.03<br />
17.96<br />
18.47<br />
19.00<br />
19.53<br />
20.08<br />
18.01<br />
18.52<br />
19.05<br />
19.59<br />
20.14<br />
18.06<br />
18.58<br />
19.10<br />
19.64<br />
20.19<br />
18.11<br />
18.63<br />
19.16<br />
19.70<br />
20.25<br />
45<br />
46<br />
47<br />
48<br />
49<br />
50<br />
51<br />
52<br />
53<br />
54<br />
20.30<br />
20.86<br />
21.44<br />
22.02<br />
22.62<br />
20.36<br />
20.92<br />
21.49<br />
22.08<br />
22.68<br />
20.41<br />
20.98<br />
21.55<br />
22.14<br />
22.74<br />
20.47<br />
21.03<br />
21.61<br />
22.20<br />
22.80<br />
20.53<br />
21.09<br />
21.67<br />
22.26<br />
22.86<br />
20.58<br />
21.15<br />
21.73<br />
22.32<br />
22.92<br />
20.64<br />
21.21<br />
21.78<br />
22.38<br />
22.98<br />
20.69<br />
21.26<br />
21.84<br />
22.44<br />
23.04<br />
20.75<br />
21.32<br />
21.90<br />
22.50<br />
23.10<br />
20.81<br />
21.38<br />
21.96<br />
22.56<br />
23.16<br />
50<br />
51<br />
52<br />
53<br />
54<br />
55<br />
56<br />
57<br />
58<br />
59<br />
23.22<br />
23.84<br />
24.48<br />
25.12<br />
25.78<br />
23.28<br />
23.90<br />
24.54<br />
25.19<br />
25.85<br />
23.34<br />
23.97<br />
24.61<br />
25.25<br />
25.92<br />
23.41<br />
24.03<br />
24.67<br />
25.32<br />
25.98<br />
23.47<br />
24.10<br />
24.74<br />
25.38<br />
26.05<br />
23.53<br />
24.16<br />
24.80<br />
25.45<br />
26.12<br />
23.59<br />
24.22<br />
24.86<br />
25.52<br />
26.19<br />
23.65<br />
24.29<br />
24.93<br />
25.58<br />
26.26<br />
23.72<br />
24.35<br />
24.99<br />
25.65<br />
26.32<br />
23.78<br />
24.42<br />
25.06<br />
25.71<br />
26.39<br />
55<br />
56<br />
57<br />
58<br />
59<br />
60<br />
61<br />
62<br />
63<br />
64<br />
26.46<br />
27.15<br />
27.85<br />
28.57<br />
29.31<br />
26.53<br />
27.22<br />
27.92<br />
28.64<br />
29.39<br />
26.60<br />
27.29<br />
27.99<br />
28.72<br />
29.46<br />
26.67<br />
27.36<br />
28.07<br />
28.79<br />
29.54<br />
26.74<br />
27.43<br />
28.14<br />
28.87<br />
29.61<br />
26.81<br />
27.50<br />
28.21<br />
28.94<br />
29.62<br />
26.87<br />
27.57<br />
28.28<br />
29.01<br />
29.76<br />
26.94<br />
27.64<br />
28.35<br />
29.09<br />
29.83<br />
27.01<br />
27.70<br />
28.43<br />
29.16<br />
29.91<br />
27.08<br />
27.78<br />
28.50<br />
29.24<br />
29.98<br />
60<br />
61<br />
62<br />
63<br />
64<br />
65<br />
66<br />
67<br />
68<br />
69<br />
30.06<br />
30.83<br />
31.62<br />
32.42<br />
33.25<br />
30.14<br />
30.91<br />
31.70<br />
32.50<br />
33.33<br />
30.21<br />
30.99<br />
31.78<br />
32.59<br />
33.42<br />
30.29<br />
31.07<br />
31.86<br />
32.67<br />
33.50<br />
30.37<br />
31.15<br />
31.94<br />
32.75<br />
33.59<br />
30.45<br />
31.23<br />
32.02<br />
32.84<br />
33.67<br />
30.52<br />
31.30<br />
32.10<br />
32.92<br />
33.75<br />
30.60<br />
31.38<br />
32.18<br />
33.00<br />
33.84<br />
30.68<br />
31.46<br />
32.26<br />
33.08<br />
33.92<br />
30.75<br />
31.54<br />
32.34<br />
33.17<br />
34.01<br />
65<br />
66<br />
67<br />
68<br />
69<br />
70<br />
71<br />
72<br />
73<br />
74<br />
34.09<br />
34.95<br />
35.83<br />
36.74<br />
37.66<br />
34.18<br />
35.04<br />
35.92<br />
36.83<br />
37.76<br />
34.26<br />
35.13<br />
36.01<br />
36.92<br />
37.85<br />
34.35<br />
35.21<br />
36.10<br />
37.02<br />
37.95<br />
34.43<br />
35.30<br />
36.19<br />
37.11<br />
38.04<br />
34.52<br />
35.39<br />
36.28<br />
37.20<br />
38.14<br />
34.61<br />
35.48<br />
36.38<br />
37.29<br />
38.23<br />
34.69<br />
35.57<br />
36.47<br />
37.38<br />
38.33<br />
34.78<br />
35.65<br />
36.56<br />
37.48<br />
38.42<br />
34.86<br />
35.74<br />
36.65<br />
37.57<br />
38.51<br />
70<br />
71<br />
72<br />
73<br />
74<br />
75<br />
76<br />
38.61<br />
39.57<br />
38.71<br />
39.67<br />
38.80<br />
39.77<br />
38.90<br />
39.87<br />
39.00<br />
39.97<br />
39.09<br />
40.07<br />
39.19<br />
40.17<br />
39.28<br />
40.27<br />
39.38<br />
40.37<br />
39.47<br />
40.47<br />
75<br />
76
42<br />
To use Table 11:<br />
1. Using a digital sling psychrometer or a sling psychrometer <strong>and</strong>; familiarize yourself<br />
with its operation.<br />
2. Wet the bulb with distilled water for a sling psychrometer; obtain the wet bulb <strong>and</strong> dry<br />
bulb reading <strong>of</strong> the air going into the fan coil. Leave the psychrometer in the air until the<br />
wet bulb stops moving (this may take 5 minutes).<br />
Wet bulb temperature_____________°F<br />
Dry bulb temperature ºF<br />
3. Using a digital sling psychrometer or the sling psychrometer obtain the wet bulb <strong>and</strong><br />
dry bulb reading <strong>of</strong> the air coming out <strong>of</strong> the fan coil. Leave the psychrometer in the air<br />
until the wet bulb stops moving (this may take 5minutes).<br />
Wet bulb temperature _____________°F<br />
Dry bulb temperature ºF<br />
4. Using the wet bulb temperature find the enthalpy <strong>of</strong> the air that is going in <strong>and</strong> out <strong>of</strong><br />
the evaporator (table 11) or with the wet <strong>and</strong> dry bulb temperature use (Table 11B, C or D)<br />
to find the enthalpy.<br />
Enthalpy air in ____________ EP<br />
Enthalpy air out ____________ EP<br />
Difference in EP _____________∆EP<br />
Table 11B, 11C <strong>and</strong> 11D are Enthalpy <strong>of</strong> air at different dry bulb temperature<br />
42
43<br />
Table 11A<br />
Enthalpy at saturation, Btu per pound <strong>of</strong> dry air at 29.92”<br />
Dry Bulb on left, Wet Bulb on top<br />
100 98 96 95 94 93 92 91 90 89 88 87 86 85 84<br />
100 71.76 68.23 64.87 63.26 61.69 60.16 58.67 57.22 55.80 54.42 53.08 51.76 50.49 49.24 48.03<br />
98 68.26 64.90 63.29 61.72 60.19 58.70 57.25 55.83 54.45 53.11 51.79 50.52 49.27 48.05<br />
96 64.94 63.32 61.75 60.22 58.73 57.28 55.86 54.48 53.13 51.82 50.54 49.29 48.08<br />
94 61.78 60.25 58.76 57.31 55.89 54.51 53.16 51.85 50.57 49.32 48.11<br />
92 58.79 57.38 55.92 54.54 53.19 51.88 50.59 49.35 48.13<br />
90 55.94 54.56 53.22 51.90 50.62 49.37 48.15<br />
88 53.24 51.93 50.65 49.40 48.18<br />
86 50.67 49.42 48.20<br />
84 48.22<br />
43
44<br />
Dry Bulb on left, Wet Bulb on top<br />
Table 11 B<br />
Enthalpy at saturation, Btu per pound <strong>of</strong> dry air at 29.92”<br />
Dry Bulb on left, Wet Bulb on top<br />
83 82 81 80 79 78 77 76 75 74 73 72 71 70<br />
94 46.91 45.76 44.63 43.53 42.45 41.41 40.38 39.38 38.41 37.46 36.52 35.62 34.73 33.87<br />
92 46.94 45.79 44.65 43.55 42.48 41.43 40.41 39.41 38.43 37.48 36.54 35.64 34.75 33.88<br />
90 46.97 45.81 44.68 43.58 42.50 41.45 40.43 39.43 38.45 37.50 36.57 35.66 34.77 33.90<br />
88 46.99 45.83 44.69 43.60 42.52 41.47 40.45 39.46 38.47 37.52 36.59 35.68 34.79 33.92<br />
86 47.02 45.86 44.72 43.62 42.55 41.50 40.47 39.48 38.49 37.54 36.61 35.70 34.81 33.94<br />
Enthalpy at saturation, Btu per pound <strong>of</strong> dry air at 29.92”<br />
Enthalpy at saturation, Btu per pound <strong>of</strong> dry air at 29.92”<br />
Dry Bulb on left, Wet Bulb on top<br />
84 83 82 81 80 79 78 77 76 75 74 73 72 71 70<br />
86 48.20 47.02 45.86 44.73 43.62 42.55 41.50 40.47 39.47 38.49 37.54 36.61 35.70 34.81 33.94<br />
84 48.23 47.04 45.88 44.75 43.65 42.57 41.52 40.49 39.49 38.51 37.56 36.63 35.72 34.83 33.96<br />
82 45.90 44.77 43.67 42.59 41.54 40.51 39.51 38.53 37.58 36.65 35.74 34.85 33.98<br />
80 43.69 42.62 41.56 40.54 39.53 38.55 37.60 36.67 35.76 34.87 34.00<br />
78 41.58 40.56 39.55 38.57 37.62 36.69 35.77 34.88 34.02<br />
76 39.57 38.59 37.64 36.71 35.79 34.90 34.03<br />
74 37.66 36.72 35.81 34.92 34.05<br />
72 35.83 34.94 34.07<br />
70 34.09<br />
44
45<br />
Table 11 C<br />
Enthalpy at saturation, Btu per pound <strong>of</strong> dry air at 29.29”<br />
Dry Bulb on left, Wet Bulb on top<br />
69 68 67 66 65 64 63 62 61 60 59 58 57 56<br />
86 33.10 32.27 31.46 30.67 29.90 29.14 28.40 27.68 26.98 26.29 25.61 24.95 24.31 23.67<br />
84 33.11 32.29 31.48 30.69 29.91 29.16 28.42 27.70 26.99 26.30 25.62 24.96 24.32 23.68<br />
82 33.13 32.30 31.49 30.70 29.93 29.17 28.43 27.71 27.00 26.31 25.64 24.98 24.33 23.70<br />
80 33.15 32.32 31.51 30.72 29.94 29.19 28.45 27.73 27.02 26.33 25.65 24.99 24.34 23.71<br />
78 33.17 32.34 31.53 30.73 29.96 29.20 28.46 27.74 27.03 26.34 25.66 25.00 24.35 23.72<br />
76 33.18 32.35 31.54 30.75 29.98 29.22 28.48 27.75 27.05 26.35 25.68 25.01 24.37 23.73<br />
74 33.20 32.37 31.56 30.77 29.99 29.23 28.49 27.77 27.06 26.37 25.69 25.03 24.38 23.74<br />
72 33.22 32.39 31.58 30.78 30.01 29.25 28.51 27.78 27.07 26.38 25.70 25.04 24.39 23.75<br />
70 33.24 32.41 31.59 30.80 30.02 29.26 28.52 27.80 27.09 26.39 25.71 25.05 24.40 23.76<br />
68 32.42 31.61 30.81 30.04 29.28 28.54 27.81 27.10 26.41 25.73 25.06 24.41 23.78<br />
66 30.83 30.06 29.30 28.55 27.82 27.11 26.42 25.74 25.07 24.42 23.79<br />
64 29.31 28.57 27.84 27.13 26.43 25.75 25.09 24.44 23.80<br />
62 27.85 27.14 26.45 25.76 25.10 24.45 23.81<br />
60 26.46 25.78 25.11 24.46 23.82<br />
45
46<br />
Table 11 D<br />
Enthalpy at saturation, Btu per pound <strong>of</strong> dry air at 29.92”<br />
Dry Bulb on left, Wet Bulb on top<br />
58 57 56 55 54 53 52 51 50 49 48 47 46 45<br />
68 25.06 24.41 23.78 23.15 22.54 21.94 21.36 20.78 20.21 19.66 19.12 18.61 18.09 17.58<br />
66 25.07 24.42 23.79 23.16 22.55 21.95 21.37 20.79 20.22 19.67 19.13 18.62 18.10 17.59<br />
64 25.09 24.44 23.80 23.17 22.57 21.96 21.38 20.80 20.23 19.68 19.14 18.63 18.11 17.59<br />
62 25.10 24.45 23.81 23.18 22.58 21.97 21.39 20.81 20.24 19.69 19.15 18.64 18.12 17.60<br />
60 25.11 24.46 23.82 23.19 22.59 21.98 21.40 20.82 20.25 19.70 19.16 18.64 18.13 17.60<br />
58 25.12 24.47 23.83 23.20 22.60 21.99 21.41 20.83 20.26 19.71 19.17 18.65 18.13 17.61<br />
56 23.84 23.21 22.61 22.00 21.42 20.84 20.27 19.72 19.18 18.65 18.14 17.61<br />
54 22.62 22.01 21.43 20.85 20.28 19.73 19.18 18.66 18.14 17.62<br />
52 21.44 20.86 20.29 19.74 19.19 18.66 18.15 17.62<br />
50 20.30 19.75 19.21 18.67 18.15 17.63<br />
48 19.21 18.67 18.16 17.63<br />
46 18.16 17.64<br />
To calculate the total heat removed from air that has gone through an<br />
evaporator<br />
Use a digital sling psychrometer or a sling psychrometer <strong>and</strong>; familiarize yourself with its<br />
operation.<br />
(1) Wet the bulb with distilled water for a sling psychrometer; obtain the wet bulb <strong>and</strong> dry<br />
bulb reading <strong>of</strong> the air going into the fan coil. Leave the psychrometer in the air until the<br />
wet bulb stops moving (this may take 5 minutes or more).<br />
Wet bulb temperature_____________°F<br />
Dry bulb temperature _____________°F<br />
(2) Using a digital sling psychrometer or the sling psychrometer obtain the wet<br />
bulb <strong>and</strong> dry bulb reading <strong>of</strong> the air coming out <strong>of</strong> the fan coil. Leave the psychrometer in<br />
the air until the wet bulb stops moving (this may take 5 minutes).<br />
46
47<br />
Wet bulb temperature_____________°F<br />
Dry bulb temperature _____________°F<br />
(3) On Table 8 A&B find, the Foot³ <strong>of</strong> the leaving air <strong>of</strong> the evaporate.<br />
(4) Divide the Foot³ by one pound <strong>of</strong> air; this is the air density <strong>of</strong> the air. <strong>Air</strong><br />
density_____________________ or use Table 9B or 9C for air density<br />
(5) Find the CFM <strong>of</strong> the system<br />
CFM_______________________<br />
(6) Using the Wet bulb find the enthalpy <strong>of</strong> the air that is going in <strong>and</strong> out <strong>of</strong> the<br />
evaporator Tables 11<br />
Enthalpy air in ____________ EP<br />
Enthalpy air out ____________ EP<br />
Difference in EP _____________∆EP<br />
(7) Run the formula; <strong>Air</strong> Density X 60 X CFM X ∆EP = BTUH<br />
Example 6: Find the total heat that <strong>of</strong> a evaporator fan coil is absorbing from air with 4050<br />
cfm <strong>and</strong> entering air <strong>of</strong> 76º dry bulb <strong>and</strong> 64ºwet bulb, leaving air <strong>of</strong> 58ºdry bulb <strong>and</strong> 54ºwet<br />
bulb.<br />
Solution<br />
76º dry bulb <strong>and</strong> 66ºwet bulb has a enthalpy <strong>of</strong> 30.75<br />
58ºdry bulb <strong>and</strong> 54ºwet bulb has a enthalpy <strong>of</strong> 22.60 <strong>and</strong> a air density <strong>of</strong> 0.0757<br />
<strong>Air</strong> density X 60 X cfm X ∆ enthalpy = Btuh<br />
0.0757 X 60 X 4050 X 8.15 = 149,920 Btuh<br />
Example 7: Find the airflow <strong>and</strong> velocity fpm <strong>of</strong> a fan coil with a duct <strong>of</strong> 48 X 36 <strong>and</strong> a 75<br />
gpm with an entering water <strong>of</strong> 45º <strong>and</strong> a leaving water 56º. On the airside, the entering air<br />
temperature is 78º dry bulb <strong>and</strong> 65º wet bulb with a leaving air temperature <strong>of</strong> 60º dry<br />
bulb <strong>and</strong> 56º wet bulb.<br />
Solution<br />
Btuh = gpm X 60 X 8.337 X ∆ Temperature water<br />
Cfm = Btuh / (air density X 60 X ∆ enthalpy (h1-h2)<br />
47
48<br />
Velocity fpm = airflow cfm / area in ft²<br />
<strong>Air</strong> density <strong>of</strong> leaving air 60º dry bulb 56º wet bulb = 0.0753<br />
Enthalpy <strong>of</strong> entering air <strong>of</strong> 78º dry bulb 65º wet bulb = 29.96<br />
Enthalpy <strong>of</strong> leaving air <strong>of</strong> 60º dry bulb 56º dry bulb = 23.82<br />
Area in in² to ft² <strong>of</strong> a 48” X 36” duct: 48” X 36”= 1728 in² / 144 = 12 ft²<br />
75 gpm X 60 X 8.337 X 11º∆ Temperature = 412,681 Btuh<br />
412,681btuh / (air density 0.0753 X 60 X [(h1) 29.96 – (h2) 23.82] = 14,876 cfm<br />
14,876 cfm / 12 ft² = 1239 fpm<br />
Kitchen Ventilation<br />
<strong>Air</strong> <strong>Balancing</strong><br />
<strong>Balancing</strong> is best performed when the manufacturers <strong>of</strong> all the equipment can provide a<br />
certified reference method <strong>of</strong> measuring the airflows, rather than depending on generic<br />
measurements <strong>of</strong> duct flows or other forms <strong>of</strong> measurement in the field, which can be in<br />
error by 20% or more. The equipment manufacturer should be able to develop a reference<br />
method <strong>of</strong> measuring airflow in a portion <strong>of</strong> the equipment that is dynamically stable in<br />
the laboratory as well as in the field. This method should relate directly to airflow by<br />
graph or formula.<br />
The general steps for air balancing in restaurants are as follows:<br />
1. Exhaust hoods should be set to their proper flow rates, with supply <strong>and</strong> exhaust fans<br />
on.<br />
2. Next, supply airflow rate, whether part <strong>of</strong> combined HVAC units or separate<br />
replacement air units, should be set to design values through the coils <strong>and</strong> the design<br />
supply flows from each outlet, with approximately correct settings on the outside airflow<br />
rate. Then, correct outside <strong>and</strong> return airflow rates should be set proportionately for each<br />
unit, as applicable. These settings should be made with exhaust on, to ensure adequate<br />
relief for the outside air. Where outside air <strong>and</strong> return air flows <strong>of</strong> a particular unit are<br />
expected to modulate, there should ideally be similar static losses through both airflow<br />
paths to preclude large changes in total supply air from the unit. Such changes, if large<br />
enough, could affect the efficiency <strong>of</strong> heat exchange <strong>and</strong> could change airflows within<br />
<strong>and</strong> between zones, thereby upsetting air distribution <strong>and</strong> balance.<br />
3. Next, outside air should be set with all fans (exhaust <strong>and</strong> supply) operating. Pressure<br />
difference between inside <strong>and</strong> outside should be checked to see that (1) non kitchen<br />
zones <strong>of</strong> the building are at a positive pressure compared to outside <strong>and</strong> (2) kitchen zone<br />
pressure is negative compared to the surrounding zones <strong>and</strong> negative or neutral<br />
compared to outside. For applications with modulating exhaust, every step <strong>of</strong> exhaust<br />
48
49<br />
<strong>and</strong> replacement should be shut <strong>of</strong>f, one-step at a time. Each combination <strong>of</strong> operation<br />
should be rechecked to ensure that design pressures <strong>and</strong> flows are maintained in each<br />
zone <strong>and</strong> between zones. This requires that the replacement airflow rate compensate<br />
automatically with each increment <strong>of</strong> exhaust. It may require some adjustments in<br />
controls or in damper linkage settings to get the correct proportional response.<br />
4. When the preceding steps are complete, the system is properly integrated <strong>and</strong><br />
balanced. At this time, all fan speeds <strong>and</strong> damper settings (at all modes <strong>of</strong> operation)<br />
should be permanently marked on the equipment <strong>and</strong> in the test <strong>and</strong> balance report. <strong>Air</strong><br />
balance records <strong>of</strong> exhaust, supply, return, fresh air, <strong>and</strong> individual register airflows<br />
must also be completed. These records should be kept by the food service facility for<br />
future reference.<br />
5. For new facilities, after two or three days in operation (no longer than a week <strong>and</strong><br />
usually before the facility opens), all belts in the system should be checked <strong>and</strong><br />
readjusted because new belts wear in quickly <strong>and</strong> could begin slipping.<br />
6. Once the facility is operational, the performance <strong>of</strong> the ventilation system should be<br />
checked to verify that the design is adequate for actual operation, particularly at<br />
maximum cooking <strong>and</strong> at outside environmental extremes. Any necessary changes<br />
should be made, <strong>and</strong> all the records should be updated to show the changes.<br />
Rechecking the air balance should not be necessary more than once every 2 years<br />
unless basic changes are made in facility operation. If there are any changes, such as<br />
adding a new type <strong>of</strong> cooking equipment or deleting exhaust connections, the system<br />
should be modified accordingly.<br />
SYSTEMS PRINCIPLES AND PROCEDURES FOR<br />
Multiple-Hood <strong>System</strong>s<br />
Kitchens exhaust systems serving more than a single hood present several design<br />
challenges not encountered with single-hood systems. One <strong>of</strong> the main challenges <strong>of</strong><br />
multiple-hood exhaust systems is air balancing. Because balancing dampers are not<br />
permitted in the exhaust ducts, the system must be balanced by design. Zoning may be<br />
desirable for a balanced design <strong>and</strong> to improve energy conservation. Hood accessories<br />
are now available to allow balancing at individual hoods. Additionally, most filters come<br />
in varying sizes to allow pressure loss equalization at varying airflows. Some hoods <strong>and</strong><br />
grease filters have adjustable baffles that allow airflow to be adjusted at the hood. These<br />
may be helpful for relatively fine balancing, but the system must provide most <strong>of</strong> the<br />
balancing. <strong>System</strong> zoning is preferred, because incorrect installation <strong>of</strong> a multi branch<br />
system can lead to complex problems. Adjustable filters should not be used when they<br />
can be interchanged between hoods or within the same hood because an interchange<br />
could disrupt the previously achieved balance. <strong>Balancing</strong> can also be accomplished by<br />
changing the number <strong>and</strong>/or size <strong>of</strong> filters.<br />
For correct flow through a branch duct in a multiple-hood system, the static pressure<br />
loss <strong>of</strong> the branch must match the static pressure loss <strong>of</strong> the common duct upstream<br />
from the point <strong>of</strong> connection. Any exhaust points subsequently added or removed must<br />
be designed to comply with the minimum velocities required by code <strong>and</strong> to maintain the<br />
49
50<br />
balance <strong>of</strong> the remaining system. In cases such as master kitchen-exhaust systems,<br />
which are sometimes used in shopping center food courts, no single group is<br />
responsible for the entire design. The base building designer typically lays out ductwork<br />
to (or through) each tenant space <strong>and</strong> each tenant selects a hood <strong>and</strong> lays out<br />
connecting ductwork. Often the base building designer has incomplete information on<br />
tenant exhaust requirements. Therefore, one engineer must be responsible for defining<br />
criteria for each tenant’s design <strong>and</strong> for evaluating proposed tenant work to ensure that<br />
tenant designs match the system’s capacity. The engineer should also evaluate any<br />
proposed changes to the system, such as changing tenancy. Rudimentary computer<br />
modeling <strong>of</strong> the exhaust system may be helpful (Elovitz 1992). Given the unpredictability<br />
<strong>and</strong> volatility <strong>of</strong> tenant requirements, it may not be possible to balance the entire system<br />
perfectly. However, without adequate supervision, the probability that at least part <strong>of</strong> the<br />
system will be badly out <strong>of</strong> balance is very high.<br />
For greatest success with multiple-hood exhaust systems, minimize pressure losses in<br />
the ducts by keeping velocities low, minimizing sharp transitions, <strong>and</strong> using hoods with<br />
relatively high-pressure drops. When pressure loss in the ducts is low compared to the<br />
loss through the hood, changes in pressure loss in the ductwork because <strong>of</strong> field<br />
conditions or changes in design airflow will have a smaller effect on total pressure loss<br />
<strong>and</strong> thus on actual airflow.<br />
Minimum code-required air velocity must be maintained in all parts <strong>of</strong> the exhaust<br />
ductwork at all times. If fewer or smaller hoods are installed than the design anticipated,<br />
resulting in low velocity in portions <strong>of</strong> the ductwork, the velocity must be brought up to<br />
the minimum. One way is to introduce replacement air, preferably untempered, directly<br />
into the exhaust duct where it is required (see Figure 13). The bypass duct should<br />
connect to the top or sides (at least 2 in. from the bottom) <strong>of</strong> the exhaust duct to prevent<br />
backflow <strong>of</strong> water or grease through the bypass duct when fans are <strong>of</strong>f. This arrangement<br />
is shown in NFPA St<strong>and</strong>ard 96 <strong>and</strong> should be discussed with the authority having<br />
jurisdiction.<br />
A fire damper should be provided in the bypass duct, located close to the exhaust duct.<br />
Bypass duct construction should be the same as the exhaust duct construction,<br />
including enclosure <strong>and</strong> clearance requirements, for at least several feet beyond the fire<br />
damper. Means to adjust the bypass airflow must be provided upstream <strong>of</strong> the fire<br />
damper. All dampers must be in the clean bypass air duct so they are not exposed to<br />
grease-laden exhaust air. The difference in pressure between replacement <strong>and</strong> exhaust<br />
air<br />
50
51<br />
duct may be great; the balancing device must be able to make a fine airflow adjustment<br />
against this pressure difference. It is best to provide two balancing devices in series,<br />
such as an orifice plate or blast gate for coarse adjustment followed by an opposedblade<br />
damper for fine adjustment.<br />
Directly measuring air velocities in the exhaust ductwork to assess exhaust system<br />
performance may be desirable. Velocity (pitot-tube) traverses may be performed in<br />
kitchen exhaust systems, but holes drilled for the pitot tube must be liquid tight to<br />
maintain the fire-safe integrity <strong>of</strong> the ductwork per NFPA St<strong>and</strong>ard 96. Holes should<br />
never be drilled in the bottom <strong>of</strong> a duct, where they may collect grease. Velocity traverses<br />
should not be performed when cooking is in progress because grease collects on the<br />
instrumentation.<br />
PRINCIPLES AND PROCEDURES FOR BALANCING HYDRONIC SYSTEMS<br />
Both air- <strong>and</strong> water-side balance techniques must be performed with sufficient accuracy<br />
to ensure that the system operates economically, with minimum energy, <strong>and</strong> with proper<br />
distribution. <strong>Air</strong>side balance requires precise flow measuring because air, which is<br />
usually the prime heating or cooling transport medium, is more difficult to measure in the<br />
field. Reducing airflow below design airflow reduces heat transfer directly <strong>and</strong> linearly<br />
with respect to waterside flow. In contrast, the heat transfer rate for the waterside does<br />
not vary linearly with the water flow rate through a heat exchanger (coil), because <strong>of</strong> the<br />
characteristics <strong>of</strong> heat exchangers. As a result, waterside heat transfer is less sensitive<br />
to changes in flow, <strong>and</strong> the required accuracy <strong>of</strong> flow is lower when using traditional<br />
design criteria. The relatively high pressures associated with hydronic systems allow for<br />
easier measurement <strong>of</strong> pressure, although application <strong>of</strong> flow <strong>and</strong> head relationships<br />
should be thoroughly understood.<br />
51
52<br />
Heat Transfer at Reduced Flow Rate<br />
The typical heating-only hydronic terminal (200°F, 20°F∆t) gradually reduces heat output<br />
as flow is reduced (Figure 1). Decreasing water flow to 20% <strong>of</strong> design reduces heat<br />
transfer to 65% <strong>of</strong> that at full design flow. The control valve must reduce water flow to<br />
10% to reduce heat output to 50%. This relative insensitivity to changing flow rates is<br />
because the governing coefficient for heat transfer is the airside coefficient; a change in<br />
internal or waterside coefficient with flow rate does not materially affect the overall heat<br />
transfer coefficient. This means (1) heat transfer for water-to-air terminals is established<br />
by the mean air-to-water temperature difference, (2) heat transfer is measurably changed,<br />
<strong>and</strong> (3) a change in mean water temperature requires a greater change in water flow rate.<br />
Fig. 1 Effects <strong>of</strong> Flow Variation on Heat Transfer<br />
Fig. 1 Effects <strong>of</strong> Flow Variation on Heat Transfer<br />
from a Hydronic Terminal<br />
52<br />
Hydronic Terminal<br />
Tests <strong>of</strong> hydronic coil performance show that when flow is throttled to the coil, the<br />
waterside differential temperature <strong>of</strong> the coil increases with respect to design selection.<br />
This applies to both constant volume <strong>and</strong> variable-volume air-h<strong>and</strong>ling units. In<br />
constantly circulated coils that control temperature by changing coil entering water<br />
temperature, decreasing source flow to the circuit decreases the waterside differential<br />
temperature.<br />
A secondary concern applies to heating terminals. Unlike chilled water, hot water can be<br />
supplied at a wide range <strong>of</strong> temperatures. Inadequate terminal heating capacity caused<br />
by insufficient flow can sometimes be overcome by raising supply water temperature.
53<br />
Design below the 250°F limit (ASME low-pressure boiler code) must be considered.<br />
Figure 2 shows the flow variation when 90% terminal capacity is acceptable. Note that<br />
heating tolerance decreases with temperature <strong>and</strong> flow rates <strong>and</strong> that chilled-water<br />
terminal are much less tolerant <strong>of</strong> flow variation than hot-water terminals.<br />
Dual-temperature heating/cooling hydronic systems are sometimes first started during<br />
the heating season. Adequate heating ability in the terminals may suggest that the<br />
system is balanced. Figure 2 shows that 40% <strong>of</strong> design flow through the terminal<br />
provides 90% <strong>of</strong> design heating with 140°F supply water <strong>and</strong> a 10°F temperature drop.<br />
Increased supply water temperature establishes the same heat transfer at terminal flow<br />
rates <strong>of</strong> less than 40% design.<br />
Sometimes, dual-temperature water systems have decreased flow during the cooling<br />
season because <strong>of</strong> chiller pressure drop; this could cause a flow reduction <strong>of</strong> 25%. For<br />
example, during the cooling season, a terminal that heated satisfactorily would only<br />
receive 30% <strong>of</strong> the design flow rate.<br />
Although the example <strong>of</strong> reduced flow rate at ∆t = 20°F only affects heat transfer by 10%,<br />
this reduced heat transfer rate may have the following negative effects:<br />
• Object <strong>of</strong> the system is to deliver (or remove) heat where required. When flow is<br />
reduced from design rate, system must supply heating or cooling for a longer period to<br />
maintain room temperature.<br />
• As load reaches design conditions, the reduced flow rate is unable to maintain room<br />
design conditions.<br />
• Control valves with average range ability (30:1) <strong>and</strong> reasonable authority (B = 0.5) may<br />
act as on-<strong>of</strong>f controllers instead <strong>of</strong> throttling flows to the terminal. The resultant change<br />
in riser friction loss may cause overflow or underflow in other system terminals.<br />
Attempting to throttle may cause wear on the valve plug or seat because <strong>of</strong> higher<br />
velocities at the vena contract <strong>of</strong> the valve. In extreme situations, cavitations may occur.<br />
Terminals with lower water temperature drops have greater tolerance for unbalanced<br />
conditions. However, larger water flows are necessary, requiring larger pipes, pumps,<br />
<strong>and</strong> pumping cost.<br />
53
54<br />
<strong>System</strong> balance becomes more important in terminals with a large temperature difference.<br />
Less water flow is required, which reduces the size <strong>of</strong> pipes, valves, <strong>and</strong> pumps, as well as<br />
pumping costs. A more linear emission curve gives better system control. If flow varies by<br />
more than 5% at design flow conditions, heat transfer can fall <strong>of</strong>f rapidly, ultimately causing<br />
poorer control <strong>of</strong> the wet-bulb temperature <strong>and</strong> potentially decreasing system air quality.<br />
Heat Transfer at Excessive Flow<br />
Increasing the flow rate above design in an effort to increase heat transfer requires careful<br />
consideration. Figure 3 shows that increasing the flow to 200% <strong>of</strong> design only increases heat<br />
transfer by 6% but increases resistance or pressure drop four times <strong>and</strong> power by the cube <strong>of</strong><br />
the original power (pump laws) for a lower design ∆t. In coils with larger waterside design ∆t,<br />
heat transfer can increase.<br />
Hydronic Pressure Measuring Instruments<br />
Manometer U-tube<br />
The U-tube manometer has primarily been used for measuring pressure drops across terminal<br />
heat exchangers <strong>and</strong> flow meters. There is no calibration required <strong>and</strong> other instruments can<br />
be verified against the manometer.<br />
Digital Manometer for <strong>Water</strong> Measurement<br />
There are several manufacturers <strong>of</strong> digital manometers <strong>and</strong> each has specific functions it can<br />
perform. The st<strong>and</strong>ard requirements <strong>of</strong> the digital manometer is it can read in English units or<br />
metric, has a broad range <strong>of</strong> pressures, can display in pounds per square inch (psi), foot head<br />
(R), inches <strong>of</strong> water column (in. wc), <strong>and</strong> kilo Pascal’s (kPa). Each manometer should have<br />
auto zeroing capabilities.<br />
The manufacturer’s pressure rating <strong>and</strong> calibration instructions should be followed. When<br />
used to measure pressures, the calibration shall be verified by using a U-tube manometer or a<br />
calibrated pressure gauge. The calibration verification can also be accomplished by using a<br />
dead weight kit.<br />
The accuracy <strong>of</strong> the gauge reading on differential pressure shall be ±2% <strong>of</strong> reading ±1<br />
digit.<br />
54
55<br />
Differential Pressure Gauges<br />
The differential pressure gauge is used to measure pressure differentials across terminal<br />
heat exchangers <strong>and</strong> flow meters. The manufacturer’s pressure ratings <strong>and</strong> calibration<br />
instructions shall be followed. The instrument calibration verification shall be performed<br />
by comparing the instrument readings with a U-tube manometer <strong>and</strong>/or a calibrated<br />
gauge.<br />
The accuracy <strong>of</strong> the instrument shall be ±1/2 % <strong>of</strong> full-scale differential pressure in<br />
ranges 0-30” wc to 0-200 psi (75 kpa to 1379 kpa). in addition, ±3/4% <strong>of</strong> full-scale<br />
differential pressure for ranges above 200 psi (1379 kpa).<br />
Test Gauges<br />
The most commonly used gauge for measuring pressure in a hydronic system is the<br />
Bourdon tube gauge. The accuracy <strong>of</strong> the gauge shall be 0.5% <strong>of</strong> full scale. The gauge<br />
should be selected so the indicated pressure is between the middle <strong>and</strong> upper half <strong>of</strong> the<br />
scale. When measuring hydronic differential pressures across any device with a Bourdon<br />
tube gauge, the same gauge shall be used for all readings. Pulsations shall be dampened<br />
to stop fluctuations in the readings. The gauge must be located at the same elevation for<br />
all readings to eliminate the effect <strong>of</strong> the weight <strong>of</strong> the fluid in the system at different<br />
heights. The calibration shall be verified by checking against a sheltered gauge prior to<br />
use on every project <strong>and</strong> dead weight tested on six-month intervals.<br />
Non-Intrusive Meters<br />
These meters strap on to the pipe <strong>and</strong> use non-intrusive transducers to measure<br />
acoustical signals <strong>and</strong> determine the flow. The non-intrusive meter may be a fixed meter<br />
or a portable meter.<br />
The transducers must be attached directly to a clean pipe without insulation. The<br />
following must be known regarding the pipe:<br />
• Pipe internal diameter<br />
• Pipe external diameter<br />
• Pipe material<br />
• W Pipe classification<br />
There are two types <strong>of</strong> non-intrusive meters: the Transit Time meter <strong>and</strong> the Doppler<br />
meter.<br />
Transit Time<br />
The Transit Time meter is designed for clean liquid applications <strong>and</strong> is used in HVAC<br />
hydronic flow measurement. The pipe must be free <strong>of</strong> air. The manufacturer’s installation<br />
information must be followed to maintain the meter’s accuracy <strong>of</strong> ±2% <strong>of</strong> full scale.<br />
Doppler<br />
55
56<br />
The Doppler meter is not suited for HVAC system hydronic measurement because it<br />
requires systems h<strong>and</strong>ling particulate matter to be accurate.<br />
Hydronic Flow Measuring<br />
Orifice Plate<br />
A calibrated orifice plate is a plate permanently installed in the pipe that as been<br />
calibrated by measuring the pressure drop against a known flow. The accuracy is<br />
dependent on the pipe location <strong>and</strong> the instrument used to measure pressure differential<br />
(Figure 11.1). The orifice shall be located according to the manufacturer's<br />
recommendations.<br />
56
57<br />
Venturi<br />
The venturi is a device permanently installed in the pipe that has been calibrated by<br />
measuring the pressure drop against a known flow. Venturis must be located according<br />
to the manufacturer's recommendations to maintain accuracy <strong>of</strong> 2% (Figure 11.2).<br />
Hydronic Pitot Tube Traverse<br />
The Pitot rod is a pair <strong>of</strong> tubes in a casing. One tube measures a static head pressure,<br />
<strong>and</strong> the other tube which faces in the direction <strong>of</strong> flow, measures the total head pressure.<br />
The Pitot rod is a manually inserted device used to take a series <strong>of</strong> velocity<br />
measurements, which are averaged <strong>and</strong> used to determine flow. (Figures 11.3 <strong>and</strong> 11.4).<br />
A manometer is attached to measure flow.<br />
GPM = FPM X Gallons per foot<br />
FPM = 1040 X √ VP<br />
Example 7A<br />
Find the Gpm <strong>of</strong> a system that has a Cfm <strong>of</strong> 10,000 with a entering air <strong>of</strong> 80°F Dry bulb,<br />
67°F wet bulb <strong>and</strong> a leaving air <strong>of</strong> 62°F dry bulb , 57.5°F wet bulb. The water entering is<br />
45°F <strong>and</strong> leaving is 55°F.<br />
80°F dry with a 67°F wet is a 31.51 enthalpy <strong>and</strong> 62°F dry 57.5°F wet is a enthalpy <strong>of</strong><br />
24.77 with a air density <strong>of</strong> 0.0757<br />
Solution<br />
Gpm = <strong>Air</strong> Density X CFM X ∆ Enthalpy / 8.337 X ∆ temperature <strong>of</strong> the water<br />
0.0757 X 10,000 X 6.74 / 8.337 X 10 = 5102.18 / 83.37 = 61.2 GPM<br />
57
58<br />
58
59<br />
Pressure Total pressure Velocity pressure<br />
Example 8: Find the GPM <strong>of</strong> a 6” pipe SCH 40 with a pressure <strong>of</strong> 42.45 <strong>and</strong> a total<br />
pressure <strong>of</strong> 42.47. Use fig. 11.3 for Gallons per foot<br />
Solution<br />
• Total pressure – pressure = velocity pressure<br />
• 1040 X √ velocity pressure = FPM<br />
• FPM X Gallons per foot = GPM<br />
• 42.47 total pressure – 42.45 pressure = 0.02 velocity pressure<br />
• 1040 X √ 0.02 = 147.08 FPM<br />
• 147.08 FPM X 1.5 Gallons per foot = 220.62 GPM<br />
Example 9: Find the ton <strong>of</strong> a chiller <strong>of</strong> example 8 with an entering water <strong>of</strong> 55.8 ºF <strong>and</strong> a leaving<br />
water <strong>of</strong> 45.2 ºF.<br />
Solution 1<br />
• Tons = GPM X 60 X 8.337 X ∆ Temperature <strong>of</strong> the water / 12,000 btuh per ton<br />
• 220.62 gallons X 60 minutes X 8.337 X 10.6 ∆T = 1,169,800.4 btuh<br />
• 1,169,800.4 btuh / 12,000 btuh per ton = 97.48 tons<br />
Solution 2<br />
• Tons = GPM X ∆ Temperature <strong>of</strong> the water X specific heat X specific gravity / 24<br />
• 220.62 gallons X 10.6 ∆T X 1 SH X 1 SG = 2338.57<br />
• 2338.57 / 24 = 97.44 tons<br />
59
60<br />
Calibrated <strong>Balancing</strong> Valves<br />
Calibrated balancing valves are designed as a flow meter <strong>and</strong> a balancing valve. The<br />
valve has pressure taps installed on the inlet <strong>and</strong> outlet. The manufacturer has calibrated<br />
the valve by measuring the resistance at various valve positions against known flow<br />
quantities. The valve has a graduated scale or dial to indicate the degree open. The<br />
calibration data shows the flow rate in gallons per minute (gpm) (Us) versus the<br />
measured pressure drop. Pressure drops are measured with an appropriate differential<br />
gauge. The flow is determined from the manufacturer's chart. The location <strong>of</strong> the valve<br />
must follow the manufacturer's recommendations.<br />
Spring-loaded Constant Flow Devices<br />
Spring-loaded constant flow devices are for constant flow systems. The valve is a springloaded<br />
piston that maintains 25% flow as long as the pressure differential is within the<br />
manufacturer's range. Differential pressures must be taken to assure pressure drop is<br />
within the recommended range. These valves are sensitive to dirt <strong>and</strong> debris, <strong>and</strong> should<br />
have a strainer installed upstream.<br />
Heat Exchanger Pressure Drop Taps<br />
Manufacturers <strong>of</strong> heat exchangers, e.g., coils, evaporators, <strong>and</strong> condensers, have flow<br />
curves for their exchangers that provide flow in gpm vs. pressure drop in feet <strong>of</strong> water.<br />
To obtain optimal pressure drops, pressure taps must be located at the inlet <strong>and</strong> outlet<br />
connection <strong>of</strong> the exchanger prior to any turns or valves. Dirt, debris <strong>and</strong> scaling will<br />
provide an inaccurate flow measurement.<br />
Generalized Chilled <strong>Water</strong> Terminal—Heat Transfer Versus Flow<br />
Heat transfer for a typical chilled-water coil in an air duct versus water flow rate is shown<br />
in Figure 4. The curves are based on ARI rating points: 45°F inlet water at a 10°F rise with<br />
entering air at 80°F db <strong>and</strong> 67°F wb. The basic curve applies to catalog ratings for lower<br />
dry-bulb temperatures providing consistent entering air moisture content (e.g., 75°F db,<br />
65°F wb). Changes in inlet water temperature, temperature rise, air velocity, <strong>and</strong> dry- <strong>and</strong><br />
wet-bulb temperatures cause terminal performance to deviate from the curves. Figure 4<br />
is only a general representation <strong>and</strong> does not apply to all chilled-water terminals.<br />
Comparing Figure 4 with Figure 1 indicates the similarity <strong>of</strong> the nonlinear heat transfer<br />
<strong>and</strong> flow for both the heating <strong>and</strong> cooling terminals.<br />
60
61<br />
Table 1 shows that if the coil is selected for the load <strong>and</strong> flow is reduced to 90% <strong>of</strong> load,<br />
three flow variations can satisfy the reduced load at various sensible <strong>and</strong> latent<br />
combinations.<br />
61
62<br />
Flow Tolerance <strong>and</strong> Balance Procedure<br />
The design procedure rests on a design flow rate <strong>and</strong> an allowable flow tolerance. The<br />
designer must define both the terminal’s flow rates <strong>and</strong> feasible flow tolerance,<br />
remembering that the cost <strong>of</strong> balancing rises with tightened flow tolerance. Any overflow<br />
increases pumping cost, <strong>and</strong> any flow decrease reduces the maximum heating or cooling<br />
at design conditions.<br />
WATER-SIDE BALANCING<br />
<strong>Water</strong>side balancing adjustments should be made with a thorough underst<strong>and</strong>ing <strong>of</strong><br />
piping friction loss calculations <strong>and</strong> measured system pressure losses. It is good<br />
practice to show expected losses <strong>of</strong> pipes, fittings, <strong>and</strong> terminals <strong>and</strong> expected<br />
pressures in operation on schematic system drawings.<br />
The waterside should tested by direct flow measurement. This method is accurate<br />
because it deals with system flow as a function <strong>of</strong> differential pressures, <strong>and</strong> avoids<br />
compounding errors introduced by temperature difference procedures. Measuring flow at<br />
each terminal enables proportional balancing <strong>and</strong>, ultimately, matching pump head <strong>and</strong><br />
flow to actual system requirements by trimming the pump impeller or reducing pump<br />
motor power. Often, reducing pump-operating cost will pay for the cost <strong>of</strong> waterside<br />
balancing.<br />
Equipment<br />
Proper equipment selection <strong>and</strong> preplanning are needed to successfully balance<br />
hydronic systems. Circumstances sometimes dictate that flow, temperature, <strong>and</strong><br />
pressure be measured. The designer should specify the water flow balancing devices for<br />
installation during construction <strong>and</strong> testing during hydronic system balancing. The<br />
devices may consist <strong>of</strong> all or some <strong>of</strong> the following:<br />
• Flow meters (ultrasonic stations, turbines, venturi, orifice plate, multiported pitot tubes,<br />
<strong>and</strong> flow indicators)<br />
• Manometers, ultrasonic digital meters, <strong>and</strong> differential pressure gages (analog or<br />
digital)<br />
• Portable digital meter to measure flow <strong>and</strong> pressure drop<br />
• Portable pyrometers to measure temperature differentials when test wells are not<br />
provided<br />
• Test pressure taps, pressure gages, thermometers, <strong>and</strong> wells.<br />
• <strong>Balancing</strong> valve with a factory-rated flow coefficient Cv, a flow versus h<strong>and</strong>le position<br />
<strong>and</strong> pressure drop table, or a slide rule flow calculator<br />
• Dynamic balancing valves or flow-limiting valves (for pre-balanced systems only); field<br />
62
63<br />
adjustment <strong>of</strong> these devices is not normally required or possible<br />
• Pumps with factory-certified pump curves<br />
• Components used as flow meters (terminal coils, chillers, heat exchangers, or control<br />
valves if using manufacturer’s factory certified flow versus pressure drop curves); not<br />
recommended as a replacement for metering stations<br />
Record Keeping<br />
<strong>Balancing</strong> requires accurate record keeping while making field measurements. Dated <strong>and</strong><br />
signed field test reports help the designer or customer in work approval, <strong>and</strong> the owner<br />
has a valuable reference when documenting future changes.<br />
Sizing <strong>Balancing</strong> Valves<br />
A balancing valve is placed in the system to adjust water flow to a terminal, branch, zone,<br />
riser, or main. It should be located on the leaving side <strong>of</strong> the hydronic branch. General<br />
branch layout is from take<strong>of</strong>f to entering service valve, then to the coil, control valve, <strong>and</strong><br />
balancing/service valve. Pressure is thereby left on the coil, helping keep dissolved air in<br />
solution <strong>and</strong> preventing false balance problems resulting from air bind.<br />
A common valve sizing method is to select for line size; however, balancing valves<br />
should be selected to pass design flows when near or at their fully open position with 12<br />
in. <strong>of</strong> water minimum pressure drop. Larger P is recommended for accurate pressure<br />
readings. Many balancing valves <strong>and</strong> measuring meters give an accuracy <strong>of</strong> ±5% <strong>of</strong> range<br />
down to a pressure drop <strong>of</strong> 12 in. <strong>of</strong> water with the balancing valve wide open. Too large<br />
<strong>of</strong> a balancing valve pressure drop will affect the performance <strong>and</strong> flow characteristic <strong>of</strong><br />
the control valve. Too small a pressure drop will affect its flow measurement accuracy as<br />
it is closed to balance the system. Equation (2) may be used to determine the flow<br />
coefficient Cv for a balancing valve or to size a control valve.<br />
The flow coefficient CV is defined as the number <strong>of</strong> gallons <strong>of</strong> water per minute that flows<br />
through a wide-open valve with a pressure drop <strong>of</strong> 1 psi at 60°F. This is shown as {CV =<br />
Q X √ (SF / ∆P)} (2)<br />
Q = CV / √ (SF / ∆P)<br />
Where<br />
CV = flow coefficient at 1 psi drop<br />
Q = design flow for terminal or valve, gpm<br />
∆P = pressure drop, psi<br />
∆H = pressure drop, ft <strong>of</strong> water<br />
63
64<br />
SF = specific gravity <strong>of</strong> fluid<br />
If pressure drop is determined in feet <strong>of</strong> water, Equation (2) can<br />
be shown as {CV = 1.5 X Q √ (SF / ∆H)} (3)<br />
HYDRONIC BALANCING METHODS<br />
Various techniques are used to balance hydronic systems. Balance by temperature<br />
difference <strong>and</strong> water balance by proportional method is the most common.<br />
Preparation<br />
Minimally, preparation before balancing should include collecting the following:<br />
1. Pump submittal data; pump curves, motor data, etc<br />
2. Starter sizes <strong>and</strong> overloads protection information<br />
3. Control valve Cv ratings <strong>and</strong> temperature control diagrams<br />
4. Chiller, boiler, <strong>and</strong> heat exchanger information; flow head loss<br />
5. Terminal unit information; flow head data<br />
6. Pressure relief <strong>and</strong> reducing valve setting<br />
7. Flow meter calibration curves<br />
8. Other pertinent data such as readout conversion charts<br />
<strong>System</strong> Preparation for Static <strong>System</strong><br />
1. Examine piping system: Identify main pipes, risers, branches <strong>and</strong> terminals on as-built<br />
drawings. Check that flows for all balancing devices are indicated on drawings before<br />
beginning work. Check that design flows for each riser equal the sum <strong>of</strong> the design flows<br />
through the terminals.<br />
2. Examine reducing valve<br />
3. Examine pressure relief valves<br />
4. Examine expansion tank<br />
5. For pumps, confirm<br />
Location <strong>and</strong> size<br />
Vented volute<br />
Alignment<br />
64
65<br />
Grouting<br />
Motor <strong>and</strong> lubrication<br />
Nameplate data<br />
Pump rotational direction<br />
6. For strainers, confirm<br />
Location <strong>and</strong> size<br />
Mesh size <strong>and</strong> cleanliness<br />
7. Confirm location <strong>and</strong> size <strong>of</strong> terminal units<br />
8. Control valves:<br />
Confirm location <strong>and</strong> size<br />
Confirm port locations <strong>and</strong> flow direction<br />
Set all valves open to coil<br />
Confirm actuator has required force to close valve under loaded conditions<br />
9. Ensure calibration <strong>of</strong> all measuring instruments, <strong>and</strong> that all calibration<br />
Data are known for balancing devices<br />
Pump Start-Up<br />
1. Set pump throttle valve to nearly closed position.<br />
2. Start pump <strong>and</strong> confirm rotational direction; rewire if rotation is incorrect.<br />
3. Open throttle valve slowly until differential head readout applied to the pump curve<br />
indicates that flow approximates design.<br />
4. Slowly close pump throttle valve to shut<strong>of</strong>f. Read pump differential head from gages.<br />
If shut<strong>of</strong>f head corresponds with the published curve, the previously prepared velocity<br />
head correction curve can be used as a pump flow calibration curve.<br />
A significant difference between observed <strong>and</strong> published shut<strong>of</strong>f head can be caused by<br />
an unvented volute, a partially plugged impeller, or by an impeller size different from that<br />
specified.<br />
Confirmation <strong>of</strong> <strong>System</strong> Venting<br />
1. Confirm tank location <strong>and</strong> size.<br />
2. Shut <strong>of</strong>f pump; record shut<strong>of</strong>f gauge pressure at tank junction.<br />
65
66<br />
3. Start pump <strong>and</strong> record operating pressure at tank junction.<br />
4. Compare operating to shut<strong>of</strong>f pressures at tank junction. If there is no pressure<br />
change, the system is air-free.<br />
5. Eliminate free air.<br />
No air separation: Shut <strong>of</strong>f pump <strong>and</strong> re-vent. Retest <strong>and</strong> re-vent until tank junction<br />
pressure is stable.<br />
<strong>Air</strong> separation: Operate system until free air has been separated out, indicated by stable<br />
tank junction pressure.<br />
<strong>Balancing</strong><br />
For single-, multiple-, <strong>and</strong> parallel pump systems, after pump start-up <strong>and</strong> confirmation <strong>of</strong><br />
system venting,<br />
1. Adjust pump throttle until pump head differential corresponds to design.<br />
2. Record pump motor voltage <strong>and</strong> amperage, <strong>and</strong> pump strainer head, at design flow.<br />
3. Balance equipment room piping circuit so that pumped flow remains constant over<br />
alternative flow paths.<br />
4. Record chiller <strong>and</strong> boiler circuits (for multiple-pump systems, requires a flow meter<br />
installed between header piping). For multiple-pump systems only,<br />
5. Check for variable flow in source circuits when control valves are operated.<br />
6. Confirm<br />
Pump suction pressure remains above cavitations range for all operating conditions.<br />
Pump flow rates remain constant.<br />
Source working pressures are unaffected. For parallel-pump systems, follow Steps (1) to<br />
(4), then shut <strong>of</strong>f pumps alternately <strong>and</strong><br />
5. Record head differential <strong>and</strong> flow rate through operating pump, <strong>and</strong> operating pump<br />
motor voltage <strong>and</strong> current.<br />
6. Confirm that operational point is satisfactory (no overload, cavitation potential, etc.).<br />
Balance by Temperature Difference<br />
This common balancing procedure is based on measuring the water temperature<br />
difference between supply <strong>and</strong> return at the terminal. The designer selects the cooling<br />
<strong>and</strong>/or heating terminal for a calculated design load at full-load conditions. At less than<br />
full load, which is true for most operating hours, the temperature drop is proportionately<br />
less. Figure 5 demonstrates this relationship for a heating system at a design ∆T <strong>of</strong> 20°F<br />
for outside design <strong>of</strong> 10°F <strong>and</strong> room design <strong>of</strong> 70°F.<br />
66
67<br />
For every outside temperature other than design, the balancing technician should<br />
construct a similar chart <strong>and</strong> read <strong>of</strong>f the ∆T for balancing. For example, at 50% load, or<br />
30°F outside air, the ∆T required is 10°F, or 50% <strong>of</strong> the design drop.<br />
This method is a rough approximation <strong>and</strong> should not be used where great accuracy is<br />
required. It is not accurate enough for cooling or heating systems with a large<br />
temperature drop.<br />
<strong>Water</strong> Balance by Proportional Method<br />
Preset Method. A thorough underst<strong>and</strong>ing <strong>of</strong> the pressure drops in the system riser<br />
piping, branches, coils, control valves <strong>and</strong> balancing valves is needed. Generally, several<br />
pipe <strong>and</strong> valve sizes are available for designing systems with high or low-pressure drops.<br />
A flow-limiting or trim device will be required. Knowing system pressure losses in design<br />
allows the designer to select a balancing device to absorb excess system pressures in<br />
the branch, <strong>and</strong> to shift pressure drop (which might be absorbed by a balancing device<br />
nearly close to achieve balance) to the pipes, coils, <strong>and</strong> valves so the balancing device<br />
merely trims these components’ performance at design flow. It may also indicate where<br />
high-head-loss circuits can exist for either relocation in the piping network, or hydraulic<br />
isolation through hybrid piping techniques. The installed balancing device should never<br />
be closed more than 40 to 50%; below this point flow reading accuracy falls to ±20 to<br />
30%. Knowing a starting point for setting the valve (preset) allows the designer to iterate<br />
system-piping design. This may not always be practical in large systems, but minimizing<br />
head <strong>and</strong> flow saves energy over the life <strong>of</strong> the facility <strong>and</strong> allows for proper temperature<br />
control. In this method,<br />
1. Analyze the piping network for the largest hydraulic loss based on design flow <strong>and</strong><br />
pipe friction loss. The pump should be selected to provide the total <strong>of</strong> all terminal flows,<br />
<strong>and</strong> the head required to move water through the hydraulically greatest circuit. Balance<br />
devices in this circuit should be sized only for the loss required for flow measurement<br />
67
68<br />
accuracy. Trimming is not required.<br />
2. Analyze differences in pressure drop in the pumping circuit for each terminal without<br />
using a balancing device. The difference between each circuit <strong>and</strong> the pump head (which<br />
represents the drop in the farthest circuit) is the required drop for the balancing device.<br />
3. Select a balancing device that will achieve this drop with minimum valve throttling. If<br />
greater than two pipe sizes smaller, shift design drop into control valve or coil (or both),<br />
equalizing pressure drop across the devices.<br />
4. Monitor system elevations <strong>and</strong> pressure drops to ensure air management, minimizing<br />
pocket collections <strong>and</strong> false pressure references that could lead to phantom balancing<br />
problems. 5. Use proportional balancing methods as outlined for field-testing <strong>and</strong><br />
adjustment.<br />
Proportional <strong>Balancing</strong><br />
Proportional waterside balancing may use design data, but relies most on as-built<br />
conditions <strong>and</strong> measurements <strong>and</strong> adapts well to design diversity factors. This method<br />
works well with multiple-riser systems. When several terminals are connected to the<br />
same circuit, any variation <strong>of</strong> differential pressure at the circuit inlet affects flows in all<br />
other units in the same proportion. Circuits are proportionally balanced to each other by<br />
a flow quotient:<br />
Flow quotient = Actual flow rate / Design flow rate (4)<br />
To balance a branch system proportionally,<br />
1. Fully open the balancing <strong>and</strong> control valves in that circuit.<br />
2. Adjust the main balancing valve for total pump flow <strong>of</strong> 100 to 110% <strong>of</strong> design flow.<br />
3. Calculate each riser valve’s quotient based on actual measurements. Record these<br />
values on the test form, <strong>and</strong> note the circuit with the lowest flow quotient.<br />
Note: When all balancing devices are open, flow will be higher in some circuits than<br />
others. In some, flow may be so low that it cannot be accurately measured. The situation<br />
is complicated because an initial pressure drop in series with the pump is necessary to<br />
limit total flow to 100 to 110% <strong>of</strong> design; this decreases the available differential pressure<br />
for the distribution system. After all other risers are balanced; restart analysis <strong>of</strong> risers<br />
with unmeasurable flow at Step (2).<br />
68
69<br />
4. Identify the riser with the highest flow ratio. Begin balancing with this riser, then<br />
continue to the next highest flow ratio, <strong>and</strong> so on. When selecting the branch with the<br />
highest flow ratio,<br />
Measure flow in all branches <strong>of</strong> the selected riser.<br />
In branches with flow higher than 150% <strong>of</strong> design, close the balancing valves to reduce<br />
flow to about 110% <strong>of</strong> design.<br />
Readjust total pump flow using the main valve.<br />
Start balancing in branches with a flow ratio greater than or equal to 1. Start with the<br />
branch with the highest flow ratio.<br />
The reference circuit has the lowest quotient <strong>and</strong> the greatest pressure loss. Adjust all<br />
other balancing valves in that branch until they have the same quotient as the reference<br />
circuit (at least one valve in the branch should be fully open).<br />
When a second valve is adjusted, the flow quotient in the reference valve will also<br />
change; continued adjustment is required to make their flow quotients equal. Once they<br />
are equal, they will remain equal or in proportional balance to each other while other<br />
valves in the branch are adjusted or until there is a change in pressure or flow.<br />
When all balancing valves are adjusted to their branches’ respective flow quotients, total<br />
system water flow is adjusted to the design by setting the balancing valve at the pump<br />
discharge to a flow quotient <strong>of</strong> 1.<br />
Pressure drop across the balancing valve at pump discharge is produced by the pump<br />
that is not required to provide design flow. This excess pressure can be removed by<br />
trimming the pump impeller or reducing pump speed. The pump discharge-balancing<br />
valve must then be reopened fully to provide the design flow.<br />
As in variable-speed pumping, diversity <strong>and</strong> flow changes are well accommodated by a<br />
system that has been proportionately balanced. Because the balancing valves have been<br />
balanced to each other at a particular flow (design), any changes in flow are<br />
proportionately distributed.<br />
<strong>Balancing</strong> the waterside in a system that uses diversity must be done at full flow.<br />
Because the components are selected based on heat transfer at full flow, they must be<br />
balanced to this point. To accomplish full-flow proportional balance, shut <strong>of</strong>f part <strong>of</strong> the<br />
system while balancing the remaining sections. When a section has been balanced, shut<br />
it <strong>of</strong>f <strong>and</strong> open the section that was open originally to complete full balance <strong>of</strong> the<br />
system. When balancing, care should be taken if the building is occupied or if load is<br />
69
70<br />
nearly full.<br />
Variable-Speed Pumping. To achieve hydronic balance, full flow through the system<br />
is required during balancing, after which the system can be placed on automatic control<br />
<strong>and</strong> the pump speed allowed changing. After the full-flow condition is balanced <strong>and</strong> the<br />
system differential pressure set point is established, to control the variable-speed<br />
pumps, observe the flow on the circuit with the greatest resistance as the other circuits<br />
are closed one at a time. The flow in the observed circuit should remain equal to, or more<br />
than, the previously set flow. <strong>Water</strong> flow may become laminar at less than 2fps, which<br />
may alter the heat transfer characteristics <strong>of</strong> the system.<br />
Pump Hydronic Volume Measurement<br />
Gauge Locations<br />
To measure the pumping head, connect a test gauge-to-gauge taps on the pump (Figure<br />
11.5). Some pumps are manufactured with gauge taps at the inlet <strong>and</strong> outlet flanges or<br />
pump body. If these are not present, taps should be installed:<br />
1. In the suction <strong>and</strong> discharge pipe, as close to the pump as possible.<br />
2. With no fittings between the pump <strong>and</strong> the taps<br />
3. With gauge cocks<br />
4. So that gauges can be installed at the same height with respect to pump centerline. If<br />
this is not possible, use a manifold-equipped test gauge or correct for the height<br />
difference.<br />
Verification <strong>of</strong> Impeller Size<br />
In order to determine the amount <strong>of</strong> flow in the system using the pump, the impeller size<br />
must be verified.<br />
1. Obtain the correct pump curve.<br />
70
71<br />
2. Turn the pump <strong>of</strong>f<br />
3. Close the discharge valve. Verify that the suction valve is fully open. The suction valve<br />
should always be fully open when the pump is in normal operation.<br />
4. Turn the pump on.<br />
5. Using a calibrated test gauge, measure the pressure on the suction <strong>and</strong> discharge<br />
sides <strong>of</strong> the pump (differential head pressure)<br />
6. Calculate the rise across the pump by subtracting the suction pressure from the<br />
discharge pressure. If the suction is in a vacuum, convert the reading (inches Hg) to psi<br />
<strong>and</strong> add the result to the discharge pressure [inches Hg / 2.05 = PSI].<br />
7. Multiply the pump psi rise by 2.31 feet to obtain rise in feet <strong>of</strong> water.<br />
8. Plot the rise on the vertical axis <strong>of</strong> the pump curve at zero flow. This indicates the<br />
starting point <strong>of</strong> the flow curve. The impeller size is determined by comparing the<br />
adjacent listed sizes on the pump curve<br />
Determine Pump Flow<br />
1. Verify all valves in the system are fully open<br />
2. Open the pump discharge valve to its full-open position<br />
3. Determine the flow head by measuring the discharge pressure <strong>and</strong> the suction<br />
pressure <strong>of</strong> the pump using the same calibrated test gauge.<br />
71
72<br />
4. Calculate the psi (pa) rise across the pump by subtracting the suction pressure from<br />
the discharge pressure.<br />
5. Multiply the pump psi rise by 2.31 feet/psi (110 pa) to obtain rise in feet <strong>of</strong> water.<br />
6. Plot the rise on the pump curve using the determined shut-<strong>of</strong>f head curve <strong>and</strong><br />
establish flow (Figure 11.6). Include pump curve in report.<br />
7. Measure the motor amperage <strong>and</strong> voltage. Compare the amperage to the motor<br />
nameplate. Note: The pump should be non-overloading through the entire operating<br />
range, if not, note what condition will cause overloading.<br />
8. Record the motor nameplate data, the actual rpm, amperage, voltage, <strong>and</strong> Watts.<br />
9. Record the pump nameplate showing the pump size, impeller size, gpm (Vs), <strong>and</strong><br />
head. Record the actual operating head <strong>and</strong> actual shut-<strong>of</strong>f head, discharge <strong>and</strong> suction<br />
pressure.<br />
Centrifugal Pump Performance<br />
Suction Conditions - Cavitations<br />
The suction conditions <strong>of</strong> a centrifugal pump are among the most important factors<br />
affecting its operation. After water enters the pump inlet, pressure between the pump<br />
inlet <strong>and</strong> the eye <strong>of</strong> the impeller is reduced. This region within the pump has the lowest<br />
pressure <strong>of</strong> the entire system. It is critical that this pressure not be lower than the vapor<br />
pressure <strong>of</strong> the liquid being pumped. Because centrifugal pumps are designed to pump<br />
liquids <strong>and</strong> not vapor, when a liquid vaporizes in the pump, one or more <strong>of</strong> the following<br />
symptoms may occur: snapping <strong>and</strong> crackling noises at the inlet, severe vibration, a<br />
drop in head <strong>and</strong> brake horsepower, a reduction in flow, or complete stoppage <strong>of</strong> flow.<br />
This condition is called “cavitation” <strong>and</strong> usually results in pitting <strong>and</strong> erosion <strong>of</strong> the vane<br />
tips or impeller inlet, thus reducing pump life.<br />
Net Positive Suction Head (NPSH)<br />
To eliminate cavitations problems it is necessary to maintain a minimum suction<br />
pressure at the pump inlet to overcome the internal losses in the pump. This minimum<br />
pressure, called net positive suction head (NPSH), combines all the factors limiting the<br />
suction side <strong>of</strong> the pump: internal losses, elevation <strong>of</strong> the suction supply, friction losses,<br />
vapor pressure, <strong>and</strong><br />
altitude <strong>of</strong> the installation. NPSH is further broken down into required net positive<br />
suction head <strong>and</strong> available net positive suction head.<br />
Net positive suction head required (NPSHR) refers to the internal pump losses <strong>and</strong> is a<br />
characteristic <strong>of</strong> the pump design. It is the actual absolute pressure required by the<br />
pump to overcome the pump’s internal losses <strong>and</strong> allow the pump to operate<br />
satisfactorily. A pump curve (Figure 11.6) will give the full range <strong>of</strong> NPSHR values for<br />
each impeller size <strong>and</strong> capacity.<br />
72
73<br />
Net positive suction head available (NPSHA) is a characteristic <strong>of</strong> the system in which the<br />
pump operates. It depends on such conditions as elevation <strong>of</strong> the suction supply in<br />
relation to the pump, the friction loss in the suction pipe, the altitude <strong>of</strong> the installation,<br />
or the pressure on the suction supply, <strong>and</strong> vapor pressure.<br />
Both available <strong>and</strong> required NPSH vary with capacity for a given pump <strong>and</strong> suction<br />
system. The NPSHA is decreased as the capacity is increased due to the increased<br />
friction losses in the suction piping. The NPSHR is a function <strong>of</strong> the velocity <strong>and</strong> friction<br />
in the pump inlet, <strong>and</strong> therefore increases as the capacity increases. If it is necessary to<br />
determine the NPSHA while testing a system, use Equation 11.1. For an example, see<br />
Appendix 11.1.<br />
Automatic Valves<br />
Automatic control valves (ACV) are used to control flow rate or to mix or divert water<br />
streams. They are classified as two-way or three-way construction, <strong>and</strong> as modulating or<br />
“two position.” To determine flow value use Equation 11.2.<br />
73
74<br />
When valves are selected at low authority (low-pressure drop), the ability to control the<br />
flow near shut<strong>of</strong>f is reduced. The balancing valve is used to set the flow at peak flow for<br />
the control valve.<br />
Two-way Valves<br />
Two-way valves control the flow rate by closing <strong>of</strong>f when heat transfer is<br />
not required at the terminal. They may be either single-seated or double seated. Singleseated<br />
valves (Figure 11.22) are the most common.<br />
74
75<br />
All automatic control valves must be installed with the direction <strong>of</strong> flow opposing the<br />
closing action <strong>of</strong> the valve. In other words, the direction <strong>of</strong> flow must be such that the<br />
flow <strong>and</strong> pressure tend to hold the valve open. If the valve is installed the opposite<br />
way, it will produce chattering. Double-seated or balanced valves (Figure 11.23) are<br />
generally used when high differential pressures are encountered <strong>and</strong> tight shut<strong>of</strong>f is<br />
not required. The flow direction through these valves tends to close one port while<br />
opening the other port. This design creates a balanced thrust condition that lets the<br />
valve close smoothly, without water hammer, regardless <strong>of</strong> the differential pressure.<br />
Three-way Valves<br />
Three-way valves are generally classified as mixing or diverting. This refers to the<br />
internal construction <strong>of</strong> the valve, not the application. The internal differences are<br />
necessary so that the valve seats against flow. Mixing valves have two inlets <strong>and</strong> one<br />
outlet (Figure 11.24). Diverting valves have one inlet <strong>and</strong> two outlets (Figure 11.25).<br />
Either valve may perform a temperature-control action (mixing application) or a flowcontrol<br />
action (bypassing application) depending on its location in the system (Figure<br />
11.26). Diverting valves, however, should not be substituted for mixing valves <strong>and</strong><br />
vice-versa. Using either design for the wrong application would tend to cause chatter.<br />
Another type <strong>of</strong> three-way valve is used in the supply line to coils in a three-pipe<br />
system (Figure 11.27). This valve has two inlets <strong>and</strong> one outlet. One inlet is supplied<br />
with heating water <strong>and</strong> the other is supplied with chilled water. Depending on the<br />
thermostatic controls in the<br />
occupied space, the valve opens to allow either heating water or chilled water into the<br />
coil.<br />
75
76<br />
76
77<br />
77
78<br />
Procedures<br />
Constant Volume <strong>Water</strong> <strong>Balancing</strong> Procedure<br />
The entire water system must be operational: all inspections performed as described in<br />
Chapter 6, final strainers installed <strong>and</strong> clean, all controls operational with all valves fully<br />
open. Set the system for balancing in the following manner:<br />
1. Determine the total coil flow <strong>and</strong> determine how many pumps will operate<br />
2. Record the pump (model <strong>and</strong> serial number, the motor name-plate, the design gpm<br />
flow, <strong>and</strong> the design head<br />
3. Verify the impeller size on each pump<br />
78
79<br />
4. Read <strong>and</strong> record the actual pump head <strong>and</strong> flow, actual motor amperage <strong>and</strong> voltage,<br />
starter data <strong>and</strong> motor overload protection devices size <strong>and</strong> ratings.<br />
5. Set each pump to provide approximately 10% more water flow than designed.<br />
6. Record all flow meter nameplate data. Read all flow meter flows <strong>and</strong> pressure drops<br />
throughout the entire system, ( i.e. chillers, converters, coils etc.), <strong>and</strong> establish flow<br />
using: Compare heat exchanger flow <strong>and</strong> flow meter flow with pump flow.<br />
7. Starting with the coil having the greatest flow, adjust the coils to the design flow. With<br />
full flow through the coil, measure <strong>and</strong> set the pressure differential at A-B by adjusting<br />
the balancing valve 1. Read the differential pressure at A-C. Set the three-way valve to<br />
bypass the coil. Adjust balancing Valve 2 in the bypass to match the pressure<br />
differential through the valve <strong>and</strong> coil (A-C) (Figure 1.45).<br />
8. Continue to proportion the water to each coil until all coils are balanced within 10% <strong>of</strong><br />
their design flow with at least one balancing valve in the system remaining 100% open.<br />
9. Re-verify <strong>and</strong> record the final pump gpm <strong>and</strong> head, amperages <strong>and</strong> voltage <strong>of</strong> each<br />
pump, discharge valve position, each heat exchange gpm <strong>and</strong> pressure drop, each coil<br />
gpm <strong>and</strong> pressure drop, <strong>and</strong> each flow meter flow. If the discharge valve has to be<br />
throttled to obtain design flow, note the valve position <strong>and</strong>, if possible, the differential<br />
across the valve. It should be recommended that the impeller be trimmed to meet final<br />
system requirements with the discharge valve full open.<br />
10. Verify the systems control sequence, observing if the correct controller controls the<br />
correct valve.<br />
11. Verify the coil or heat exchanger’s controller calibration <strong>and</strong> record the entering <strong>and</strong><br />
leaving air <strong>and</strong> water temperatures with the coil air <strong>and</strong> water set to design (cooling coil<br />
db/wb, heating coil db).<br />
12. Record the coil design <strong>and</strong> actual flows on a coil summary sheet <strong>and</strong> verify total coil<br />
flow is within 10% <strong>of</strong> total pump flow, total primary heat exchanger flow <strong>and</strong> total flow<br />
meter flow.<br />
13. Show the actual gpm (Vs) <strong>and</strong> head on the pump curve <strong>and</strong> establish <strong>and</strong> record the<br />
BHP (W).<br />
Variable Volume <strong>Water</strong> <strong>Balancing</strong> Procedure<br />
79
80<br />
The entire water system must be operational: all inspections performed, final strainers<br />
installed <strong>and</strong> clean, all controls operational with all valves fully open. Set the system for<br />
balancing in the following manner:<br />
1. Determine the total coil flow <strong>and</strong> determine:<br />
2. Diversity-is there enough pumping capacity to provide 100% design water flow to each<br />
coil? If there is not enough pumping capacity to provide 100% design water flow to each<br />
coil, close the valves to the coils closest to the pump until the pump can provide 100%<br />
flow to the open coils. If there are three-way valves or a bypass valve in the system,<br />
observe that it is closed prior to balancing.<br />
3. Record the pump (s) model <strong>and</strong> serial number, the motor nameplate, the design gpm<br />
flow, <strong>and</strong> the design head. Record the variable frequency drive (VFD) data if installed.<br />
4. If a VFD is installed, set the VFD bypass for 100%. Verify the impeller size on each<br />
pump.<br />
5. Read <strong>and</strong> record the actual pump head <strong>and</strong> flow with actual motor amperage <strong>and</strong><br />
voltage. Record starter data <strong>and</strong> motor over-load protection devices size <strong>and</strong> rating.<br />
6. Set each pump to provide approximately 10% more water flow than designed.<br />
7. Record all flow meter nameplate data. Read all flow meter flows <strong>and</strong> pressure drops<br />
throughout the entire system, (ie. chillers, converters, coils, etc.), <strong>and</strong> establish flow<br />
using Equation 11.4.<br />
8. Starting with the coil having the greatest flow, adjust the coil to the design flow.<br />
9. Continue to proportion the water to each coil until all coils are balanced within ± 10%<br />
<strong>of</strong> design flow with the balancing valve <strong>of</strong> at least one coil remaining 100% open. If the<br />
system has diversity, close an equal amount <strong>of</strong> valves nearest to the pump <strong>and</strong> open the<br />
initially closed valves. Continue to proportion the water to each coil (starting with the coil<br />
closest to the pump) until all the coils are balanced within ± 10% <strong>of</strong> the design flow.<br />
10. Re-verify <strong>and</strong> record the final pump gpm <strong>and</strong> head, amperage <strong>and</strong> voltage <strong>of</strong> each<br />
pump (discharge valve position if the system does not have a variable frequency drive).<br />
When the system has a VFD <strong>and</strong> the VFD is at 100% with the discharge valve throttled to<br />
obtain design flow, it is recommended that the impeller be trimmed or the VFD limited<br />
with the discharge valve fully open.<br />
11. Record the system’s pressure differential at the pressure transmitter with the system<br />
at full flow. Adjust the coil closest to the pump closed <strong>and</strong> verify the pressure transmitter<br />
setting. Continue with the next coil until enough coils are closed to equal the minimum<br />
speed <strong>of</strong> the pump or the minimum flow through the primary heat exchangers. Verify that<br />
the closed valves closest to the pump remain closed <strong>and</strong> are not lifting <strong>of</strong>f their seats.<br />
Note that most bypasses in two-way valve systems act as a relief valve <strong>and</strong> the pump will<br />
ride its pressure curve until bypass opens. Record the minimum flow across the heat<br />
exchanger.<br />
12. Verify the coil or heat exchangers controller calibration, <strong>and</strong> record the entering <strong>and</strong><br />
leaving water temperatures.<br />
80
81<br />
13. Record the coils design <strong>and</strong> actual flow (coils open for diversity) on a coil summary<br />
sheet <strong>and</strong> verify total coil flow equals within 10% <strong>of</strong> total pump flow, total primary<br />
heat exchanger flow, <strong>and</strong> total flow meter flow.<br />
14. Show the actual gpm <strong>and</strong> head on the pump curve <strong>and</strong> establish <strong>and</strong> record the<br />
brake horsepower. (Note: with VFD, discharge valve <strong>and</strong> VFD must be at l00%.)<br />
Expansion or Compression Tanks<br />
<strong>Water</strong> exp<strong>and</strong>s, when heated, in direct proportion to its temperature. In hydronic<br />
systems, an allowance must be made for this expansion, otherwise a pipe or piece <strong>of</strong><br />
equipment could burst.<br />
Open systems have expansion tanks to safely accommodate the increased volume <strong>of</strong><br />
heated water. These tanks, open to the atmosphere, are installed about 3 feet above the<br />
highest point in the system. As the water volume increases, the water level rises in the<br />
tank (Figure 11.10).<br />
A better solution is to use a closed expansion or compression tank containing a gas,<br />
such as air. When water exp<strong>and</strong>s into such closed tanks, it compresses the gas (Figure<br />
11.11).<br />
Once the system is filled with water (up to about two-thirds <strong>of</strong> the tank’s diameter) <strong>and</strong><br />
the water is heated or cooled to operating temperature, the expansion tank will<br />
accommodate the fluctuations in water volume <strong>and</strong> will control the pressure change in<br />
the system.<br />
81
82<br />
The point at which the expansion tank connects to the system is called “the point <strong>of</strong> no<br />
pressure change.” To avoid pumping problems, expansion<br />
tanks are installed on the suction side <strong>of</strong> the pump.<br />
Pressure-Relief Valves<br />
Pressure-relief valves (Figure 1 1.12) are safety devices for protecting against system<br />
damage <strong>and</strong> personal injury. The pressure-relief valve opens on a pre-set value so that<br />
the system pressure cannot exceed this amount.<br />
82
83<br />
<strong>Air</strong> Control<br />
<strong>Air</strong> is always present in hydronic heating <strong>and</strong> cooling systems. It gets into the system<br />
when it is initially filled through make-up water <strong>and</strong> when the system is drained for<br />
repairs <strong>and</strong> maintenance. <strong>Air</strong> is released from the water upon start-up, particularly when<br />
the water is heated. Much <strong>of</strong> this air will find its way to the expansion tank through an air<br />
separator. However, some <strong>of</strong> the air will find its way to other high points in the system.<br />
This entrapped air must be vented or it will block flow through the terminals. In fact, air in<br />
a system can restrict flow to the point <strong>of</strong> causing total shut-<strong>of</strong>f. <strong>Air</strong> can also result in<br />
noise in the system, pump cavitation, <strong>and</strong> seal failure. <strong>Air</strong> control devices such as air<br />
vents <strong>and</strong> air separators are designed to remove air from the system.<br />
<strong>Air</strong> Vents<br />
<strong>Air</strong> vents should be located at each point in the piping at which the water<br />
changes its direction to a downward flow, <strong>and</strong> at all high points in the system. <strong>Air</strong> vents<br />
can be either automatic or manually operated. A manual air vent is simply a valve that is<br />
opened to allow the entrained air to escape.<br />
Because automatic air vents occasionally malfunction, manual valves should be<br />
provided at each vent to permit servicing without shutting down <strong>and</strong> draining the system.<br />
<strong>Air</strong> Separators<br />
A boiler dip-tube air separator is a tube in the top or top side <strong>of</strong> the boiler. When water is<br />
heated, air is released <strong>and</strong> collects at a high point in the boiler. The dip tube allows this<br />
collected air to rise into the expansion tank. The air-separating tank is an in-line, lowvelocity,<br />
dip-tube air separator.<br />
The centrifugal air separator works on the action <strong>of</strong> centrifugal force <strong>and</strong><br />
low-velocity separation. <strong>Water</strong> circulation through the air separator creates a vortex or<br />
whirlpool in the center <strong>of</strong> the tank where entrained air collects <strong>and</strong> rises into the<br />
expansion tank.<br />
These devices are used at the point <strong>of</strong> lowest pressure <strong>and</strong> highest temperature in the<br />
system, which suggests for hot water systems, it is located between the heat exchanger<br />
<strong>and</strong> the pump inlet, <strong>and</strong> for chilled water systems it is located between the system <strong>and</strong><br />
pump inlets (the pump will pump through the heat exchanger).<br />
83
84<br />
Strainers<br />
The purpose <strong>of</strong> strainers (Figure 11.14) is to catch sediment or other foreign material in<br />
the water. A strainer contains a mesh screen formed into a sleeve that fits inside the<br />
strainer body. This sleeve must be removed <strong>and</strong> cleaned. A strainer with a dirty sleeve or<br />
a sleeve with a screen that is too fine means that there will be excessive pressure drop<br />
across the strainer <strong>and</strong> lower water flow. Strainers placed in the suction side <strong>of</strong> the pump<br />
must be properly sized <strong>and</strong> kept clean to avoid cavitation. Strainers should have<br />
pressure taps installed at the inlet <strong>and</strong> outlet.<br />
Strainers should only be used where necessary to protect the components in the system.<br />
For example, in the case <strong>of</strong> cooling towers, strainers in the tower basin may provide<br />
adequate protection. Individual fine mesh strainers may need to be installed before<br />
automatic control valves or spray nozzles, which operate with small clearances <strong>and</strong><br />
require protection from materials that might pass through the pump strainer.<br />
Valves<br />
Valves are used in hydronic systems to:<br />
• control water flow<br />
• isolate part, or all <strong>of</strong> the system for servicing<br />
84
85<br />
• allow draining <strong>of</strong> all or part <strong>of</strong> the system<br />
• restrict operation to specific subsystems<br />
• allow quick filling <strong>of</strong> the system by bypassing the pressure-reducing valve<br />
Manual Valves<br />
Manual valves fall into two major categories: manual service valves <strong>and</strong> check valves.<br />
Manual service valves regulate flow rate. These include gate, globe, plug, ball, <strong>and</strong><br />
butterfly valves. Check valves limit the direction <strong>of</strong> flow. Another manual valve, the<br />
combination valve, both regulates flow <strong>and</strong> limits direction <strong>of</strong> flow.<br />
Gate Valves<br />
Gate valves (Figure 11.15) regulate flow only in that they are either fully open or fully<br />
closed. They should not be used for throttling purposes because they produce a highvelocity<br />
water stream when partly closed, resulting in erosion <strong>of</strong> the valve seat. This is<br />
called wiredrawing, <strong>and</strong> will result in leakage when the valve is fully closed. Gate valves<br />
should be used for tight shut<strong>of</strong>f, <strong>and</strong> for servicing equipment. Gate valves allow a<br />
straight-through flow pattern, resulting in low-pressure drop.<br />
Globe Valves<br />
Globe valves (Figure 11.16) can be used in partially open positions <strong>and</strong> therefore can be<br />
used for throttling fluid flow. However, globe valves have high-pressure drops, even<br />
when fully open. Therefore, globe valves can unnecessarily increase the required pump<br />
head, <strong>and</strong> should not be used for balancing. They can, however, be used in water<br />
make-up lines. Note: If globe valves are ever tampered with, or used to shut <strong>of</strong>f a<br />
system, it is difficult to reset the system.<br />
85
86<br />
Plug Valves<br />
Plug valves (Figure 11.17) are used for balancing water flow. Some plug valves have<br />
adjustable memory stops that are set during the final balance so that if the valve is<br />
closed, it can later be reopened to the original setting. Plug valves have a low-pressure<br />
drop <strong>and</strong> therefore add little to the pumping head. They can also be used for tight<br />
shut<strong>of</strong>f. Plug valves have good throttling characteristics (Figure 11.18). Throttling<br />
characteristics refer to the relationship <strong>of</strong> the valve disc to the percentage <strong>of</strong> flow.<br />
86
87<br />
Valves have linear throttling characteristics when the disc-open percentage is the same<br />
as the flow percentage. For example, a valve would be said to have linear or straight-line<br />
throttling characteristic if closing it 50% reduced<br />
flow by 50%. For adjusting purposes, the closer the valves are to linear flow the better.<br />
Ball Valves<br />
Ball valves (Figure 11.19) are similar to plug valves, <strong>and</strong> are <strong>of</strong>ten used for water<br />
balancing. They have low-pressure drops <strong>and</strong> good flow characteristics. Set the memory<br />
stop, if available.<br />
Butterfly Valves<br />
Butterfly valves (Figure 11.20) consist <strong>of</strong> a heavy ring enclosing a disc that<br />
rotates on an axis <strong>and</strong>, in principle, is similar to a round single-blade damper. Butterfly<br />
valves have low-pressure drops <strong>and</strong> are used as throttling valves, but do not have good<br />
throttling characteristics.<br />
87
88<br />
Check Valves<br />
Check valves allow water to flow in one direction <strong>and</strong> stops its flow in the other direction.<br />
There are two types <strong>of</strong> check valves: swing <strong>and</strong> spring loaded. Check valves should be<br />
used at the discharge <strong>of</strong> the pump. With swing check valves, when the system is <strong>of</strong>f the<br />
weight <strong>of</strong> the gate <strong>and</strong> gravity closes the valve. The valve is opened when the system is<br />
turned on,<br />
in addition, pressure from the fluid flowing in the proper direction causes the gate to<br />
swing open. Spring-loaded check valves have springs that keep the valve closed. <strong>Water</strong><br />
pressure from the proper direction against the spring opens the valve.<br />
Combination Valves<br />
Combination valves (Figure 11.21) are sometimes referred to as a multipurpose or tripleduty<br />
valves. They are a combination <strong>of</strong> a check valve, a calibrated balancing valve, <strong>and</strong> a<br />
shut<strong>of</strong>f valve. They are made in a straight or angle pattern.<br />
Combination valves act as a check valve, preventing back flow when the<br />
pump is <strong>of</strong>f, <strong>and</strong> can be closed for tight shut<strong>of</strong>f, or can be partially closed for balancing.<br />
These valves have pressure taps for connecting flow gauges <strong>and</strong> for reading pressure<br />
drop across the valve. A calibration chart is provided with the valve for conversion <strong>of</strong><br />
pressure drop to gpm. The valves also have memory stops.<br />
Series loop<br />
The series loop is a simple <strong>and</strong> inexpensive piping arrangement generally limited to<br />
residential <strong>and</strong> small commercial building applications. In series loops (Figure 11.32),<br />
supply water is pumped through each terminal in series <strong>and</strong> then returned to the boiler.<br />
Since all the water is circulated in succession through each terminal, there are several<br />
disadvantages to the series loop arrangement. First, making repairs at any one terminal<br />
requires shutting the whole system down. Second, it is not possible to provide capacity<br />
controls on individual terminals, because valuing down one terminal would reduce flow<br />
88
89<br />
to all the terminals down the line. Instead, space heating must be controlled by<br />
dampening the airflow.<br />
These disadvantages can be partially remedied by designing the piping with two or more<br />
circuits, <strong>and</strong> installing balancing valves in each circuit (Figure 11.33). This type <strong>of</strong><br />
arrangement is called a split series loop.<br />
The series loop circuit length <strong>and</strong> pipe size are also very important in the design because<br />
they directly influence the water flow rate, temperature, <strong>and</strong> pressure drop. For instance,<br />
as the heating supply water flows through the terminals, its temperature drops<br />
continuously as it gives up heat in each terminal. If there are too many terminals in<br />
series, the water temperature in the last terminal may be too cool to be effective.<br />
One Pipe Main<br />
One-pipe mains are used in houses <strong>and</strong> small commercial <strong>and</strong> industrial heating<br />
applications where individual space control is needed. This arrangement uses a singleloop<br />
main but differs from series loop arrangements in that each terminal is connected<br />
by a supply <strong>and</strong> return branch pipe to the main (Figure 11.34). Because the terminal has a<br />
89
90<br />
higher-pressure drop than the main, the water circulating in the main will tend to flow<br />
through the straight run <strong>of</strong> the tee fittings, starving the terminal.<br />
90
91<br />
Pump Circuits<br />
Primary-Secondary<br />
Primary-secondary pump circuits reduce pumping horsepower requirements while<br />
increasing system control quality. Primary-secondary<br />
circuits are designed so that when two circuits are interconnected, flow in one circuit will<br />
not cause flow in the other if the pressure drop is eliminated in the pipe common to both<br />
circuits.<br />
Figure 11.40 shows a primary-secondary pump circuit. The common pipe (A-H), which<br />
may vary in length, has a negligible pressure drop <strong>and</strong> ensures the isolation <strong>of</strong> the<br />
secondary circuit from the primary circuit. Therefore, in order to overcome the pressure<br />
loss in the secondary circuit (A-B-C-D-E-F-G-H) <strong>and</strong> provide design flow, a secondary<br />
pump (Figure 11.41) must be installed.<br />
The primary pump <strong>and</strong> the secondary pump have no effect on each other. The function <strong>of</strong><br />
the primary pump is simply to circulate water around the primary circuit. The secondary<br />
pump then supplies the terminals. The secondary flow may be (1) less than, (2) equal to,<br />
or (3) greater than the primary flow (Figures 11.42, 11.43, <strong>and</strong> 11.44).<br />
91
92<br />
Basic Testing<br />
<strong>Water</strong> Cooled Chiller<br />
The water-cooled chiller consists <strong>of</strong> one or more <strong>of</strong> the following: compressors, liquid<br />
coolers <strong>and</strong> water-cooled condensers. The basic test for a water-cooled chiller is shown<br />
on the NTT “Chillers” report form. The basic procedure is to measure <strong>and</strong>/or report the<br />
following:<br />
• Chiller manufacturer nameplate data<br />
• Rated capacity in tons<br />
• Model <strong>and</strong> serial number<br />
92
93<br />
• Evaporator:<br />
• the design <strong>and</strong> actual entering water temperature<br />
• the design <strong>and</strong> actual leaving water temperature<br />
• the design <strong>and</strong> actual pressure drop in feet (kpa)<br />
• the design <strong>and</strong> actual GPM (Vs)<br />
Example 10: Find the GPM <strong>of</strong> a GN, 070-chiller, entering water pressure <strong>of</strong> 42.45 psig<br />
<strong>and</strong> a leaving pressure <strong>of</strong> 36.82 psig.<br />
Solution<br />
• ∆ Pressure drop X 2.31 = foot head<br />
• Use chart for GN 070 chiller for GPM<br />
• 42.45 pressure – 36.82 pressure = 5.63 ∆ Pressure drop<br />
• 5.63 ∆ Pressure drop X 2.31 = 13.00 foot head<br />
• using chart for GN 070 chiller with a 13.0 foot head gave a 180 gpm<br />
93
94<br />
Example 11: Find the tons <strong>of</strong> the chiller in example 10 with an entering water temperature <strong>of</strong> 56.8<br />
ºF <strong>and</strong> a leaving water temperature <strong>of</strong> 46.5 ºF <strong>of</strong> a GN 070 chiller.<br />
Solution 1<br />
• Tons = GPM X 60 X 8.337 X ∆ Temperature <strong>of</strong> the water / 12,000 btuh per ton<br />
• 180 gallons X 60 minutes X 8.337 X 10.3 ∆T = 927,407.8 btuh<br />
• 927,407.8 btuh / 12,000 btuh per ton = 77.28 tons<br />
Solution 2<br />
• Tons = GPM X ∆ Temperature <strong>of</strong> the water X specific heat X specific gravity / 24<br />
• 180 gallons X 10.3 ∆T X 1 SH X 1 SG = 1854<br />
• 1854 / 24 = 77.25 tons<br />
Condenser<br />
• the design <strong>and</strong> actual entering water temperature<br />
• the design <strong>and</strong> actual leaving water temperature<br />
• the design <strong>and</strong> actual pressure drop in feet (kpa)<br />
• the design <strong>and</strong> actual GPM (Vs)<br />
• Electrical (electrical measurements will only be taken on equipment rated under 600<br />
volts)<br />
• the design <strong>and</strong> actual voltage<br />
• the design <strong>and</strong> actual amperages<br />
94
95<br />
95
96<br />
<strong>Air</strong> Cooled Chiller<br />
The air-cooled chiller consists <strong>of</strong> one or more <strong>of</strong> the following: compressors, liquid<br />
coolers <strong>and</strong> air-cooled condensers that include condenser fans. The basic procedure is<br />
to measure <strong>and</strong>/or report the following:<br />
• Chiller manufacturer nameplate data<br />
• Rated capacity in tons<br />
• Model <strong>and</strong> serial number<br />
Evaporator:<br />
• the design <strong>and</strong> actual entering water<br />
• the design <strong>and</strong> actual leaving water temperature<br />
• the design <strong>and</strong> actual pressure drop in feet (kpa)<br />
• the design <strong>and</strong> actual GPM (l/s)<br />
96
97<br />
Condenser<br />
• the design <strong>and</strong> actual temperature<br />
Electrical<br />
• the design <strong>and</strong> actual voltage for the compressor( s)<br />
• the design <strong>and</strong> actual amperage for the compressor( s)<br />
• the design <strong>and</strong> actual voltage for the condenser fan( s)<br />
• the design <strong>and</strong> actual amperage for the condenser fan( s)<br />
<strong>Air</strong> Cooled Chiller With Remote Condenser( s)<br />
The air-cooled chiller with remote condenser(s) consists <strong>of</strong> compressors <strong>and</strong> liquid<br />
coolers or evaporators that connect to one or more air-cooled condensers.<br />
The basic test for the air-cooled chiller with remote condenser is the same as <strong>Air</strong> Cooled<br />
Chillers with the condenser data being not applicable.<br />
<strong>Air</strong> Cooled Condenser<br />
The basic test for the air-cooled condenser is shown on the Associated <strong>Air</strong> Balance<br />
Council’s “<strong>Air</strong> Cooled Condensing Unit” report form. The basic procedure is to measure<br />
<strong>and</strong>/or report the following:<br />
• Condenser manufacturer nameplate data<br />
• Rated capacity in tons<br />
• Model <strong>and</strong> serial number<br />
• The design <strong>and</strong> actual entering air temperature<br />
• The design <strong>and</strong> actual voltage for the condenser fan( s)<br />
• The design <strong>and</strong> actual amperage for the condenser fan( s)<br />
97
98<br />
Field Performance Testing Of Chillers<br />
The performance test for a water-cooled chiller, air-cooled chiller, <strong>and</strong> an air-cooled<br />
chiller with a remote condenser must be specified. This test is not considered a st<strong>and</strong>ard<br />
test <strong>of</strong> the Balance Council, <strong>and</strong> is over <strong>and</strong> above basic chiller testing. All parties<br />
involved in the performance test must agree to the procedure, date <strong>of</strong> test, <strong>and</strong> how the<br />
various measurements will be taken.<br />
The following tasks are the responsibility <strong>of</strong> contractors <strong>and</strong>/or manufacturers involved<br />
<strong>and</strong> will be verified by the TAB Agency before the performance test is scheduled or<br />
performed:<br />
• Temperature taps or thermometer wells shall have been installed for measuring the<br />
temperature <strong>of</strong> water entering <strong>and</strong> leaving the evaporator <strong>and</strong> condenser. All persons<br />
involved in the test must agree on the method <strong>of</strong> temperature measuring<br />
• The water circulating system shall have been thoroughly cleaned <strong>of</strong> all foreign matter.<br />
Samples <strong>of</strong> the water shall be clear <strong>and</strong> indicate clear passage <strong>of</strong> water through the<br />
pumps, piping, <strong>and</strong> evaporators<br />
• The water circulating pump shall have been tested for correct operation, the strainers<br />
cleaned, <strong>and</strong> placed in normal operation<br />
• The liquid chilling package shall have been leak tested, dehydrated, evacuated, <strong>and</strong><br />
charged with the operating amount <strong>of</strong> refrigerant<br />
• <strong>Water</strong> flow measuring devices shall be installed <strong>and</strong> functioning<br />
General Procedures<br />
The performance test shall be conducted by the NTT Agency <strong>and</strong> the manufacturer in the<br />
presence <strong>of</strong> the purchaser, engineer, <strong>and</strong> final owner, should they desire to be present.<br />
There should be sufficient notice <strong>of</strong> the test date so that all concerned parties can<br />
arrange to be present. Additionally, if the manufacturer desires, he shall be given<br />
sufficient time before the test to inspect <strong>and</strong> prepare the system being tested.<br />
All test instrumentation shall be agreed upon by the purchaser, engineer, manufacturer,<br />
<strong>and</strong> NTT Agency. All thermometers used in the test shall be tested before <strong>and</strong> after the<br />
test. Any thermometer whose corrected reading (actual reading plus calibration) differs<br />
from the average by more than k 0.5ºF (0.lºC) shall not be used.<br />
The operating conditions <strong>of</strong> the test shall conform to the following:<br />
• Temperatures must be the average bulk stream<br />
98
99<br />
• Each reading <strong>of</strong> liquid temperatures shall not vary by more than 0.3°F (0.1ºC)<br />
• The liquid cooling temperature range shall not vary more than 0.5°F (0.lºC)<br />
Range = Entering Liquid O F (ºC) - Leaving Liquid O F (ºC)<br />
• Individual dry bulb temperature readings shall not vary by more than 2°F ( 1°C) from<br />
the average value<br />
• The arithmetic average <strong>of</strong> all required dry bulb air temperature readings shall not vary<br />
from the specified values by more than 1ºF (0.5°C)<br />
• The chilled liquid flow rate shall not deviate more than ± 5% from the specified volume.<br />
Performance Test <strong>of</strong> <strong>Water</strong> Cooled<br />
Liquid Chilling <strong>System</strong>s<br />
After steady-state condition has been established, the following can be recorded by<br />
taking three sets <strong>of</strong> data in five-minute intervals (test readings for each data set shall be<br />
taken as simultaneously as possible). All the required readings shall be taken at fiveminute<br />
intervals <strong>and</strong> the test continued until at least three consecutive sets <strong>of</strong> readings<br />
are within the operating conditions.<br />
The following data shall be recorded:<br />
• Temperature <strong>of</strong> liquid entering cooler, ºF (ºC)<br />
• Temperature <strong>of</strong> liquid leaving cooler, ºF (ºC)<br />
• Chilled liquid flow rate, gpm (Vs)<br />
• Description <strong>of</strong> liquid sufficient to obtain necessary physical properties<br />
• Power input to compressor, expressed as:<br />
• Power input to motor, kW, Note: Manufacturer must furnish kW meter for all voltages<br />
over 600.<br />
• Electrical power input to controls <strong>and</strong> auxiliary equipment, kW<br />
• Condenser water pressure drop (inlets to outlets), ft. <strong>of</strong> water (kpa) (pressure drop X<br />
2.31 = feet <strong>of</strong> water) (Note: Steady state will be determined by pressure drop).<br />
• Dry bulb temperature <strong>of</strong> air entering condenser, ºF (ºC)<br />
• Condenser fan motor power consumption, kW<br />
• Fan rotative speed, rpm<br />
• Barometric pressure, inches <strong>of</strong> HG<br />
99
100<br />
The following general information shall be recorded:<br />
• Nameplate data including make, model, size, <strong>and</strong> refrigerant, sufficient to completely<br />
identify the liquid chilling package<br />
• Electrical frequency in Hz<br />
• Compressor driver or input rotative speed (rpm) for open type compressors<br />
• Temperature <strong>of</strong> ambient air at cooler, ºF (ºC)<br />
• Actual voltage, <strong>and</strong> current in amperes, for each phase, <strong>of</strong> all electric motor drives<br />
• Date, time, <strong>and</strong> location <strong>of</strong> test<br />
• Names <strong>of</strong> test supervisor <strong>and</strong> witnessing personnel<br />
• Specified refrigerant<br />
• Operating charge <strong>of</strong> refrigerant, lb (kg)<br />
Cooling Tower Testing<br />
The NTT basic test for a cooling tower measures water flow, temperature both entering<br />
<strong>and</strong> leaving the tower, <strong>and</strong> electrical components. The performance test encompasses<br />
testing recommended by NTT or the Cooling Tower Institute (CTI). Establish the tower<br />
airflow by determining flow in pounds per hour, while CTI determines the tower airflow<br />
according<br />
to the fans’ brake horsepower.<br />
The NTT performance test is not dependent upon the tower manufacturer’s curves. A<br />
graph generated by the NTT performance test illustrates the cooling tower operation<br />
through a wide range <strong>of</strong> conditions.<br />
Cooling tower performance test must be specified as per the NTT Cooling Tower<br />
performance procedure or the CT1 test. Performance testing is over <strong>and</strong> above the basic<br />
testing <strong>of</strong> towers.<br />
Basic Test<br />
The st<strong>and</strong>ard test for cooling towers is shown on the Associated <strong>Air</strong> Balance Council’s<br />
“Cooling Tower Operation Test Report.” The procedure is to measure <strong>and</strong> record:<br />
• Design <strong>and</strong> actual flow <strong>of</strong> the water<br />
100
101<br />
• Design <strong>and</strong> actual entering water temperature<br />
• Design <strong>and</strong> actual leaving water temperature<br />
• Design <strong>and</strong> actual entering wet bulb<br />
• Design <strong>and</strong> actual ambient dry bulb<br />
Along with the data above, record the tower’s nameplate <strong>and</strong>/or submittal data to<br />
indicate:<br />
• Tower designation<br />
• Manufacturer<br />
• Model number <strong>and</strong> serial number<br />
• Rated capacity in tons<br />
Record the motor nameplate <strong>and</strong> heater element with actual amps, volts, calculated brake<br />
horsepower. Record the design <strong>and</strong> actual rpms as well.<br />
Performance Test Parameters<br />
1. The cooling tower performance test must be specified <strong>and</strong> is not a st<strong>and</strong>ard test <strong>of</strong> the<br />
TAB Agency. All parties involved in the cooling tower test must agree to the procedure,<br />
date <strong>of</strong> test, <strong>and</strong> how the various measurements will be taken. The test performed will be<br />
as prescribed by NTT or CTI.<br />
2. While the following tasks are primarily the responsibility <strong>of</strong> other trades, they should<br />
be checked by the testing agency as well before scheduling or conducting the cooling<br />
tower performance test:<br />
• Temperature taps or thermometer wells shall have been installed for measuring<br />
the temperature <strong>of</strong> hot water entering the tower, cold water leaving the tower, <strong>and</strong> makeup<br />
water entering the tower. All persons involved in the test must agree on the method <strong>of</strong><br />
temperature measuring.<br />
• Provisions shall have been made to measure the re-circulating, make-up, <strong>and</strong><br />
blow down water flow rate with the proper runs <strong>of</strong> straight pipe upstream <strong>and</strong><br />
downstream <strong>of</strong> the measurement device. All persons involved in the test must agree on<br />
the method <strong>of</strong> water flow measurement.<br />
• A 110-volt AC power source shall be available at the tower site for<br />
mechanically aspirated psychrometer.<br />
• The water circulating system shall have been thoroughly cleaned <strong>of</strong> all foreign<br />
matter. Samples <strong>of</strong> water shall be clear.<br />
• The cooling tower fans shall be rotating correctly <strong>and</strong> operating within ±10% <strong>of</strong><br />
the design horsepower loading. All obstructions shall have been removed from the path<br />
101
102<br />
<strong>of</strong> airflow. Permanent obstructions shall be noted by the NTT TAB Agency.<br />
• The cooling tower wet-deck surface (fill) shall be clean <strong>and</strong> free <strong>of</strong> foreign<br />
materials such as scale, algae, or tar.<br />
• The water in the upper <strong>and</strong> lower basins <strong>of</strong> the tower shall be set at proper<br />
operation levels as recommended by the tower manufacturer.<br />
• <strong>Water</strong> circulating pumps shall have been tested for correct operation <strong>and</strong><br />
placed in normal operating conditions.<br />
• If performing the CT1 test, the cooling tower manufacturer shall have<br />
submitted a full set <strong>of</strong> performance curves for the cooling tower. Additionally, the<br />
manufacturer shall provide a listing <strong>of</strong> the design point conditions <strong>of</strong>:<br />
• design liquid-to-gas ratio;<br />
• hot water temperature;<br />
• cold water temperature;<br />
• inlet wet bulb temperature;<br />
• inlet dry bulb temperature;<br />
• fan motor horsepower (motor output power unless otherwise specified);<br />
• fan motor efficiency;<br />
• design barometric pressure;<br />
• <strong>and</strong> density <strong>of</strong> air entering the fan(s) at design conditions.<br />
General Procedures<br />
The performance test is conducted by the NTT TAB Agency in the presence <strong>of</strong> authorized<br />
representatives <strong>of</strong> the manufacturer, the purchaser, <strong>and</strong> the owner, should they desire to<br />
be present. The NTT Agency shall give sufficient advance notice <strong>of</strong> the test date so that<br />
all concerned parties can arrange to be present. Additionally, the manufacturer shall be<br />
given sufficient time before the test to inspect <strong>and</strong> prepare the tower, if desired.<br />
The NTT TAB Agency uses a team <strong>of</strong> at least one TAB engineer <strong>and</strong> one technician to<br />
perform this test. Representatives <strong>of</strong> the manufacturer <strong>and</strong> purchaser are allowed to<br />
observe, but shall not participate in, reading <strong>and</strong> recording <strong>of</strong> test data.<br />
All test instrumentation shall be furnished, or inspected <strong>and</strong> approved, by the NTT TAB<br />
Agency. All thermometers used in the test are checked before <strong>and</strong> after the test by<br />
immersing them in a common bath, the temperature <strong>of</strong> which is between 70°F (32°C) <strong>and</strong><br />
90°F (63°C). Any thermometer whose corrected reading (actual reading plus calibration)<br />
102
103<br />
differs from the average by more than +0.15"F (0.l"C) shall not be used.<br />
The operating conditions during the test must conform to the following:<br />
• Entering wet-bulb temperature shall be within ±15°F (1°C) <strong>of</strong> design.<br />
• Range shall be within ±20% <strong>of</strong> design.<br />
• Power input to fan (s) shall be within ±10% <strong>of</strong> design.<br />
• Average wind velocity shall be 10 mph or less, <strong>and</strong> shall not exceed 15 mph for longer<br />
than one minute.<br />
• Entering dry bulb, if applicable, shall not exceed ±20% <strong>of</strong> design.<br />
• Circulating water flow shall be within ±10% <strong>of</strong> design.<br />
• Barometric pressure shall be within ±1 in. Hg. (3.4 kpa) <strong>of</strong> design.<br />
For a valid test, the variations in the measured conditions over the one-hour test period<br />
must conform to the following:<br />
• Circulating water flow shall not vary by more than 2%.<br />
• Range shall not vary by more than 5%.<br />
• Total load shall not vary by more than 5%.<br />
• Entering wet bulb temperature shall not exceed ±2ºF (1°C). Note: <strong>Air</strong> temperature<br />
readings may fluctuate momentarily, but variations in the averages during the test period<br />
should not exceed the indicated value.<br />
• Btuh <strong>of</strong> a condenser are 15,000 btuh per ton.<br />
• With a 10º ∆T <strong>of</strong> the water the GPM is 3 gpm per ton, change the gpm changes the ∆T<br />
The duration <strong>of</strong> the test shall be for not less than one hour, starting after the system has<br />
reached steady state conditions. During the test, readings shall be taken <strong>and</strong> recorded at<br />
regular intervals. The frequency <strong>of</strong> test readings, the units <strong>of</strong> measure, <strong>and</strong> the number <strong>of</strong><br />
significant figures shall be as shown in Table 13.1.<br />
103
104<br />
Record test data on the NTT test data summary sheet (Appendix 13.1). Upon completion<br />
<strong>of</strong> the test, the sheet is signed by the NTT TAB engineer <strong>and</strong> any representatives <strong>of</strong> the<br />
manufacturer, purchaser, or owner who are present. Give one copy <strong>of</strong> each authenticated<br />
test form to each person signing the test form.<br />
Instrumentation<br />
Temperature measurements shall be made with calibrated mercury-in-glass or resistance<br />
thermometers. These thermometers must be accurate to ±O.1"F with indicators or<br />
recorders graduated in increments <strong>of</strong> not more than 0.2ºF (0.lºC).<br />
All air temperature measurements shall be made with mechanically aspirated<br />
psychrometer using the type <strong>of</strong> thermometers described above. The temperaturesensitive<br />
element shall be shielded from direct sunlight or other significant sources <strong>of</strong><br />
radiant heat.<br />
When measuring wet bulb temperature, cover the temperature-sensitive element with a<br />
wick continuously wetted with distilled water <strong>of</strong> a temperature approximately equal to the<br />
wet bulb temperature being measured. The wick shall fit snugly over, <strong>and</strong> extend at least<br />
3/4 inches (19 mm) past, the temperature-sensitive element. The air velocity over the<br />
element shall be at least 950 (4.8 m/s) <strong>and</strong> no greater than 1050 (5.3 m/s) feet per minute.<br />
Any <strong>of</strong> the following calibrated devices may be used to measure water flow rate:<br />
• Venturi or flow nozzle<br />
104
105<br />
• Orifice plate<br />
• Turbine meter (traverse)<br />
• Pitot tube (traverse)<br />
• Other mutually agreed upon flow measuring devices<br />
For these devices, ensure that the proper upstream <strong>and</strong> downstream flow conditions<br />
exist.<br />
Report <strong>of</strong> Results<br />
The report <strong>of</strong> test results must include:<br />
• A description <strong>of</strong> the cooling tower, including the name <strong>of</strong> the manufacturer, the model<br />
number, serial number, orientation, <strong>and</strong> principal dimensions.<br />
• A sketch <strong>of</strong> the installation showing the location <strong>of</strong> instrumentation for measuring<br />
water flow, water temperatures, air temperatures, etc. Note any buildings, walls,<br />
obstructions, or other equipment in the immediate vicinity <strong>of</strong> the tower being tested. Give<br />
particular attention to any equipment or facilities discharging heat or vapor near the<br />
tower.<br />
• A copy <strong>of</strong> all test data sheets, plus a single summary sheet tabulating all test data<br />
averages used in calculating results <strong>and</strong> comparing them to the associated design<br />
values for the same parameter (Appendix 13.1).<br />
• A copy <strong>of</strong> all calculations made in determining the result.<br />
• A brief summary stating the test result <strong>and</strong> mentioning any areas in which the test<br />
deviated from the test parameters.<br />
• The distribution <strong>of</strong> the report shood be limited to the parties directly involved in the<br />
test.<br />
Evaluating the Test<br />
Since a cooling tower test can seldom, if ever, be conducted at both design heat load <strong>and</strong><br />
design entering wet bulb temperature, the test procedure <strong>and</strong> method for calculating<br />
results must address several issues, including:<br />
• Establishing the maximum deviations between the design conditions <strong>and</strong> actual test<br />
conditions that can be allowed while still yielding a valid test result.<br />
• Specifying the instrumentation <strong>and</strong> procedures that must be used in order to obtain an<br />
accurate measurement <strong>of</strong> the actual cooling tower thermal performance.<br />
• Establishing a consistent procedure for comparing the measured performance to the<br />
required performance.<br />
The degree to which the test conditions may deviate from design <strong>and</strong> still yield a valid<br />
test, as set forth in the test parameters, has been accepted practice in the cooling tower<br />
105
106<br />
industry for many years. They reasonably meet the need to obtain test data close to the<br />
tower design conditions, while not imposing such stringent limits on the test conditions<br />
as to severely limit the opportunities for obtaining a test.<br />
Similarly, the instrumentation <strong>and</strong> procedures set forth in the test parameters are the<br />
culmination <strong>of</strong> many years experience in testing cooling towers <strong>of</strong> all sizes <strong>and</strong><br />
configurations. They have been shown to give consistent <strong>and</strong> repeatable results.<br />
Performance Test<br />
The objective <strong>of</strong> this test is to determine a performance factor (P.F.) for the tower that is<br />
constant at all heat load conditions <strong>and</strong> all entering (W) wet bulb conditions that may<br />
occur. The performance factor (P.F.) will be used to determine the performance <strong>of</strong> the<br />
tower at the design conditions.<br />
Following is an outline <strong>of</strong> the analysis that establishes this test procedure, according to<br />
applicable cooling tower factors <strong>and</strong> how they operate:<br />
• <strong>Water</strong> flow GPM <strong>and</strong> airflow across the tower are constant.<br />
• At constant heat load, the approach will decrease as the entering WB increases.<br />
Approach is defined as the difference between the temperature <strong>of</strong> the water leaving the<br />
tower <strong>and</strong> the wet bulb temperature <strong>of</strong> the air entering the tower.<br />
• Evaporation takes place in a tower but has no effect on the cooling <strong>of</strong> the water. It is<br />
simply a conversion <strong>of</strong> air sensible heat to latent heat.<br />
• For st<strong>and</strong>ard cooling towers, the heat rejected per ton <strong>of</strong> refrigeration is 15,000 BTU/Hr.<br />
(3 GPM with a 10º∆T)<br />
• At any point <strong>of</strong> test, the water, air, <strong>and</strong> fill arrangement combine to allow the air to<br />
remove a given percentage <strong>of</strong> the theoretical heat available to it. This percentage, called<br />
the Performance Factor (P.F.), will remain constant at any entering WB temperature <strong>and</strong><br />
heat load as long as the GPM (Vs), CFM (Vs), <strong>and</strong> fill do not change.<br />
Test Procedure<br />
During the test procedure, the following data is recorded with the same intervals <strong>and</strong> no<br />
greater deviations than outlined in 13.3.3:<br />
• <strong>Water</strong> temperature entering the tower.<br />
• <strong>Water</strong> temperature leaving the tower.<br />
• WB temperature <strong>of</strong> the air entering the tower (use table 11 to convert to enthalpy H2).<br />
• WB temperature <strong>of</strong> the air leaving the tower (use table 11 to convert to enthalpy H3).<br />
• <strong>Water</strong> flow rate GPM.<br />
106
107<br />
BTUH = GPM X 60 X 8.337 X ∆T <strong>of</strong> the water<br />
Tons = GPM X ∆T <strong>of</strong> the water / 30<br />
GPM = BTUH / 60 X 8.337 X ∆T <strong>of</strong> the water<br />
GPM = (Tons X 30) / ∆T <strong>of</strong> the water<br />
GPM = (<strong>Air</strong> Density X CFM X ∆ Enthalpy h1-h2) / (8.337 X <strong>Water</strong> ∆T) .<br />
CFM = (GPM X 8.337 X <strong>Water</strong> ∆T) / (<strong>Air</strong> Density X ∆ Enthalpy h1-h2)<br />
Example 12: Find the tons <strong>of</strong> a cooling tower with an entering water temperature <strong>of</strong> 90º<br />
<strong>and</strong> a leaving water temperature <strong>of</strong> 80º <strong>and</strong> a 145 gpm.<br />
Solution 1<br />
• GPM x 60 X 8.337 X ∆T <strong>of</strong> the water = BTUH<br />
• BTUH / 15,000 = Tons<br />
• 145 gpm X 60 X 8.337 X 10º ∆T = 725,319 btuh<br />
• 725,319 btuh / 15,000 = 48.35 tons<br />
Solution 2<br />
• GPM X ∆T <strong>of</strong> the water / 30 = tons<br />
• (145 gpm X 10º ∆T) / 30 = 48.33 tons<br />
Example 13: Find the GPM <strong>of</strong> a cooling tower with an entering water temperature <strong>of</strong> 90º<br />
<strong>and</strong> a leaving water temperature <strong>of</strong> 80º <strong>and</strong> a entering air temperature <strong>of</strong> 95º dry bulb <strong>and</strong><br />
67º wet bulb, leaving air temperature <strong>of</strong> 92º dry bulb <strong>and</strong> 84º wet bulb <strong>and</strong> a 10,167 CFM.<br />
Solution 1<br />
• GPM = (<strong>Air</strong> Density X CFM X ∆ Enthalpy h1-h2) / (8.337 X <strong>Water</strong> ∆T)<br />
• <strong>Air</strong> density <strong>of</strong> 92º dry bulb <strong>and</strong> 84º wet bulb is 0.071<br />
• Enthalpy <strong>of</strong> 92º dry bulb <strong>and</strong> 84º wet bulb is 48.13<br />
• Enthalpy <strong>of</strong> 95º dry bulb <strong>and</strong> 67º wet bulb is 31.38<br />
• <strong>Water</strong> ∆T is 10º<br />
• (0.071 X 10,167 X 16.75) / (8.337 X 10) = 12,091.10 / 83.37 = 145.02 gpm<br />
Analysis <strong>of</strong> the Test Data<br />
107
108<br />
The enthalpy (total heat see table 11) <strong>of</strong> the air at the leaving WB temperature minus the<br />
enthalpy <strong>of</strong> the air at the entering WB temperature determines the quantity <strong>of</strong> heat in<br />
BTU/LB. that the air picks up while passing through the tower. If this heat gain (enthalpy<br />
difference), is divided by the theoretical enthalpy difference that would result if the air left<br />
the tower at a wet bulb temperature equal to the temperature <strong>of</strong> the water entering the<br />
tower, the result is the Performance Factor. This theoretical enthalpy difference occurs at<br />
zero approach <strong>and</strong> represents a tower performance <strong>of</strong> 100%:<br />
Measure Enthalpy Difference / Theoretical Enthalpy Difference = Performance Factor (PF)<br />
If the water flow GPM <strong>and</strong> the airflow through the tower remain constant,<br />
then the P.F. will remain the same as the heat load <strong>and</strong> WB temperature change.<br />
With this as a basis, a cooling tower can be tested at a reasonable operating condition<br />
<strong>and</strong> from the data <strong>of</strong> this test calculate the performance <strong>of</strong> the tower at the specified full<br />
load conditions. It is possible to prepare a performance curve for the test tower at a given<br />
P.F. It has been found that the most useful curve is to plot approach vs. heat rejection at<br />
specified entering WB temperature, test water flow GPM <strong>and</strong> test P.F. From this curve,<br />
the engineer can determine if the condenser water system will satisfy the requirements <strong>of</strong><br />
the operation <strong>of</strong> the tower at a wide range <strong>of</strong> operating conditions. See Example A in<br />
Appendix 13.2.<br />
Cooling Tower Terms<br />
EWT = Entering water temperature ºF (ºC)<br />
LWT = Leaving water temperature ºF (ºC)<br />
EWB =<strong>Air</strong> entering tower wet bulb ºF (ºC)<br />
LWB =<strong>Air</strong> leaving tower wet bulbº F (ºC)<br />
GPM = Gallons <strong>of</strong> water per minute over<br />
d = <strong>Air</strong> density in lbs. per cubic ft. leaving (see tables 9)<br />
R = Range across tower = EWT - LWT<br />
A =Approach to wet bulb = LWT - EWB<br />
h = Enthalpy <strong>of</strong> air at a wet bulb temperature <strong>of</strong> EWT (see table 11)<br />
h1 = Enthalpy <strong>of</strong> air at LWB (see table 11)<br />
h2 = Enthalpy <strong>of</strong> air at EWB (see table 11)<br />
P.F. = Tower performance capacity factor. This is a percentage <strong>of</strong> the heat picked up by<br />
the air in passing through the tower to the amount it would have picked up if it had left<br />
the tower saturated at the EWT tower at test tower = (h2 – h3)/ (h-h3).<br />
THR = Total heat rejected by tower in BTU per minute = GPM x 8.337 x (EWT - LWT)<br />
108
109<br />
Lam = lbs. <strong>of</strong> air per minute through tower = THR / (h.2 - h3)<br />
CFM = Tower CFM = Lam / d (<strong>of</strong> leaving air)<br />
<strong>Water</strong> Temperature<br />
<strong>Water</strong> temperatures are to be measured using calibrated mercury-in-glass or resistance<br />
thermometers, accurate to 0.1ºF (0.1º"C) with indicators or recorders graduated in<br />
increments no greater than 0.2º"F (0.2º"C). The temperature-sensitive element must be<br />
carefully located so that the temperature being sensed is representative <strong>of</strong> the true<br />
average temperature <strong>of</strong> the bulk fluid.<br />
The hot water temperature entering the tower should be measured in the riser (s) leading<br />
to the tower inlet (s), as close as practical to the tower, or at the discharge <strong>of</strong> the inlet<br />
riser(s) into the flume or distribution box (es) on the tower (Figures 13.1 & 13.2).<br />
The cold-water temperatures should be measured on the discharge side <strong>of</strong> the system<br />
circulating pump (Figures 13.1 8z 13.2). If the temperature <strong>of</strong> the cold water leaving the<br />
pump is being measured through a bleed test valve (as shown in Figure 13.3), the<br />
average temperature must be corrected for the heat added by the pump <strong>and</strong> the valve.<br />
The test valve must be sufficiently opened to provide adequate quantities to establish<br />
accurate temperature measurements.<br />
109
110<br />
Cold-water temperatures should not be taken in the tower basin or by bleeding water<br />
from the basin or outlet pipe since temperature gradients <strong>of</strong> several degrees may exist in<br />
the basin <strong>and</strong> the suction piping extending from the tower to the pump. Only after the<br />
water is well-mixed by the pump can one be assured the measured temperature is<br />
representative <strong>of</strong> the true cold water temperature leaving the tower.<br />
Many cooling tower systems have an automatic or manual bypass arrangement (Figure<br />
13.4) used to control temperatures in the cooling loop by diverting hot water from the<br />
cooling tower riser into the cold water line leaving the tower or into the tower basin.<br />
Where such a bypass line exists, it is imperative it be shut<br />
The cold-water temperatures should be measured on the discharge side <strong>of</strong> the system<br />
circulating pump (Figures 13.1 8z 13.2). If the temperature <strong>of</strong> the cold water leaving the<br />
pump is being measured through a bleed test valve (as shown in Figure 13.3), the<br />
average temperature must be corrected for the heat added by the pump <strong>and</strong> the valve.<br />
The test valve must be sufficiently opened to provide adequate quantities to establish<br />
accurate temperature measurements. Cold-water temperatures should not be taken in the<br />
tower basin or by bleeding water from the basin or outlet pipe since temperature<br />
gradients <strong>of</strong> several degrees may exist in the basin <strong>and</strong> the suction piping extending<br />
from the tower to the pump. Only after the water is well-mixed by the pump can one be<br />
assured the measured temperature is representative <strong>of</strong> the true cold water temperature<br />
leaving the tower.<br />
Many cooling tower systems have an automatic or manual bypass arrangement (Figure<br />
13.4) used to control temperatures in the cooling loop by diverting hot water from the<br />
cooling tower riser into the cold water line leaving the tower or into the tower basin.<br />
Where such a bypass line exists, it is imperative it be shut with a liquid <strong>of</strong> high thermal<br />
conductivity (oil or water).<br />
Inlet <strong>Air</strong> Temperature Measurements<br />
The wet bulb temperature <strong>of</strong> the air entering the cooling tower is a required measurement<br />
on all tests. Similarly, the dry bulb temperature <strong>of</strong> the entering air stream is required on<br />
forced draft (blow through) towers to determine the density <strong>of</strong> the air entering the fan(s).<br />
Wet bulb temperature must be measured with mechanically aspirated psychrometer.<br />
Mount the psychrometer on tripods or other support devices so they remain stationary<br />
for the duration <strong>of</strong> the test. A sufficient number <strong>of</strong> instruments, located within four feet <strong>of</strong><br />
the cooling tower air inlet(s), shall be employed to ensure that the test average is an<br />
accurate representation <strong>of</strong> the true average inlet wet bulb temperature. See Figures 13.5<br />
<strong>and</strong> 13.6 for typical situations.<br />
110
111<br />
When dry bulb temperature measurement <strong>of</strong> the inlet air is made on forced draft (blow<br />
through) type towers for the purpose <strong>of</strong> density determination, a measurement accuracy<br />
<strong>of</strong> 2°F to 5°F (1ºC-2ºC) for the average inlet dry bulb temperature is usually satisfactory.<br />
In most cases this can be achieved by means <strong>of</strong> a single psychrometer situated at a<br />
representative location along an air inlet face.<br />
<strong>Water</strong> Flow Rate Measurement<br />
As specified in the test code, water flow rates may be measured by any <strong>of</strong> several<br />
procedures <strong>and</strong> devices. Since the circulating water, flow rate is one <strong>of</strong>, if not the single,<br />
most important test parameter; take considerable care to ensure it is measured<br />
accurately.<br />
Install the flow measurement station in a straight section <strong>of</strong> pipe with the proper<br />
distances between it <strong>and</strong> any upstream or down stream fittings. Specific<br />
recommendations for various flow measurement devices can be obtained from the<br />
manufacturer. In pipes smaller than 8 inches (200 mm), the preferred measurement<br />
device is a venturi, flow nozzle, or orifice plate. Alternatively, a calibrated turbine meter<br />
may be used. For pipes 9 inches (225 mm) <strong>and</strong> larger, any <strong>of</strong> the aforementioned devices<br />
111
112<br />
can be used. If these become too expensive or unwieldy, measure the flow by Pitot tube<br />
traverse.<br />
Taps for Pitot tube traverses can be installed in either vertical or horizontal pipe runs. As<br />
illustrated in Figure 13.7, the taps must be perpendicular to the pipe <strong>and</strong> at 90" from one<br />
another. Adequate clearance [roughly the pipe diameter, plus three feet (1 m)] must be<br />
available at each tap to install <strong>and</strong> position the Pitot tube.<br />
If make-up enters or blow down leaves the tower or the system at a point where it will<br />
affect any <strong>of</strong> the measured test values, they must either be shut <strong>of</strong>f for the duration <strong>of</strong> the<br />
test or the flow rates measured. Usually, these measurements lend themselves to a<br />
volumetric or bulk measurement procedure. In many instances, a water meter will have<br />
been installed in the make-up line <strong>and</strong> can be used for this purpose. In virtually all<br />
instances, the blow down can be valved <strong>of</strong>f during the test period.<br />
Fan Motor Power<br />
Most cooling tower fans are driven by electric motors <strong>of</strong> 480V or less. The preferred<br />
method for measuring power is to use a calibrated, clamp-on wattmeter to measure the<br />
KW input to the motor(s) <strong>and</strong> convert this to<br />
Horse power output using the motor manufacturer's efficiency values. Brake horsepower<br />
can be calculated.<br />
Wind Velocity<br />
When a cooling tower test is run under conditions <strong>of</strong> little or no wind, the parties to the<br />
test <strong>of</strong>ten may agree to forego measurement <strong>of</strong> wind velocity. Strict compliance with the<br />
test code, however, requires that wind velocity be measured with a meteorological<br />
anemometer <strong>and</strong> wind vane. For towers with an overall height <strong>of</strong> less than 20 feet (6 m),<br />
the point <strong>of</strong> measurement is 5 feet (1.5 m) above the basin curb at a distance 50 to 100<br />
feet (15-30 m) upwind <strong>of</strong> the tower.<br />
112
113<br />
GPM = FPM X Gallons per foot<br />
FPM = 1040 X √ VP<br />
113
114<br />
Example 14: Fine the tons <strong>of</strong> a condenser that has a 8” SCH 40 with a pressure <strong>of</strong><br />
23.347psig <strong>and</strong> a total pressure <strong>of</strong> 23.352 psig <strong>and</strong> a entering water <strong>of</strong> 85º <strong>and</strong> leaving<br />
water <strong>of</strong> 93º.<br />
Solution<br />
• Total pressure – Pressure = VP<br />
• FPM = 1040 X √ VP<br />
• GPM = FPM X Gallons per foot<br />
• Ton = GPM X 60 X 8.337 X ∆ Temperature <strong>of</strong> the water<br />
• 23.352 psig – 23.347 = 0.005 VP<br />
• 1040 X √ 0.005 = 73.54 FPM<br />
• 73.54 X 2.6 gallons per foot = 191.20 GPM<br />
• 191.20 X 60 X 8.337 X 8 = 765,136.5 btuh<br />
• 765,136.5 / 15,000 = 51.01 tons<br />
114