

2013 Corporate Responsibility Report

You also want an ePaper? Increase the reach of your titles
YUMPU automatically turns print PDFs into web optimized ePapers that Google loves.
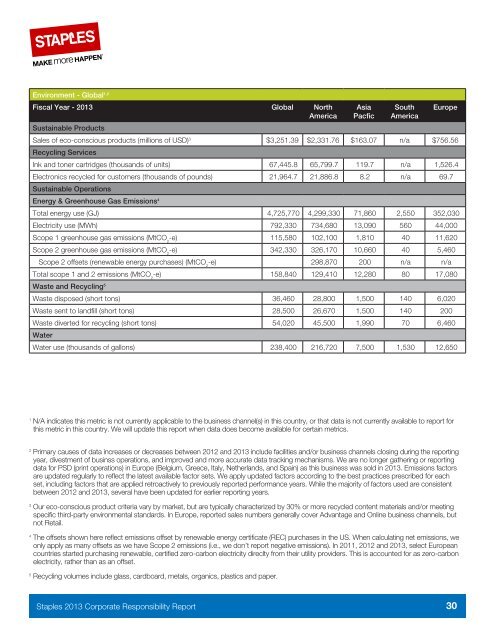
Environment - Global 1,2<br />
Fiscal Year - <strong>2013</strong> Global North<br />
America<br />
Sustainable Products<br />
Asia<br />
Pacfic<br />
South<br />
America<br />
Europe<br />
Sales of eco-conscious products (millions of USD) 3 $3,251.39 $2,331.76 $163.07 n/a $756.56<br />
Recycling Services<br />
Ink and toner cartridges (thousands of units) 67,445.8 65,799.7 119.7 n/a 1,526.4<br />
Electronics recycled for customers (thousands of pounds) 21,964.7 21,886.8 8.2 n/a 69.7<br />
Sustainable Operations<br />
Energy & Greenhouse Gas Emissions 4<br />
Total energy use (GJ) 4,725,770 4,299,330 71,860 2,550 352,030<br />
Electricity use (MWh) 792,330 734,680 13,090 560 44,000<br />
Scope 1 greenhouse gas emissions (MtCO 2<br />
-e) 115,580 102,100 1,810 40 11,620<br />
Scope 2 greenhouse gas emissions (MtCO 2<br />
-e) 342,330 326,170 10,660 40 5,460<br />
Scope 2 offsets (renewable energy purchases) (MtCO 2<br />
-e) 298,870 200 n/a n/a<br />
Total scope 1 and 2 emissions (MtCO 2<br />
-e) 158,840 129,410 12,280 80 17,080<br />
Waste and Recycling 5<br />
Waste disposed (short tons) 36,460 28,800 1,500 140 6,020<br />
Waste sent to landfill (short tons) 28,500 26,670 1,500 140 200<br />
Waste diverted for recycling (short tons) 54,020 45,500 1,990 70 6,460<br />
Water<br />
Water use (thousands of gallons) 238,400 216,720 7,500 1,530 12,650<br />
1<br />
N/A indicates this metric is not currently applicable to the business channel(s) in this country, or that data is not currently available to report for<br />
this metric in this country. We will update this report when data does become available for certain metrics.<br />
2<br />
Primary causes of data increases or decreases between 2012 and <strong>2013</strong> include facilities and/or business channels closing during the reporting<br />
year, divestment of businss operations, and improved and more accurate data tracking mechanisms. We are no longer gathering or reporting<br />
data for PSD (print operations) in Europe (Belgium, Greece, Italy, Netherlands, and Spain) as this business was sold in <strong>2013</strong>. Emissions factors<br />
are updated regularly to reflect the latest available factor sets. We apply updated factors according to the best practices prescribed for each<br />
set, including factors that are applied retroactively to previously reported performance years. While the majority of factors used are consistent<br />
between 2012 and <strong>2013</strong>, several have been updated for earlier reporting years.<br />
3<br />
Our eco-conscious product criteria vary by market, but are typically characterized by 30% or more recycled content materials and/or meeting<br />
specific third-party environmental standards. In Europe, reported sales numbers generally cover Advantage and Online business channels, but<br />
not Retail.<br />
4<br />
The offsets shown here reflect emissions offset by renewable energy certificate (REC) purchases in the US. When calculating net emissions, we<br />
only apply as many offsets as we have Scope 2 emissions (i.e., we don’t report negative emissions). In 2011, 2012 and <strong>2013</strong>, select European<br />
countries started purchasing renewable, certified zero-carbon electricity direclty from their utility providers. This is accounted for as zero-carbon<br />
electricity, rather than as an offset.<br />
5<br />
Recycling volumes include glass, cardboard, metals, organics, plastics and paper.<br />
Staples <strong>2013</strong> <strong>Corporate</strong> <strong>Responsibility</strong> <strong>Report</strong><br />
30