SAWE Report - Cal Poly San Luis Obispo
SAWE Report - Cal Poly San Luis Obispo
SAWE Report - Cal Poly San Luis Obispo

You also want an ePaper? Increase the reach of your titles
YUMPU automatically turns print PDFs into web optimized ePapers that Google loves.
<strong>SAWE</strong> Paper No. 3232<br />
Category No. 10<br />
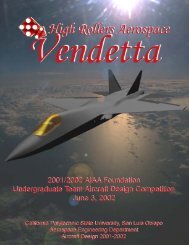
The Vendetta<br />
Preliminary Design <strong>Report</strong><br />
by<br />
<strong>Cal</strong> <strong>Poly</strong>, <strong>San</strong> <strong>Luis</strong> <strong>Obispo</strong> Design Team<br />
consisting of<br />
Kolby Keiser Chris Droney (Team Leader) Nathan Schnaible<br />
Chris Atkinson Christopher Maglio Dan Salluce<br />
For Presentation at the<br />
61 st Annual Conference<br />
of<br />
Society of Allied Weight Engineers, Inc.<br />
Virginia Beach, Virginia 20-22 May, 2002<br />
Society of Allied Weight Engineers<br />
Serving the Aerospace-Shipbuilding-Land Vehicles and Allied Industries<br />
Permission to publish this paper, in full or in part, with credit to the author and the Society may be<br />
obtained, by request, to:<br />
Society of Allied Weight Engineers, Inc.<br />
P.O. Box 60024, Terminal Annex<br />
Los Angeles, CA 90060<br />
The Society is not responsible for statements or opinions in papers or discussions at the meeting.
Abstract<br />
<strong>Cal</strong> <strong>Poly</strong> proudly presents the Vendetta, a supersonic bomber designed to meet the criterion<br />
specified by the AIAA 2001/2002 Undergraduate Team Aircraft Design Request for Proposal.<br />
The mission to be flown by the Vendetta consists of a 1,750 nautical mile radius, all of which<br />
must be flown at Mach 1.6 at or above 50,000 feet. The aircraft must have low frontal radar<br />
cross-section and also be capable of dropping a 9,000-pound weapons payload. The Vendetta is<br />
being designed to replace the stealthy F-117 Nighthawk and B-2 Spirit as well as the supersonic<br />
F-15 Eagle and B-1 Lancer. The Vendetta’s current takeoff gross weight is 125,000 pounds and<br />
its empty weight is 57,000 pounds. Furthermore, an analysis from a low observables standpoint<br />
has been made possible by publicly accessible RCS code. The component weight buildup of the<br />
Vendetta has been developed using both class I and class II methodologies as well as by<br />
assigning mass properties to an actual solid model of the aircraft. Several challenges concerning<br />
the balance of the aircraft have been introduced by the immediate and abrupt shift in the<br />
aerodynamic center due to the acceleration from subsonic to supersonic Mach numbers.<br />
Solutions to this problem have been developed and will be presented in the report.<br />
i
Table of Contents<br />
Abstract______________________________________________________________________ i<br />
Table of Contents _____________________________________________________________ ii<br />
List of Figures________________________________________________________________ iv<br />
List of Tables _______________________________________________________________ vii<br />
Nomenclature _______________________________________________________________viii<br />
1 Introduction______________________________________________________________ 1<br />
2 Defining the Design Domain ________________________________________________ 7<br />
3 Configuration ___________________________________________________________ 10<br />
4 Stealth Considerations ____________________________________________________ 16<br />
5 Aerodynamics ___________________________________________________________ 22<br />
5.1 Wing Sizing ________________________________________________________ 22<br />
5.2 Wing Planform ______________________________________________________ 23<br />
5.3 Wing Thickness _____________________________________________________ 26<br />
5.4 Airfoil _____________________________________________________________ 28<br />
5.5 Lift Curve __________________________________________________________ 28<br />
5.6 Drag_______________________________________________________________ 31<br />
6 Propulsion ______________________________________________________________ 34<br />
6.1 Engine Selection _____________________________________________________ 34<br />
6.2 Inlets ______________________________________________________________ 41<br />
6.3 S-Duct _____________________________________________________________ 46<br />
6.4 Nozzle _____________________________________________________________ 47<br />
7 Materials and Structure____________________________________________________ 48<br />
8 Landing Gear ___________________________________________________________ 52<br />
9 Weight & Balance________________________________________________________ 55<br />
10 Stability and Control____________________________________________________ 60<br />
11 Performance __________________________________________________________ 71<br />
11.1 Performance Requirements_____________________________________________ 71<br />
11.2 Specific Excess Power Requirements_____________________________________ 74<br />
11.3 Turn Rate Requirement________________________________________________ 76<br />
11.4 Mission Requirements ________________________________________________ 78<br />
11.5 Takeoff & Landing ___________________________________________________ 79<br />
11.6 Performance Summary ________________________________________________ 81<br />
11.7 Alternate Missions ___________________________________________________ 82<br />
12 Payload ______________________________________________________________ 84<br />
13 Cockpit ______________________________________________________________ 86<br />
14 Systems ______________________________________________________________ 90<br />
14.1 Auxiliary Power Generation System _____________________________________ 90<br />
14.2 Vehicle Management System ___________________________________________ 91<br />
14.3 Fuel System_________________________________________________________ 92<br />
15 Manufacturing_________________________________________________________ 94<br />
16 Cost Analysis _________________________________________________________ 96<br />
Appendix___________________________________________________________________ 98<br />
Threats Chart______________________________________________________________ 98<br />
ii
Diffuser Efficiency _________________________________________________________ 99<br />
Literal Factor Forms ________________________________________________________ 99<br />
Foldout 1 ________________________________________________________________ 101<br />
Foldout 2 ________________________________________________________________ 103<br />
The Vendetta Design Team____________________________________________________ 105<br />
References_________________________________________________________________ 107<br />
iii
List of Figures<br />
Figure 1.1 - Design Mission Profile _______________________________________________ 1<br />
Figure 1.2 - F-111 Aardvark _____________________________________________________ 3<br />
Figure 1.3 - F-15 Strike Eagle____________________________________________________ 4<br />
Figure 1.4 - F-117 Night Hawk___________________________________________________ 4<br />
Figure 1.5 - B-1B Lancer _______________________________________________________ 5<br />
Figure 1.6 - B-2 Spirit__________________________________________________________ 5<br />
Figure 2.1 - Historical Weight Fractions ___________________________________________ 7<br />
Figure 2.2 - Constraint Plot______________________________________________________ 9<br />
Figure 3.1 - Nergal ___________________________________________________________ 10<br />
Figure 3.2 - Jackhammer ______________________________________________________ 10<br />
Figure 3.3 - Interdictor ________________________________________________________ 10<br />
Figure 3.4 - Big Paulie ________________________________________________________ 10<br />
Figure 3.5 - Initial Configuration ________________________________________________ 11<br />
Figure 3.6 - Radar Return of Initial Configuration___________________________________ 12<br />
Figure 3.7 - Second Configuration _______________________________________________ 13<br />
Figure 3.8 - Current Configuration _______________________________________________ 14<br />
Figure 3.9 - Inboard Layout ____________________________________________________ 14<br />
Figure 3.10 - Inboard Layout Continued __________________________________________ 15<br />
Figure 4.1 - Stealth Considerations_______________________________________________ 16<br />
Figure 4.2 - RCS Model Faceting________________________________________________ 17<br />
Figure 4.3 - Radar Cross Section at 0º Lookup Angle ________________________________ 19<br />
Figure 4.4 - Radar Cross Sections at 15º Lookup Angle ______________________________ 20<br />
Figure 4.5 - Radar Cross Sections for a Radial Sweep________________________________ 21<br />
Figure 5.1 - Optimization of Wing Area and Aspect Ratio ____________________________ 22<br />
Figure 5.2 - Effect of Wing Leading and Trailing Edge Sweep on Aircraft RCS ___________ 24<br />
Figure 5.3 - Wing Planform ____________________________________________________ 25<br />
Figure 5.4 - Effect of Root Chord Thickness on Wing Weight and Cross Sectional Area ____ 26<br />
Figure 5.5 - Effect of Root Chord Thickness on Fuel Burn ____________________________ 27<br />
Figure 5.6 - Airfoil Section at MAC______________________________________________ 28<br />
Figure 5.7 - Airfoil Section at Tip of Trailing Edge Flap______________________________ 28<br />
Figure 5.8 – Variation in Lift Curve Slope with Mach Number_________________________ 29<br />
Figure 5.9 - Lift Distribution of Wing with and without Twist _________________________ 30<br />
Figure 5.10 - Subsonic Wing Lift Curve __________________________________________ 30<br />
Figure 5.11 - Transonic Area Distribution _________________________________________ 31<br />
Figure 5.12 - Supersonic Area Distribution (Mach 1.6) _______________________________ 32<br />
Figure 5.13 - Drag Build-Up at 50,000 ft, Mach 1.6, Maneuver Weight, and 5% Static Margin 33<br />
Figure 6.1 - VAATE Goals_____________________________________________________ 38<br />
Figure 6.2 - Thrust Curves for Altitudes from Sea Level to 70,000 ft (21,300 m)___________ 39<br />
Figure 6.3 - Military TSFC Curves for Altitudes from Sea Level to 70,000 ft (21,300 m) ____ 40<br />
Figure 6.4 - Engine Sizing Plot__________________________________________________ 41<br />
Figure 6.5 - Optimum Deflection Angle for Mach 1.6 Flow ___________________________ 42<br />
Figure 6.6 - Pressure Recovery for a Two Shock versus Three Shock Inlet _______________ 42<br />
Figure 6.7 - Inlet Area Ratio____________________________________________________ 43<br />
iv
Figure 6.8 - Cost Association with Inlet Shocks_____________________________________ 44<br />
Figure 6.9 - Off Design Area Required for Engine Mass Flow _________________________ 45<br />
Figure 6.10 - Vendetta S-Duct __________________________________________________ 46<br />
Figure 6.11 - Diffuser Angle to the Engine Face ____________________________________ 46<br />
Figure 7.1 - Structure Buildup for Vendetta ________________________________________ 48<br />
Figure 7.2 - Wing Attachment Detail _____________________________________________ 49<br />
Figure 7.3 - Empennage Structural Layout_________________________________________ 50<br />
Figure 7.4 - V-n Diagram for Vendetta____________________________________________ 50<br />
Figure 8.1 - Main Gear Structural Attachment Point _________________________________ 52<br />
Figure 8.2 - Landing Gear Configuration Trade Study________________________________ 53<br />
Figure 8.3 - Main Gear Retraction Sequence _______________________________________ 53<br />
Figure 8.4 - Nose Gear and Main Gear Retraction Schemes ___________________________ 53<br />
Figure 8.5 - Completed Landing Gear ____________________________________________ 54<br />
Figure 8.6 - Vendetta with MJ-1 Lift Truck and 2000lb JDAM_________________________ 54<br />
Figure 9.1- Principle Axes _____________________________________________________ 56<br />
Figure 9.2 - Center of Gravity Excursion __________________________________________ 58<br />
Figure 10.1 - Longitudinal X-Plot at Mach 0.3 _____________________________________ 61<br />
Figure 10.2 - Horizontal Area Required for Static Stability with Cant Angle ______________ 62<br />
Figure 10.3 - Vertical Area Required for Static Stability with Cant Angle ________________ 63<br />
Figure 10.4 - Radar Cross Section Impact of 20° vs. 30° Vertical Cant Angle _____________ 64<br />
Figure 10.5 - Vendetta Empennage Configuration ___________________________________ 66<br />
Figure 10.6 - Mach Tuck Illustrated ______________________________________________ 66<br />
Figure 10.7 - Pitch Break Characteristics __________________________________________ 68<br />
Figure 10.8 - Pheagle Simulator _________________________________________________ 70<br />
Figure 10.9 - Flight Cab and Instruments __________________________________________ 70<br />
Figure 10.10 - Graphics and Environment _________________________________________ 70<br />
Figure 10.11 - Heads up Display ________________________________________________ 70<br />
Figure 11.1 - Fuel Consumption Envelope at Average Climb Weight____________________ 72<br />
Figure 11.2 - Drag on Aircraft in Loiter Conditions__________________________________ 73<br />
Figure 11.3 - 1g Military Specific Excess Power Envelope at Maneuver Weight ___________ 75<br />
Figure 11.4 - 1g Maximum Specific Excess Power Envelope at Maneuver Weight _________ 75<br />
Figure 11.5 - 2g Maximum Specific Excess Power Envelope at Maneuver Weight _________ 76<br />
Figure 11.6 - Maneuverability Diagram at 15,000 ft (4,572 m) and Maneuver Weight ______ 77<br />
Figure 11.7 - Fuel Consumption over Mission ______________________________________ 78<br />
Figure 11.8 - MPRL with 8 × 2,000 lb (907 kg) JDAM’s _____________________________ 82<br />
Figure 12.1 - L to R configurations 1, 2, 3 _________________________________________ 84<br />
Figure 12.2 - 180 inch MPRL___________________________________________________ 84<br />
Figure 12.3 - Ballute and Sabot _________________________________________________ 84<br />
Figure 12.4 - Bomb Bay Door Retraction Scheme___________________________________ 85<br />
Figure 12.5 - 30in (76.2cm) Ejector rack __________________________________________ 85<br />
Figure 12.6 - LAU-142A Ejection Sequence _______________________________________ 85<br />
Figure 12.7 - (8) 2000lb JDAM + MPRL__________________________________________ 85<br />
Figure 13.1 - Cockpit Width Trade Study _________________________________________ 86<br />
Figure 13.2 - Forward fuselage Comparisons_______________________________________ 86<br />
Figure 13.3 - Virtual Cockpit Model _____________________________________________ 87<br />
v
Figure 13.4 – Rectilinear Vision Plot of Forward Cockpit Position______________________ 87<br />
Figure 13.5 - Cockpit Display Arrangement________________________________________ 88<br />
Figure 13.6 - Helmet Mounted HUD _____________________________________________ 88<br />
Figure 13.7 - ACES II Ejection Seat______________________________________________ 89<br />
Figure 13.8 - AFCPS__________________________________________________________ 89<br />
Figure 14.1 - Sundstrand APS 3200 Location ______________________________________ 90<br />
Figure 14.2 - Fuel Tank Locations in Vendetta _____________________________________ 92<br />
Figure 14.3 - Fuel System Architecture ___________________________________________ 92<br />
Figure 14.4 - Retractable in-flight refueling boom ports, F22, F-117, B-2 ________________ 92<br />
Figure 15.1 - Routing Tunnel ___________________________________________________ 94<br />
Figure 15.2 - Manufacturing Breaks______________________________________________ 94<br />
Figure 15.3 - Assembly Line ___________________________________________________ 95<br />
Figure 16.1 - Cost Analysis ____________________________________________________ 96<br />
Figure 16.2 - Operating Cost ___________________________________________________ 97<br />
Figure 16.3 - Lifecycle Cost ____________________________________________________ 97<br />
vi
List of Tables<br />
Table 1.I - Required Weapons Loadout ____________________________________________ 1<br />
Table 1.II - Summary of Design Requirements ______________________________________ 2<br />
Table 1.III - Comparison of the F-111, F-117, B-2, B-1B, and F-15E_____________________ 6<br />
Table 2.I - Weight Fractions & Weights____________________________________________ 7<br />
Table 2.II - Weight Fraction Assumptions __________________________________________ 8<br />
Table 2.III - Constraint Assumptions ______________________________________________ 8<br />
Table 4.I - Common Ground Radars______________________________________________ 18<br />
Table 5.I - Wing Measurements _________________________________________________ 25<br />
Table 6.I - Engine Specifications of RFP Supplied Engine ____________________________ 34<br />
Table 6.II - RFP Dimensions Compared to the Snecma Olympus _______________________ 36<br />
Table 6.III - IHPTET Goals ____________________________________________________ 36<br />
Table 7.I - Materials Selection __________________________________________________ 51<br />
Table 9.I - Initial Component Weight Buildup______________________________________ 55<br />
Table 9.II - Final Component Weight Buildup______________________________________ 56<br />
Table 9.III - Inertia Estimation __________________________________________________ 56<br />
Table 10.I - Historical Aircraft Tail Volume Coefficients _____________________________ 60<br />
Table 10.II - Pitching Moment Coupling with Rudder Deflection for Various Vertical Cant<br />
Angles _________________________________________________________________ 64<br />
Table 10.III - Rudder Control Power Results for OEI Condition________________________ 65<br />
Table 10.IV - Longitudinal and Lateral Dynamic Mode Conformity with MIL-8785C ______ 69<br />
Table 11.I - RFP Performance Requirements_______________________________________ 71<br />
Table 11.II - RFP Design Mission _______________________________________________ 71<br />
Table 11.III - Detailed Design Mission ___________________________________________ 73<br />
Table 11.IV - Performance Measures of Merit______________________________________ 74<br />
Table 11.V - Mission Results ___________________________________________________ 78<br />
Table 11.VI - Fuel Consumption by Mission Segment _______________________________ 79<br />
Table 11.VII - Takeoff Flight Profile _____________________________________________ 79<br />
Table 11.VIII - Landing Flight Profile ____________________________________________ 80<br />
Table 11.IX - Takeoff Results __________________________________________________ 80<br />
Table 11.X - Landing Results ___________________________________________________ 81<br />
Table 11.XI - Performance Summary_____________________________________________ 81<br />
Table 11.XII - Alternate Mission Results__________________________________________ 83<br />
Table 13.I - Military Vision Specifications ________________________________________ 87<br />
Table 14.I - APU Selection Table________________________________________________ 90<br />
Table 14.II - Fuel System Sizing Requirements _____________________________________ 93<br />
vii
Nomenclature<br />
AIAA American Institute of Aeronautics and Astronautics<br />
A max Maximum Cross Sectional Area, ft 2<br />
AR Aspect Ratio<br />
C D Drag Coefficient<br />
C D parasite Parasite Drag Coefficient<br />
C D0 Zero Lift Drag Coefficient<br />
C Di Induced Drag Coefficient<br />
C Dwave Wave Drag Coefficient<br />
Cf Skin Friction Coefficient<br />
CG Center of Gravity, ft, in<br />
C L Lift Coefficient<br />
C l Section Lift Coefficient<br />
C Lmax Maximum Wing Lift Coefficient<br />
D Drag, lb<br />
F F Form Factor<br />
FS Fuselage Station<br />
L Length of Fuselage, ft<br />
L Lift, lb<br />
L/D Lift to Drag Ratio<br />
L HT Lever Arm of Horizontal Tail<br />
L VT Lever Arm of Vertical Tail<br />
M Mach Number<br />
M Mach Number<br />
MAC Mean Aerodynamic Chord, ft<br />
M cd0 max Mach Number for Maximum Wave Drag<br />
M cr Critical Mach Number<br />
NPF Net Propulsive Force, lb<br />
OEI One Engine Inoperable<br />
P Pressure, lb/ft 2<br />
P s Specific Excess Power, ft/s<br />
Q Interference Factor<br />
R Gas Constant, ft 2 /s 2 R<br />
RCS Radar Cross-Section<br />
Re L Reynolds Number Based on Length<br />
Re Lcutoff Cutoff Reynolds Number<br />
RFP Request for Proposal<br />
S Sutherland’s Constant, R<br />
S Wing Reference Area, ft 2<br />
SFC Thrust Specific Fuel Consumption, lb/lb hr, lb/lb s<br />
S HT Horizontal Tail Planform Area<br />
SL, Sea Level<br />
S ref Wing Reference Area, ft 2<br />
viii
S VT Vertical Tail Planform Area<br />
S w Wing Reference Area, ft 2<br />
S wet Wetted Area, ft 2<br />
T Thrust, lb<br />
T Temperature, R<br />
T/W Thrust to Weight Ratio<br />
T available Available Thrust, lb<br />
TOGW Takeoff Gross Weight, lb<br />
T required Required Thrust, lb<br />
TSFC Thrust Specific Fuel Consumption, lb/lb hr, lb/lb s<br />
V Velocity, knots, ft/sec<br />
V H Horizontal Tail Volume Coefficient<br />
V stall Stall Velocity, knots, ft/s<br />
V TD Touchdown Velocity, knots, ft/s<br />
V TO Takeoff Velocity, knots, ft/s<br />
V V Vertical Tail Volume Coefficient<br />
W Weight, lb<br />
W Fuel Flow Rate, slugs/s<br />
F<br />
W/S Wing Loading, lb/ft 2<br />
a Speed of Sound, ft/s<br />
a Temperature Lapse Rate in Troposphere, R/ft<br />
c Chord<br />
c Mean Aerodynamic Chord, ft<br />
c Mean Aerodynamic Chord, ft<br />
w<br />
c root Root Chord, ft<br />
c tip Tip Chord, ft<br />
e Span Efficiency Factor<br />
f Component Fineness Ratio<br />
g Acceleration Due to Gravity, ft/s 2<br />
h Altitude, ft<br />
k Surface Roughness, ft<br />
k 1 Induced Drag Coefficient<br />
l Length of Drag Component, ft<br />
n Load Factor<br />
⎛ g ⎞<br />
n Atmospheric Constant, ⎜n<br />
= = 5.2561⎟<br />
⎝ aR ⎠<br />
q Dynamic Pressure, lb/ft 2<br />
s Distance, n miles, ft<br />
t Time, s<br />
t Thickness of Wing to Chord Ratio<br />
y mac y Location of Mean Aerodynamic Chord, ft<br />
Λ LE Leading Edge Sweep, degrees, rad.<br />
Λ t max Sweep of Position of Maximim Thickness, degrees, rad.<br />
Trailing Edge Sweep, degrees, rad.<br />
Λ TE<br />
ix
α Angle of Attack, degrees, rad.<br />
α eff Effective Angle of Attack, degrees, rad.<br />
α i Angle of Attack Induced by Downwash, degrees, rad.<br />
δ T Engine Correction Factor<br />
γ Specific Heat Ratio<br />
γ Climb Angle, degrees, rad.<br />
λ Taper Ratio<br />
µ Dynamic Viscosity, lb s/ft 2<br />
µ brake Braking Coefficient of Friction<br />
µ roll Rolling Coefficient of Friction<br />
θ T Engine Correction Factor<br />
ρ Density, slugs/ft 3<br />
ψ Yaw Angle, degrees, rad.<br />
Subscripts<br />
0 Sea-Level Value<br />
∗ Value at Tropopause<br />
x
1 Introduction<br />
Every year, the American Institute of Aeronautics and Astronautics (AIAA) sponsors collegiate<br />
design competitions. The request for proposal (RFP) for the 2001-2002 team undergraduate<br />
aircraft design competition outlined the requirement for a stealth supersonic interdictor. The<br />
interdictor is introduced with a design mission as shown in Figure 1.1. The payload specified for<br />
this design mission is shown in Table 1.I. Because multiple weapon load outs are specified, it is<br />
clear that this, as with any modern aircraft, must be suited to more than one role.<br />
The RFP also gives many requirements for the aircraft. These include operating constraints as<br />
well as performance requirements. The design requirements are summarized in Table 1.II.<br />
External tanks may be used but must be retained for the duration of the flight. Bomb pylons may<br />
also be used suggesting the possibility of a non-stealth configuration. Another Important factor<br />
is that the aircraft must cost less than 150 million dollars. This is a very small price tag for an<br />
aircraft of this size and complexity.<br />
Figure 1.1 - Design Mission Profile<br />
Table 1.I - Required Weapons Loadout<br />
Loading # (Quantity) Weapon<br />
1 - Design (4) 2000 lb (907 kg) JDAM + (2) AIM-120<br />
2 (4) Mk-84 LDGP + (2) AIM-120<br />
3 (4) GBU-27 + (2) AIM-120<br />
4 (4) AGM-154 JSOW + (2) AIM-120<br />
5 (16) 250 lb (113 kg) Small Smart Bomb<br />
1
Table 1.II - Summary of Design Requirements<br />
Area Design Requirement Value (if applicable)<br />
Misc.<br />
Crew<br />
500 lb (227 kg), 2 pilots, single pilot operation<br />
Structure<br />
Fuel<br />
Stability<br />
Observables<br />
Operation<br />
Positive g’s<br />
7 (50% Internal Fuel)<br />
Negative g’s<br />
3 (50% Internal Fuel)<br />
Dynamic Pressure<br />
2,133 psf (102 kPa)<br />
Factor Of Safety 1.5<br />
JP-8<br />
Self Sealing<br />
Static Margin 10% to – 30%<br />
Active Flight Controls for Unstable Aircraft<br />
RCS (Front Aspect)<br />
0.05 m 2 , frequency range 1 – 10 GHz<br />
Balanced IR, Visual, Acoustical, RCS<br />
Internal Stores<br />
Runway Length 8,000 ft (2,438 m)<br />
Operate from NATO Airports<br />
All Weather Weapons Delivery<br />
Cost<br />
Max Cost<br />
Minimize Life Cycle Costs<br />
$150 Million, 2000 dollars<br />
Performance<br />
Supercruise Mission Radius<br />
Specific Excess Power<br />
1-g, Mach 1.6, 50,000 ft, Dry<br />
1-g, Mach 1.6, 50,000 ft, Wet<br />
2-g, Mach 1.6, 50,000 ft, Wet<br />
Instantaneous Turn Rate, Mach 0.9, 15,000 ft<br />
1,750 nm (3,240 km)<br />
0 ft/sec (0 m/s)<br />
200 ft/sec (61 m/s)<br />
0 ft/sec (0 ft/s)<br />
8 deg/sec<br />
2
The RFP also lists several aircraft that collectively fulfill the mission of the proposed interdictor.<br />
These are each outlined below.<br />
F-111 - “Aardvark”<br />
The F-111 (Figure 1.2, Table 1.III) is specifically mentioned as the predecessor to the aircraft<br />
requested in the RFP. The F-111 officially entered service in 1967 and was retired in 1996; a<br />
replacement is badly needed. It has been partially replaced by several aircraft, each outlined in<br />
detail in the sections to follow. The F-111 is a very large aircraft capable of carrying a 31,000 lb<br />
(14,061 kg) payload over 2,000 nm (3,704 km). Both the payload and combat radius are large<br />
thus yielding a 91,000 lb (41,276 kg) aircraft. Though the F-111 is capable of Mach 2.2, but it<br />
does not cruise supersonically. The F-111 was designed for a very different mission than the one<br />
outlined in the RFP. The F-111 was actually designed to cruise subsonically to the target area,<br />
dash in supersonically at low level, drop its payload, and fly out of the threat area quickly. After<br />
retiring the aircraft, the air force decided a new aircraft was needed to drop precision weapons<br />
from remote airfields with minimal support.<br />
F-15E - “Strike Eagle”<br />
Figure 1.2 - F-111 Aardvark<br />
The F-15E Strike Eagle (Figure 1.3, Table 1.III) partially filled the role of the F-111 after it was<br />
retired. The F-15E was designed to be capable of both air superiority and ground attack<br />
missions. Superior maneuverability was achieved with the F-15E due to its high thrust-to-weight<br />
ratio and low wing loading.<br />
3
Figure 1.3 - F-15 Strike Eagle<br />
F-117 – “Night Hawk”<br />
The Night Hawk (Figure 1.4, Table 1.III) also aided in the replacement of the F-111. However,<br />
it has a vastly reduced payload capacity and a limited range. The F-111 is also not capable of<br />
supersonic speeds and is thus more vulnerable if it were detected. If a supersonic aircraft were<br />
detected, the window of opportunity for an attack is relatively small. Thus, faster aircraft have a<br />
tendency to be less venerable. Due to the small payload and high maintenance of the first<br />
generation stealth technology, the F-117 is a poor replacement for the F-111.<br />
Figure 1.4 - F-117 Night Hawk<br />
4
B-1B – “Lancer”<br />
The B-1 has never been a successful aircraft. Until the war against the Taliban, the B-1B was<br />
never used in combat. Originally it was designed to have a mission much like the one specified<br />
in the RFP. When the proposal for a high altitude supersonic bomber was withdrawn, politics<br />
wouldn’t allow the B-1 to vanish. The aircraft was converted into the B-1B. The B model was<br />
designated as a low level subsonic bomber much like the F-111 was. The B-1 is an expensive<br />
aircraft to operate due to its vast size. A picture and table of data are also provided for this<br />
aircraft (Figure 1.5, Table 1.III).<br />
B-2 – “Spirit”<br />
Figure 1.5 - B-1B Lancer<br />
The B-2 (Figure 1.6, Table 1.III) is a large stealth subsonic bomber. It is designed to carry vast<br />
amounts of payloads long distances undetected. The B-2 is a large aircraft that is very costly to<br />
operate.<br />
Figure 1.6 - B-2 Spirit<br />
5
Table 1.III - Comparison of the F-111, F-117, B-2, B-1B, and F-15E<br />
Manufacturer Lockheed<br />
General<br />
Dynamics<br />
Boeing Northrop Rockwell<br />
Type F-117 FB-111A F-15E B-2 B-1B<br />
b - ft<br />
(m)<br />
43.6<br />
(13.3)<br />
32.0<br />
(9.2)<br />
42.8<br />
(13.0)<br />
172.0<br />
(52.4)<br />
78.2<br />
(23.8)<br />
AR – – 3 – –<br />
L – ft<br />
(m)<br />
H – ft<br />
(m)<br />
Wing - ft 2<br />
(m 2 )<br />
W oe – lb<br />
(kg)<br />
W pl – lb<br />
(kg)<br />
W f – lb<br />
(kg)<br />
W to – lb<br />
(kg)<br />
66.6<br />
(20.3)<br />
12.5<br />
(3.8)<br />
913<br />
(84.8)<br />
29,500<br />
(133,801)<br />
5,000<br />
(2,267)<br />
73.5<br />
(22.4)<br />
17.1<br />
(5.21)<br />
–<br />
46,171<br />
(20,943)<br />
31,500<br />
(14,488)<br />
– –<br />
52,501<br />
(23,814)<br />
91,492<br />
(41,500)<br />
63.7<br />
(19.4)<br />
18.5<br />
(5.6)<br />
608<br />
(56.5)<br />
32,000<br />
(14,515)<br />
24,500<br />
(11,113)<br />
13,122<br />
(5,952)<br />
81,000<br />
(36,740)<br />
69.0<br />
(21)<br />
17.0<br />
(5.2)<br />
5274<br />
(490.0)<br />
153,700<br />
(69,717)<br />
40,001<br />
(18,144)<br />
200,003<br />
(90,720)<br />
375,998<br />
(170,550)<br />
147.0<br />
(44.8)<br />
34.0<br />
(10.4)<br />
1950<br />
(181.1)<br />
192,001<br />
(87,090)<br />
133,999<br />
(60,780)<br />
194,999<br />
(88,450)<br />
477,003<br />
(216,365)<br />
Max power loading – – 1.73 4.86 –<br />
Max level (Mach) 0.9 2.2 2.5 0 1.25<br />
Max combat radius<br />
nm<br />
Service Ceiling - ft<br />
(m)<br />
570 2,750 686 6,300 6,479<br />
–<br />
50,853<br />
(15,500)<br />
–<br />
50,000<br />
(15,240)<br />
The solution to the RFP is not a trivial one. The aircraft will have to be well area ruled and have<br />
a low frontal cross-section in order to minimize wave drag. The goal of this design is to meet or<br />
exceed RFP requirements while minimizing manufacturing and operating costs.<br />
–<br />
6
2 Defining the Design Domain<br />
The first estimation of aircraft weight used the iterative weight fraction method outlined in<br />
Roskam. This method calculates the weight fraction for each mission segment. The initial<br />
takeoff weight was guessed and the resulting empty weight was calculated. The resulting weight<br />
generally yields an unrealistic total weight fraction. In order to check the realism of the aircrafts<br />
weight fraction, a database of aircraft similar in mission was compiled. The aircraft gross<br />
takeoff weight was iterated until the total weight fraction landed on the historical trend. This<br />
trend is shown in Figure 2.1. The weights generated by this method include gross takeoff<br />
weight, fuel weight, and landing weight. The results of the weight fraction method are shown in<br />
Table 2.I. The assumptions made to generate the weight fractions are shown in Table 2.II.<br />
Vendetta Estimated Weight Fractions<br />
Cruise Back<br />
16%<br />
Reserve<br />
6%<br />
Misc.<br />
5%<br />
Warm -up &<br />
Takeoff<br />
6% Initial Climb<br />
11%<br />
Dash Back<br />
14%<br />
Dash Out<br />
17%<br />
Cruise Out<br />
25%<br />
Figure 2.1 - Historical Weight Fractions<br />
Table 2.I - Weight Fractions & Weights<br />
Mission Segment Weights<br />
Weights<br />
Start/Takeoff 6% Takeoff 108,400 lb (49,169 kg)<br />
Climb To Cruise 11% Empty 51,600 lb (23,405 kg)<br />
Cruise-Out 25% Fuel 47,600 lb (21,591 kg)<br />
Dash-out 17% Payload 9,054 lb (4,107 kg)<br />
Dash-Back 14% Fuel Weight Fraction 47.6%<br />
Cruise-Back 16%<br />
45 Minute Reserve 6%<br />
Misc. 5%<br />
Total 100%<br />
7
Many of the equations buried in the weight fraction method depend on assumed parameters. In<br />
many cases, values were assumed using figures and tables from Roskam, Nicolai, and Raymer.<br />
The assumptions used are listed in Table 2.2. The weight fraction method is by no means an<br />
accurate method for initial sizing. Inaccuracies of up to 10% are possible depending on the<br />
quality of the initial assumptions, and 20% is not uncommon for unusual missions such as the<br />
one outlined in the RFP. The weight fraction method may not be accurate for this type of aircraft<br />
due to the lack of similar aircraft in the database. There are really only three supercruise aircraft,<br />
the SR-71, YF-23, and the F-22. These aircraft all have a vastly different mission and may yield<br />
invalid sizes for the interdictor. Though the method may be flawed, it was used anyway due to<br />
the lack of a better method.<br />
Weight fractions provide a starting point for the weight of a proposed aircraft; however, the<br />
physical dimensions are not predicted. In order to determine the physical size, constraint plots<br />
were created. A constraint plot examines the relationship between two variables based on given<br />
requirements. Generally, the two variables used are wing loading and thrust to weight ratio.<br />
The RFP gives many constraints as shown earlier in Table 1.II. The majority of constraints can<br />
be written as functions of wing loading and thrust-to-weight ratio. This is the reason that it is a<br />
popular type of constraint plot. The equations for range, takeoff distance, and many others were<br />
found in Roskam, Nicolai, and Raymer. Many more assumptions were made to create the<br />
constraint plot; these are shown in Table 2.III.<br />
Table 2.II - Weight Fraction Assumptions<br />
SFC _Cruise 1.11<br />
SFC _Dash 1.11<br />
SFC _Turn 1.11<br />
SFC _Loiter 0.8<br />
L/D Cruise 10<br />
L/D Dash 10<br />
L/D Turn 10<br />
L/D Loiter 12<br />
Table 2.III - Constraint Assumptions<br />
C Lmax_TO 1.8<br />
C Lmax_CR 1.2<br />
C LCruise 0.2<br />
AR 3<br />
e 0.8<br />
The constraint equations show how thrust to weight ratio and wing loading relate to a given<br />
performance constraint. This allows engineers to determine which combinations of thrust to<br />
weight ratio and wing loading are acceptable. The constraint plot for the RFP is shown in Figure<br />
2.2. Note that any design point on the shaded side of a line would not meet the design<br />
requirements. This again depends on the accuracy of the aforementioned assumptions. The<br />
constraint plot clearly identifies a design domain, in which, any combination of thrust-to-weight<br />
ratio and wing loading will satisfy the design requirements.<br />
Combined with the weight fraction method, the constraint plot shows the physical size of the<br />
airplane. Because a preliminary weight was determined from the weight fraction method, the<br />
8
wing loading and thrust to weight ratio may be converted to wing area and thrust required. Once<br />
this information is found the designer may start the configuration layout and choose a power<br />
plant. In order to obtain the smallest aircraft, the design point should be at the highest wing<br />
loading and lowest thrust to weight as possible on the constraint plot. As the design point moves<br />
to the left on the constraint plot, the wing area increases. This yields a larger airframe. Large<br />
airframes are expensive and cost more to maintain.<br />
As the design point moves up on the constraint plot, the engines get bigger and heavier. This is<br />
not desired as the aircraft will burn more fuel and have to fly at a higher lift coefficient for a<br />
given Mach number. This would cause the fuel burn for a given mission and thus increase<br />
operating costs. If the design point deviates from the lower right, an explanation is required.<br />
The initial design point was chosen in the center of the design domain in order to allow for<br />
aircraft growth. The design point was chosen away from constraint lines to make the aircraft<br />
design performance less sensitive to changes in weight.<br />
10<br />
0.9<br />
0.8<br />
Current Design<br />
Point<br />
Takeoff<br />
Landing<br />
ψ<br />
Range<br />
Thrust to Weight Ratio<br />
0.7<br />
0.6<br />
0.5<br />
0.4<br />
0.3<br />
0.2<br />
0.1<br />
Initial Design<br />
Point<br />
Specific<br />
Excess<br />
Power<br />
Specific<br />
Excess<br />
Power<br />
40<br />
60<br />
80<br />
100 120 140<br />
Wing Loading, (psf)<br />
160<br />
180<br />
200<br />
Figure 2.2 - Constraint Plot<br />
9
3 Configuration<br />
The current configuration of the aircraft was developed through several iterations. The first<br />
iterations were individual designs developed by each of the team members. Four different<br />
designs were considered for the configuration the Vendetta would take and each was evaluated to<br />
a similar level of detail.<br />
The first of these designs was Nergal (Figure 3.1). This<br />
was a concept that utilized thrust vectoring for stability<br />
in the yaw axis. This configuration utilized a rotary<br />
bomb bay configuration and a side-by-side cockpit<br />
arrangement. This was the only design based on a<br />
single PW-F119 as its power plant.<br />
Figure 3.2 - Jackhammer<br />
Figure 3.1 - Nergal<br />
The Jackhammer shown in Figure 3.2 was another tailless<br />
design. This aircraft differed from the Nergal only in its canard<br />
arrangement and twin-engine approach. It included a rotary<br />
bomb bay as well as F119 engines as its primary power plants.<br />
The flight deck was a side-by-side layout that provided good<br />
visibility for the pilots.<br />
The Interdictor, shown in Figure 3.3, was based on the RFP engines<br />
and sported good propulsive efficiency due to the lack of an S-style<br />
duct. Like the previous aircraft, the Interdictor included a side-by-side<br />
cockpit.<br />
Figure 3.3 - Interdictor<br />
The Big Paulie (Figure 3.4) had ample fuel volume and<br />
utilized RFP engines. It was outfitted with a side by<br />
side cockpit and ACES II ejection seats.<br />
Figure 3.4 - Big Paulie<br />
10
The downselect between these aircraft was not difficult. This early work clearly showed that the<br />
engine provided by the RFP was far too large for the thrust it provided. The two aircraft<br />
designed for the F119 were both smaller and more space efficient. This narrowed the downselect<br />
to the Nergal and Jackhammer. Both of these aircraft were tailless and it was determined that<br />
the weight and drag benefits associated with the lack of a vertical tail would be outweighed by<br />
the costs associated with the thrust vectoring system. It was also determined that the aircraft<br />
were too unstable laterally to be controlled by an inexpensive, low bandwidth, thrust vectoring<br />
system. It was decided to begin with a new design incorporating the strong points of each<br />
aircraft.<br />
The first iteration of the aircraft is shown in Figure 3.5; it is a large aircraft that has many design<br />
flaws. The first and most obvious is the above-chine mounted inlet. This is easily seen in the<br />
aircraft’s front view. The chine causes a vortex roll-up that would be directly ingested by the<br />
inlet at high angles of attack. This is not desired, as it would cause poor and unpredictable<br />
performance at nearly any angle of attack. A low bypass ratio engine might tolerate these flow<br />
disruptions without problems however; the design utilizes a new engine with a bypass ratio of<br />
approximately 1.5. This type of engine will not tolerate the poor inlet location.<br />
• Span = 50 ft<br />
• m.a.c. = 23 ft<br />
• S ref = 965 sq. ft<br />
• TOGW = 121,600 lb<br />
• Empty Weight = 62,000 lb<br />
50’<br />
19’<br />
105’<br />
23’<br />
Figure 3.5 - Initial Configuration<br />
Another downfall to the initial configuration was the weight distribution. The fuel center of<br />
mass was not near the empty weight center of mass. This caused the aircraft to take off very<br />
stable and land very unstable. This could not be remedied due to the small volume available for<br />
fuel in the aft portion of the fuselage. The majority of the fuel volume in the aft portion of the<br />
aircraft was located around the engines. This is undesirable due to the possibility of a<br />
catastrophic failure of the engine fan disk or afterburner.<br />
11
Another problem arises from the 20° facet on the bottom of the fuselage. This created a large<br />
radar footprint underneath the aircraft, as shown in Figure 3.6. The vertical stabilizer also<br />
created a very radar visible configuration. The final flaw that drives the aircraft to the new<br />
configuration is the pitching moment characteristic of the fuselage. The side by side seating<br />
arrangement of the first iteration caused the fuselage to be excessively large in the areas forward<br />
of the aircraft’s neutral point. The pitch up tendencies of the aircraft grew very large with very<br />
small angles of attack. The control power of the horizontal surfaces was deemed unacceptable to<br />
combat this. The current configuration has a tandem cockpit arrangement, which will be detailed<br />
later in the report, to help solve some of these issues.<br />
Arc fuselage top creates<br />
steps caused by facets<br />
Less sensitive to<br />
lower frequency radar<br />
as wavelengths increase<br />
and can’t distinguish facets<br />
0<br />
1 GHz<br />
5 GHz<br />
10 GHz<br />
RCS in dBm 2<br />
Flat bottom<br />
Horizontal fuselage<br />
intersection creates a<br />
sharp cavity<br />
20° bottom facet<br />
Figure 3.6 - Radar Return of Initial Configuration<br />
The second configuration, shown in Figure 3.7, is very different than the first. The<br />
configuration features many changes that aide in solving the previously discussed problems. The<br />
cockpit was changed to a tandem arrangement as well as the addition of two canted tails in the<br />
place of the single vertical. The engines moved to the top of the fuselage to avoid detection from<br />
infra red sensors. The take off gross weight was decreased to 114,000 lb due to an improved<br />
engine deck and aerodynamics.<br />
12
• Span = 53 ft<br />
• m.a.c. = 32 ft<br />
• S ref = 1500 sq. ft<br />
• TOGW = 114,000 lb<br />
• Empty Weight = 55,000 lb<br />
35°<br />
53’<br />
19’<br />
98’<br />
18’<br />
13°<br />
Figure 3.7 - Second Configuration<br />
This configuration was generated with a different mentality than the previous airframe. The<br />
center of gravity was known before the first part was placed on the aircraft and every effort was<br />
utilized to keep it in the appropriate place. The weight and balance issues, though still present,<br />
were dramatically improved. The fuel load and payload compartment reside directly on the<br />
desired center of gravity, however, the empty weight was too far aft. The low mounted wing<br />
proved to be a structural challenge when incorporating a landing gear well. Another issue dealt<br />
with the cruise angle of attack. It was shown that the aircraft would cruise at approximately 4<br />
degrees. The forward chine on the fuselage would be shedding a vortex throughout the cruise<br />
portion of the mission resulting in higher drag. The chine angle should meet the onset flow<br />
angle. This prompted another revision to the aircraft.<br />
The design was further refined and the current iteration was created. The current iteration has no<br />
red flags and performs the mission well. The current iteration of the Vendetta is shown in Figure<br />
3.8 and detailed in Foldout 1 of the Appendix. It has a forward chine of 4 degrees and sound<br />
structural load paths, which will be discussed in detail later in this report. The Vendetta has<br />
grown a small amount and currently weighs 124,000 lb (56,364 kg).<br />
The aircraft has a tandem cockpit supported by a very long nose. The long nose offsets the mass<br />
of the large engines and the massive structure required for the full flying horizontal stabilizers.<br />
The APU is located in the engine compartment keeping the fuel and fire retardant systems as<br />
redundant as possible. The inlets are under wing mounted to keep them in clean flow throughout<br />
the flight envelope. The Vendetta has a 1500 ft 2 (139 m 2 ) wing area with a leading edge sweep<br />
of 40 degrees. The design drivers will be discussed in detail throughout following sections. The<br />
inboard layout can be seen in Figure 3.9 and 3.10.<br />
13
• Span = 54.7 ft<br />
• m.a.c. = 32 ft<br />
• Length = 103 ft<br />
• Root = 46.75 ft, 3% Thick<br />
• Tip = 3%<br />
• Λ c/4 = 27°<br />
• Λ LE = 40°<br />
• S ref = 1500 sq. ft<br />
• TOGW = 129,000 lb<br />
• Empty Weight = 60,000 lb<br />
55’<br />
103’<br />
51°<br />
20’<br />
13°<br />
Figure 3.8 - Current Configuration<br />
APU<br />
Weapons Bay<br />
Retracted<br />
Gear<br />
Engines<br />
Retracted<br />
Gear<br />
Figure 3.9 - Inboard Layout<br />
14
Wing Tank X 2<br />
6,366 lb each<br />
70% Volume Usage<br />
Forward Fuselage Tank<br />
23,069 lb<br />
80% Volume Usage<br />
Aft Fuselage Tank<br />
23,544 lb<br />
80% Volume Usage<br />
Tandem Cockpit<br />
Figure 3.10 – Inboard Layout Continued<br />
Full Flying<br />
Horizontal<br />
15
4 Stealth Considerations<br />
As mentioned by the RFP, the aircraft is required to meet a stealth requirement. This is a very<br />
important driver for the aircraft. The entire design is influenced by this consideration equally as<br />
much as aerodynamics. There are many low observable considerations to be taken into account.<br />
The first and most obvious is the radar cross section (RCS).<br />
From the aspect of RCS, there are many drivers for an aircraft. The majority of the radar return<br />
comes from the shaping of the aircraft. The fuselage is constructed from flat sides and constant<br />
radius curves. The sides are kept at a 60° angle from the horizontal and the bottom is kept flat<br />
(Figure 4.1). This is desired because, as later shown, the footprint of the aircraft remains small.<br />
Another feature is the canted tails. This keeps the surfaces in the empennage section from<br />
creating 90 degree angles. This is important because the 90 degree angle would radiate RF<br />
energy directly back in the direction of the source. The leading edge sweep is 40°. This creates<br />
spikes well off of the frontal aspect of the aircraft. All other leading edges are kept swept at this<br />
same angle in order to minimize the magnitude of the frontal spoke. The 15° look up angle was<br />
considered the most important aspect of the RCS. The majority of the threat encountered will be<br />
below the Vendetta. This implies that they will be looking up at the aircraft, not from the front.<br />
This is where the majority of the stealth considerations were taken into account. (See Figure 4.1)<br />
The Low observability requirements are not only for RCS. In fact, the RFP specifically specifies<br />
“Balanced Observables”. Aside form RCS, IR accounts for the next highest threat. Emissivity<br />
matching can reduce the IR signature of the aircraft. The Vendetta will be coated with a material<br />
with similar emissivity as the surroundings, aiding in the disappearance of the aircraft to an IR<br />
sensor. The actual odds of becoming invisible to the IR sensor are fairly unrealistic due to the<br />
cold surroundings. The aircraft is shadowed by what is essentially space at 50,000 feet. It is<br />
hard to hide a warm object when backlit by a cold space. The other stealth consideration in this<br />
area is the nozzles. These are axisymmetric nozzles that are proven to have lower IR signatures<br />
than the axis symmetric option. This, combined with the frontal look-up threat direction<br />
minimizes the impact on IR stealth.<br />
40° LE Sweep<br />
All other Surfaces<br />
Matched<br />
Hidden Canted<br />
Verticals<br />
60° Facet<br />
Figure 4.1 - Stealth Considerations<br />
16
Another area of concern is that of visual observability. This is not a very big problem as the<br />
aircraft cruises so high that visually detecting the Vendetta would be near impossible. The only<br />
threat here is the contrails left by the engines. The contrails can be minimized by contrail<br />
avoidance techniques and don’t pose a large problem.<br />
To quantitatively analyze the radar cross section of the Vendetta, Radbase2 software by Surface<br />
Optics was utilized. First, a faceted model was generated from the 3D model. Faceting was<br />
limited to only those necessary because of the demanding processing requirements. Facets were<br />
limited to 10 degree tolerances at roughly 0.017 feet minimums. The facetted model is presented<br />
as Figure 4.2.<br />
Figure 4.2 - RCS Model Faceting<br />
It can be seen that heavy facet optimization was needed to make sure that all facets followed<br />
tangency requirements to leave smoothly curved and splined surfaces. The spline arc on the top<br />
of the fuselage is modeled with facets every 10°. For the flat surfaces like the wings and<br />
empennage 10° is more than adequate.<br />
The Radbase2 RCS code calculates the radar returns based on Physical Optics and Chu-Stratton<br />
integral methods. These are highly computationally intensive. Because of this, bounces off of<br />
surfaces were limited to 2 after the initial bounce off the surface. This was deemed adequate for<br />
this level of analysis. The vertical-vertical polarization of the return and transmission was<br />
analyzed as it is the most relevant to how radar stations operate. Monostatic radars which both<br />
broadcast and receive were used in the analysis as there would be too many possibilities to<br />
calculate for bistatic radars.<br />
The code was allowed to iterate on the model with 1° azimuth increments and for 0° and 15°<br />
lookup angles. It was also run for 1, 5, 10, and 12 GHz radar frequencies. Most fast track and<br />
search radar runs at the higher frequencies while long range threat radars utilize the lower<br />
frequencies. The 1 to 10 GHz range covers most of the radars that are expected for the role of<br />
this aircraft. A table of common ground and surface radars with their respective frequencies is<br />
presented as Table 4.I.<br />
17
Table 4.I - Common Ground Radars<br />
Radar Manufacturer Frequency Image<br />
AN/TPS-43E Mobile<br />
Radar<br />
Westinghouse<br />
2.9 to 3.1 GHz<br />
AN/TPS-70<br />
Fixed Ground Radar<br />
Northrop<br />
Grumman<br />
2.9 to 3.1 GHz<br />
AN/SPS-49<br />
Typical Long Range<br />
Naval Radar<br />
Navy Research<br />
Labs<br />
850 to 942<br />
MHz<br />
AN/SPS-55<br />
Long Range Surface<br />
Search Radar<br />
ISC Cardion<br />
9.05 to 10.0<br />
GHz<br />
Data is not readily available for radars made by foreign manufacturers. However, these radars<br />
should be adequate for this level analysis because the properties for radar waves traveling<br />
through the air over long distances are similar.<br />
The 1 to 12 GHz range covers FM and XM radar bands which are most common threats. The<br />
RFP specifically requires that the Vendetta has a frontal RCS of 0.05 m 2 . As the threat chart<br />
shown in Appendix A shows, most threats will be from below and at shallow angles of about 15°<br />
while at 50,000 during ingress. Because of this, the 0° and 15° lookup angles were analyzed. The<br />
results of the Radbase2 software are illustrated first in Figure 4.3, which depicts the radar cross<br />
section of the aircraft from a frontal, or 0° lookup angle.<br />
18
30<br />
20<br />
10<br />
0<br />
-10<br />
-20<br />
-30<br />
-40<br />
-50<br />
1 GHz<br />
5 GHz<br />
10 GHz<br />
12 GHz<br />
RFP Requirement<br />
Figure 4.3 - Radar Cross Section at 0º Lookup Angle<br />
Figure 18 shows that the vehicle does clearly meet the frontal RCS requirement of 0.05 m 2 (-12<br />
dB) set forth in the Request for Proposal. It also shows that the measures taken at shaping the<br />
aircraft are working. The leading edge and trailing edge of the wing come together closely. There<br />
is a large return directly from the side of the aircraft due to the wing tip and fuselage side. It can<br />
also be seen that although there are slight variations in the returns due to the different<br />
frequencies, they do not vary that much. This is due to the fact that the Vendetta is a rather large<br />
vehicle. None of the surfaces are small enough to interfere with the wavelengths of the radar.<br />
The weakest azimuth angle for the Vendetta is the 40° angle where the leading edge sends a large<br />
spike forward.<br />
Looking at the equally crucial 15° lookup angle cross section in Figure 4.4 reveals a slightly<br />
different picture.<br />
19
30<br />
20<br />
10<br />
0<br />
-10<br />
-20<br />
-30<br />
-40<br />
-50<br />
1 GHz<br />
5 GHz<br />
10 GHz<br />
12 GHz<br />
RFP Requirement<br />
Figure 4.4 - Radar Cross Sections at 15º Lookup Angle<br />
Figure 4.3 shows that the Vendetta meets and exceeds the 0° lookup angle returns. This is seen as<br />
highly advantageous. The shape of the bottom of the aircraft is effective in keeping spikes at a<br />
minimum. As mentioned earlier, this is a crucial area for the Vendetta. As most of its threats are<br />
from the ground, it is important that the aircraft has a limited return in this orientation.<br />
20
The software was also utilized to generate an RCS butterfly plot in a sweep around the vehicle to<br />
determine the footprint that it will leave as it flies above its threats. Figure 4.5 shows this sweep.<br />
60<br />
50<br />
40<br />
30<br />
20<br />
10<br />
0<br />
-10<br />
1 GHz<br />
5 GHz<br />
10 GHz<br />
12 GHz<br />
Figure 4.5 - Radar Cross Sections for a Radial Sweep<br />
It can be seen that the 30° facets on the bottom of the fuselage are deflecting radar away from the<br />
vulnerable lookup orientation. The aircraft is still producing a rather large return of almost 40 dB<br />
in this position, however. Once again there is little variation in the returns for various<br />
frequencies.<br />
It is important to note that the addition of radar absorbing material (RAM) would further reduce<br />
some of the returns on the aircraft. Also, currently the RCS software is treating the entire aircraft<br />
and all of its parts as purely reflective metal surfaces. This is a conservative approach. RAM<br />
could be applied in actuality to reduce some of the returns on the bottom and front of the aircraft.<br />
21
5 Aerodynamics<br />
The major aerodynamic aspects of the Vendetta are cruise lift-to-drag ratio and maximum<br />
subsonic lift coefficients for landing performance. Wing design is critical to both of these<br />
aerodynamic aspects as well as radar cross section. Area ruling was used to minimize the<br />
supersonic wave drag on the aircraft and minimize the aircraft’s fuel consumption over the<br />
mission.<br />
5.1 Wing Sizing<br />
The first aerodynamic aspects of the aircraft that were considered were the wing planform area<br />
and aspect ratio. To select the optimum wing planform area and aspect ratio, the effect of these<br />
two parameters on the specific excess power and fuel consumption over the design mission was<br />
studied. The 1g military specific excess power at an altitude of 50,000 ft (15,240 m) and Mach<br />
number of 1.6 was estimated using engine data and drag estimation based on component skin<br />
friction drag and area ruling. The fuel consumption of the aircraft was estimated by numerically<br />
integrating the engine fuel flow from over the design mission. The additional weight and<br />
maximum cross sectional area of larger wing areas was considered in calculations, however the<br />
mission profile was kept constant and the fuel weight at takeoff was kept constant at 59,250 lb<br />
(26,875 kg). The results shown in Figure 5.1 indicate that a wing planform area of<br />
approximately 1,500 ft 2 (139 m 2 ) and aspect ratio of 2 would maximize specific excess power<br />
and minimize fuel consumption.<br />
97<br />
96<br />
1,600 ft 2<br />
Design Point<br />
1,500 ft 2<br />
Fuel Onboard<br />
Specific Excess Power (ft/s)<br />
95<br />
94<br />
93<br />
92<br />
1,700 ft 2<br />
1,400 ft 2<br />
1,300 ft 2<br />
1,900 ft 2 1,200 ft 2<br />
1,100 ft 2<br />
Wing Area<br />
91<br />
1,800 ft 2 2,000 ft 2 Aspect Ratio 1.6<br />
2.2<br />
2.4<br />
2<br />
1.8<br />
1,000 ft 2<br />
90<br />
57,000 58,000 59,000 60,000 61,000 62,000 63,000 64,000 65,000 66,000<br />
Fuel Consumption over Mission (lb)<br />
Figure 5.1 - Optimization of Wing Area and Aspect Ratio<br />
22
5.2 Wing Planform<br />
The next aspect of the wing that was considered was the leading and trailing edge sweep angles.<br />
Because any edges on an aircraft reflect radar energy, the sweep angles of the edges of the wing<br />
were chosen to minimize radar energy reflected back to the source, especially in the frontal<br />
aspect of the aircraft where a specific RCS requirement is given by the RFP. To avoid reflecting<br />
radar toward the front of the aircraft, the leading and trailing edges of the wing had to be highly<br />
swept. In addition, the sweep angles could not be approximately 45º because a corner reflector<br />
would be created. These requirements led to a diamond shaped wing planform with leading and<br />
trailing edge wing sweeps of approximately 40º. Two initial designs were considered one having<br />
a 40º swept leading edge and a 30º forward swept trailing edge and the other having matched<br />
35.3º leading edge and trailing edge sweeps. A trade study was performed to select between<br />
these two wing configurations by studying the effect of the two configurations on RCS and<br />
aerodynamics. Figure 5.2 shows a comparison of radial sweeps of both configurations using<br />
RadBase2. The return from the 40º and 35.3º leading edge sweeps can be clearly seen in the<br />
plot. The leading edge spike on the matched leading and trailing edge configuration is<br />
approximately 15 dB lower than the other configuration; however it is 5º closer to the frontal<br />
aspect of the aircraft. The aerodynamic study of the two wing configurations indicated that<br />
approximately 1,000 lb (454 kg) of additional fuel would be required due to the additional wave<br />
drag of the lower leading edge sweep angle. Because of the aerodynamic benefits and because<br />
the RFP only gives frontal aspect RCS requirements, the 40º leading edge and 30º trailing edge<br />
configuration was chosen.<br />
23
1 GHz. 40º LE Sweep<br />
10 GHz. 40º LE Sweep<br />
1 GHz. 35.3º LE Sweep<br />
10 GHz. 35.3º LE Sweep<br />
RFP Requirement (-12 dB)<br />
50 dB<br />
40 dB<br />
30 dB<br />
20 dB<br />
10 dB<br />
35.3º LE Sweep<br />
40º LE Sweep<br />
0 dB<br />
-10 dB<br />
-20 dB<br />
-30 dB<br />
-40 dB<br />
-50 dB<br />
Figure 5.2 - Effect of Wing Leading and Trailing Edge Sweep on Aircraft RCS<br />
Once the wing area, aspect ratio, and sweep angles were chosen, the tip chord was kept at 8 ft<br />
(2.4 m) to avoid an overly small tip chord that could interact with radar wavelengths<br />
unpredictably. This resulted in the wing planform shown in Figure 5.3, with the measurements<br />
given in Table 5.I. Leading and trailing edge flaps, and ailerons were added to the wing. The<br />
chord high lift devices and control surfaces were kept at a constant percentage of the mean<br />
aerodynamic chord so that the hinge lines would parallel to the wing edges. The trailing edge<br />
flap chord is 20% of the mean aerodynamic chord and the leading edge flap and aileron are each<br />
10% of the mean aerodynamic chord. The trailing edge flap extends from the fuselage to 65% of<br />
the semi-span, the leading edge flap extends from the fuselage to 90% of the semi-span, and the<br />
aileron extends from the edge of the flap to 90% of the semi-span. No moveable surfaces were<br />
added to the last 10% of the semi-span so that radar obsorbing materials (RAM) could be added<br />
in the wing tip to minimize any returns from that edge.<br />
24
Figure 5.3 - Wing Planform<br />
Table 5.I - Wing Measurements<br />
Planform Area 1,500 ft 2 (139 m 2 )<br />
Span 54.8 ft (16.7m)<br />
Root Chord 46.8 ft (14.3 m)<br />
Tip Chord 8.0 ft (2.4 m)<br />
MAC 32.0 ft (9.8 m)<br />
y Location of MAC 10.5 ft (3.2 m)<br />
Aspect Ratio 2.0<br />
Leading Edge Sweep 40.0º<br />
Sweep at Quarter Chord 20.5º<br />
Sweep at Half Chord 4.7º<br />
Trailing Edge Sweep -30.0º<br />
Taper Ratio 0.17<br />
Leading Edge Flap Area 137 ft 2 (12.7 m 2 )<br />
Trailing Edge Flaperon Area 238 ft 2 (22.1 m 2 )<br />
Flapped Wing Area 935 ft 2 (86.9 m 2 )<br />
25
5.3 Wing Thickness<br />
The effect of wing thickness on the performance of the aircraft was studied so that the optimum<br />
thickness could be chosen. Initially a wing thickness of 3% of the chord was chosen based on<br />
existing supercruising aircraft. Increasing the root thickness of the wing was considered to<br />
reduce the weight of the wing. The effects of wing root thickness on wing weight, cross sectional<br />
area, and fuel consumption were studied. The weight of the wing was estimated using the<br />
method presented in Raymer, and the additional cross sectional area was calculated numerically.<br />
The resulting wing weights and cross sectional areas for wing root thicknesses from 3% to 6%<br />
are shown in Figure 5.4. The effect of the resulting weights and cross sectional areas on the fuel<br />
consumption during the mission were estimated using the same method used for the wing sizing.<br />
The results in Figure 5.5 show that the larger cross section of a thicker wing root adds more<br />
wave drag than the induced drag savings from the reduced wing weight. Based on this result, a<br />
constant wing thickness of 3% was chosen.<br />
8,500<br />
8,000<br />
t root = 3%<br />
Weight of Wing (lb)<br />
7,500<br />
7,000<br />
t root = 4%<br />
t root = 5%<br />
6,500<br />
t root = 6%<br />
6,000<br />
14 15 16 17 18 19 20 21 22<br />
Maximum Frontal Cross Sectional Area of Wing (ft 2 )<br />
Figure 5.4 - Effect of Root Chord Thickness on Wing Weight and Cross Sectional Area<br />
26
62,500<br />
Fuel Consumption over Mission (lb)<br />
62,000<br />
61,500<br />
61,000<br />
60,500<br />
60,000<br />
59,500<br />
59,000<br />
58,500<br />
58,000<br />
Fuel Onboard<br />
57,500<br />
3.0% 3.5% 4.0% 4.5% 5.0% 5.5% 6.0%<br />
Wing Root Thickness<br />
Figure 5.5 - Effect of Root Chord Thickness on Fuel Burn<br />
27
5.4 Airfoil<br />
The NACA 65A-003 airfoil section was chosen for the aircraft, because a symmetrical airfoil<br />
with the maximum thickness at 50% of the chord is optimum for supersonic flight. The airfoil<br />
ordinates given in Theory of Wing Sections for an NACA 65A-006 were scaled and interpolated<br />
using Lagrangian polynomials to define the geometry of the wing. The leading edge radius of<br />
the airfoil is 0.1% of the chord, which is approximately 3/8 inch at the mean aerodynamic chord<br />
and 1/10 inch at the tip. The airfoil sections at the mean aerodynamic chord and tip of the trailing<br />
edge flap are shown in Figure 5.6 and Figure 5.7 respectively. Because the chords of the flaps<br />
remain constant as the wing chord changes, each airfoil section has a different relative flap size.<br />
0.1<br />
0.05<br />
0<br />
-0.05<br />
-0.1<br />
0 0.1 0.2 0.3 0.4 0.5 0.6 0.7 0.8 0.9 1<br />
Figure 5.6 - Airfoil Section at MAC<br />
0.15<br />
0.1<br />
0.05<br />
0<br />
-0.05<br />
-0.1<br />
-0.15<br />
-0.2<br />
0 0.1 0.2 0.3 0.4 0.5 0.6 0.7 0.8 0.9 1<br />
Figure 5.7 - Airfoil Section at Tip of Trailing Edge Flap<br />
5.5 Lift Curve<br />
To estimate the lift curve of the wing, first, the lift curve slope of the wing was estimated using<br />
standard subsonic theory, compressibility corrections, and linear supersonic theory. The<br />
resulting lift curve slopes are shown as a function of Mach number in Figure 5.8.<br />
28
5<br />
4.5<br />
4<br />
Lift Curve Slope (1/rad)<br />
3.5<br />
3<br />
2.5<br />
2<br />
1.5<br />
1<br />
0.5<br />
0<br />
0 0.5 1 1.5 2 2.5 3<br />
Mach<br />
Figure 5.8 – Variation in Lift Curve Slope with Mach Number<br />
Next, the stall angle of the wing was estimated under subsonic conditions by calculating the lift<br />
distribution of the wing using LinAir. The section lift coefficient was calculated as a function of<br />
the span-wise location of the section for different wing angles of attack. The wing was assumed<br />
to stall when one of the section lift coefficients exceeded the maximum lift coefficient given in<br />
Theory of Wing Sections. The stall angle of attack of the wing was determined to approximately<br />
14º. Because the wing tip was shown to stall at a much lower angle of attack than the rest of the<br />
wing, adding a –3º angle of incidence to the wing tip was considered. The resulting twist<br />
extends the stall angle of attack to approximately 16º; however the twist decreased the lift<br />
coefficient at a given angle of attack and could impact RCS and supersonic aerodynamics.<br />
Ultimately, the non-twisted wing was chosen. The lift distributions of the wing with and without<br />
twist are shown in Figure 5.9.<br />
The effects of the trailing edge flap were estimated using the stall angle of attack and lift<br />
coefficient increments given in Nicolai. The effect of the leading edge flap was estimated by<br />
assuming that a 10º leading edge flap deflection would increase the stall angle of attack by<br />
approximately 10º, and the decrease in lift coefficient was estimated based on the change in<br />
effective angle of attack. The resulting subsonic lift curve at Mach 0.2 is shown in Figure 5.10.<br />
29
1<br />
Section Lift Coefficient<br />
0.9<br />
0.8<br />
0.7<br />
0.6<br />
0.5<br />
0.4<br />
0.3<br />
Max. Section Lift Coefficient<br />
0º Tip Incidence<br />
16º<br />
15º 16º<br />
15º<br />
14º<br />
13º<br />
14º<br />
12º<br />
13º<br />
12º<br />
- 3º Tip Incidence<br />
<strong>Cal</strong>culated Using LinAir<br />
0.2<br />
0.1<br />
0<br />
0% 10% 20% 30% 40% 50% 60% 70% 80% 90% 100%<br />
Spanwise Distance (percent semi-span)<br />
Figure 5.9 - Lift Distribution of Wing with and without Twist<br />
2<br />
Lift Coefficient<br />
1.5<br />
1<br />
0.5<br />
0<br />
C L = 1.20<br />
C L = 1.15<br />
C L = 0.56<br />
C L α = 2.33 1/rad<br />
C L = 1.51<br />
30º TE Flap<br />
Deflection<br />
Clean<br />
LinAir<br />
10º LE Flap<br />
Deflection<br />
-0.5<br />
Tail Strike Angle (14º)<br />
-1<br />
-20 -15 -10 -5 0 5 10 15 20 25 30<br />
Angle-of-Attack (degrees)<br />
Figure 5.10 - Subsonic Wing Lift Curve<br />
30
5.6 Drag<br />
The drag of the aircraft was divided into four parts: parasite drag, wave drag, induced drag, and<br />
trim drag. The parasite drag was estimated using a component build method with form and<br />
interference factors. The wave drag was calculated using the formula presented in Brandt &<br />
Stiles. The wave drag efficiency factor was calculated from cross sectional area distributions<br />
using the de Kármán integral and the theoretical wave drag of a perfect Sears-Haack body. The<br />
cross sectional area distributions were measured at transonic and supersonic (Mach 1.6)<br />
conditions. The transonic case was measured by passing vertical planes through a solid model of<br />
the aircraft and measuring the intersecting area. The supersonic case was measured by passing<br />
Mach cones through the model, measuring the intersecting area, and projecting that area onto the<br />
vertical plane. For both cases, the engine capture area was subtracted from sections containing<br />
the inlet, engine, and nozzle. The resulting area distributions shown in Figure 5.11 and Figure<br />
5.12 match reasonably well with that of a perfect Sears-Haack body. Both distributions yield a<br />
wave drag efficiency factor of approximately 2.14 (based on 80 ft 2 (7.4 m 2 ) max. area and 100 ft<br />
(30.5 m) length).<br />
90<br />
80<br />
70<br />
Sears-Haack<br />
Wing<br />
Cross Sectional Area (ft 2 )<br />
60<br />
50<br />
40<br />
30<br />
Fuselage<br />
Vertical Tail<br />
Horizontal Tail<br />
20<br />
10<br />
0<br />
0 200 400 600 800 1,000 1,200<br />
Fuselage Station (inches aft datum)<br />
Figure 5.11 - Transonic Area Distribution<br />
31
90<br />
80<br />
Wing<br />
Cross Sectional Area (ft 2 )<br />
70<br />
60<br />
50<br />
40<br />
30<br />
Sears-Haack<br />
Fuselage<br />
Vertical Tail<br />
Horizontal Tail<br />
20<br />
10<br />
0<br />
0 200 400 600 800 1,000<br />
Fuselage Station (inches aft datum)<br />
Figure 5.12 - Supersonic Area Distribution (Mach 1.6)<br />
Induced drag was estimated using standard subsonic theory and the supersonic equation<br />
presented in Brandt & Stiles to calculate the induced drag term (k 1 ). Trim drag was calculated as<br />
induced drag generated by the horizontal tail at the lift coefficient required to trim the aircraft<br />
with a given static margin and moment coefficient. The resulting drag build-up for the aircraft at<br />
an altitude of 50,000 ft (15,240 m), Mach number of 1.6, maneuver weight of 94,735 lb (42,971<br />
kg), and 5% static margin is shown in Figure 5.13.<br />
32
0.06<br />
0.05<br />
Drag Coefficient<br />
0.04<br />
0.03<br />
0.02<br />
Induced Drag<br />
50,000 ft<br />
Maneuver Weight<br />
Trim Drag<br />
0.01<br />
Wave Drag<br />
Parasite Drag<br />
0<br />
0 0.5 1 1.5 2 2.5 3<br />
Mach<br />
Figure 5.13 - Drag Build-Up at 50,000 ft, Mach 1.6, Maneuver Weight, and 5% Static Margin<br />
33
6 Propulsion<br />
In developing the propulsion system for the Vendetta, the RFP specifications of supersonic cruise<br />
and stealth are the driving factors for the propulsions system. Due to the stealth criteria the fan<br />
blades of the engine must remain hidden which drives the engine placement inside the airplane.<br />
That combined with the supercruise criteria leads to four major aspects of the propulsion system:<br />
the Engine, Inlets, S-ducts and Nozzles.<br />
6.1 Engine Selection<br />
The RFP specifies that the airplane should perform the mission with adequate installed thrust. A<br />
Low-Bypass-Ratio Turbofan (LBR-TF) or a Turbojet (TJ) engine may be used to perform the<br />
mission. Equations are provided for creating an engine deck, they are as follows:<br />
LBR-TF:<br />
TJ:<br />
ρ<br />
Tdry<br />
= 0.9 TSL −dry<br />
(0.88 + 0.24 ABS( M − 0.6) )( )<br />
ρSL<br />
2 ρ 0.8<br />
Twet<br />
= TSL −wet<br />
(0.94 + 0.38 ABS( M − 0.4) )( )<br />
ρ<br />
1.4 0.8<br />
ρ<br />
Tdry<br />
= 0.9 TSL −dry<br />
(0.907 + 0.262 ABS( M − 0.5) )( )<br />
ρSL<br />
2 ρ 0.8<br />
Twet<br />
= TSL −wet<br />
(0.954 + 0.38 ABS( M − 0.4) )( )<br />
ρ<br />
SL<br />
1.5 0.8<br />
However an installed engine deck for a LBR-TF with an axisymmetric center body inlet and a<br />
mixed flow ejector nozzle was supplied with the RFP. Since it included physical dimensions and<br />
fuel flow values the RFP engine deck was used instead of the above equations. The RFP engine<br />
specifications are shown in Table 6.I.<br />
Table 6.I - Engine Specifications of RFP Supplied Engine<br />
Engine and Nozzle Length<br />
Propulsion System Length<br />
Fan Face Diameter<br />
Maximum Diameter<br />
Weight with Nozzle<br />
SL<br />
310 inches (787 cm)<br />
425 inches (1080 cm)<br />
50 inches (127 cm)<br />
65 inches (165 cm)<br />
7200 pounds (3266 kg)<br />
The engine supplied by the RFP includes fuel flow and thrust data for part power, idle power,<br />
and military power. All engine data supplied by the RFP is corrected to sea level and a Mach<br />
number of zero. Therefore, every value for thrust and fuel flow at each altitude and Mach<br />
34
number is given in corrected net propulsive force (NPF c ) and corrected fuel flow (WF c ). To find<br />
the actual thrust (NPF) and fuel flow (WF) the following equations were used:<br />
NPF = NPF ⋅ d<br />
c T<br />
0.6<br />
F<br />
=<br />
F<br />
⋅<br />
c T<br />
⋅<br />
T<br />
W W Q d<br />
2 3.5 P<br />
dT<br />
= (1 + .2 M ) ( )<br />
PSL<br />
2 T<br />
QT<br />
= 1+<br />
0.2 M ( ) T<br />
Once the data was uncorrected the military thrust was found. The RFP supplied equations that<br />
could be used to scale the engine based on a desired thrust. The scaling equations are as follows:<br />
NPF<br />
NewMeasurement = OldMeasurement( ) NPF<br />
base<br />
Axial length scaling exponent = 0.4<br />
Diameter scaling exponent = 0.5<br />
Weight scaling exponent = 1.0<br />
SL<br />
exponent<br />
The RFP engine produced a military thrust of 26,350 pounds (117,210 N) and had a cruise thrust<br />
specific fuel consumption (TSFC) of 1.19 1/hr (0.121 kg/h/N) for Mach 1.6 flow at 50,000 ft<br />
(15,240 m). TSFC is calculated using the following equation:<br />
TSFC =<br />
W F<br />
NPF<br />
The Vendetta would require two engines to perform the desired mission. The size, weight, and<br />
location of the engines have great effect on the size of the airplane. The larger the engines the<br />
wider the aft portion of the fuselage and the longer the airplane. For the size and weight of the<br />
RFP engine it produced merely too little thrust and burned too much fuel.<br />
Other engines were sought out and analyzed in an attempt to find a better performing engine that<br />
was smaller and lighter than that supplied. Through this research the Concorde’s Rolls-Royce<br />
Snecma Olympus engine was found to be comparable to the RFP engine. However, the engine<br />
was first manufactured and flown in the Concorde in the mid 60’s through mid 70’s. Table 6.II<br />
compares the RFP engine to that of the Snecma Olympus. As can be seen the Snecma Olympus<br />
is very close in size and weight to that of the RFP, however it produces even more thrust than<br />
that of the RFP. Also the weight of the Snecma Olympus includes that of an afterburner whereas<br />
the RFP engine is without an afterburner.<br />
35
Table 6.II - RFP Dimensions Compared to the Snecma Olympus<br />
RFP<br />
Snecma Olympus<br />
Fan Face Diameter 50 in (127 cm) 47.5 in (120.65 cm)<br />
Length 310 in (787 cm) 280 in (711 cm)<br />
Weight 7200 lbs (3266 kg) 7000 lbs (3175 kg)<br />
Max Dry Thrust 26,356 lbs (117,237 N) 31,350 lbs (139,452 N)<br />
Based on this data the RFP engine was assumed to be an older engine; a more efficient and<br />
modern engine would be needed for the design of the Vendetta. The RFP engine deck was used<br />
as a baseline for designing a newer better engine, as it was the only full engine deck available. It<br />
was determined that an F119 engine would be the initial design engine for the airplane. This<br />
engine is currently used in the F-22 and a derivation of the engine (the F135) is to be used in the<br />
F-35.<br />
All information regarding the F119 is classified except that it is in a 35,000 lbs (155,700 N)<br />
weight class. Several methods were utilized to narrow in on the thrust produced by the F119.<br />
Through the use of The Integrated High Performance Turbine Engine Technology (IHPTET)<br />
program F119 characteristics were determined. IHPTET which began in 1988 and will culminate<br />
in 2005 consists of a 3 phase plan, utilizing the most current advancements in industry. “IHPTET<br />
is producing revolutionary advancements in turbine engine technologies due to the synergistic<br />
effect of combining advanced material developments, innovative structural designs and<br />
improved aerothermodynamics ” The 3 phases of the program are shown in Table 6.III.<br />
Phase III (2005)<br />
Phase II (1997)<br />
Phase I (Completed)<br />
Table 6.III - IHPTET Goals<br />
+100% Thrust/Weight<br />
-40% Fuel Burn<br />
+60% Thrust/Weight<br />
-30% Fuel Burn<br />
+30% Thrust/Weight<br />
-20% Fuel Burn<br />
The Air Force Research Laboratory states that Phase I of the program has been completed and<br />
that the technology has been applied to existing engines including the F100, F110, F414, and the<br />
F119. Based on this data Phase I was applied to the RFP engine deck to yield an F119 engine.<br />
This was done because both the RFP engine and the F119 are low bypass turbofan engines. The<br />
20% decrease in fuel burn was applied and then the weight was decreased by 21% and the thrust<br />
increased by 2% to account for the 30% change in thrust to weight. The resulting thrust produced<br />
by the F119 is 27,000 pounds (120,101 N), has a cruise TSFC of 0.94 1/hr (0.096 kg/hr/N) and a<br />
weight of 6,575 lbs (2,575 kg).<br />
Vendetta’s design is to be frozen in 2010 and future advancements and technologies are to be<br />
taken into account for its development. Phase II of IHPTET was to be completed by 1997 yet has<br />
not been achieved. However, Pratt and Whitney has proven a 40% increase in thrust to weight.<br />
36
The weight of the F119 was decreased down to 5,270 lbs (2,384 kg) to account for the additional<br />
10% increase in thrust to weight. However there is no evidence of any other advancements with<br />
the IHPTET program, and advancements in turbofan engines were sought out. The Versatile<br />
Affordable Advanced Turbofan Engine (VAATE) is an industry projection to 2020. Even though<br />
it builds upon IHPTET it uses the F119 as a base engine for its future goals. Figure 6.1 illustrates<br />
the goals for turbofan engines thru 2020 and Phase I goals of a 25% decrease in TSFC and a 45%<br />
decrease in cost by 2010. It is likely that this program will face similar problems in achieving its<br />
goal by 2010, in which case a decrease of 13% in TSFC was taken and an estimated 25%<br />
decrease in cost over the F119. The 13% change in TSFC was achieved by increasing the thrust<br />
by 11% and decrease the fuel flow 2%. The new VAATE technology engine has a sea level<br />
thrust of 30,000 lbs (133,500 N) and a cruise TSFC of 0.82 1/hr (0.084 kg/hr/N), however once<br />
inlet and ducting losses are accounted for the cruise TSFC is 0.92. 1/hr (0.094 kg/hr/N).<br />
37
38<br />
Figure 6.1 - VAATE Goals
The data for the idle power of the engine was based off of the original RFP. The idle data has not<br />
been changed since there is no distance credit or fuel credit for the descent portions of the<br />
mission and that is the only time idle settings would be used for this mission. The military thrust<br />
TSFC of the engine at various altitudes can be seen in Figure 6.2 and Figure 6.3 respectively.<br />
The afterburner model was created by multiplying the military thrust by 1.65 and the military<br />
fuel flow by 2. The equations provided by the RFP for calculating thrust from afterburner were<br />
not utilized as the maximum thrust produced by those equations yielded the same amount of<br />
thrust as the F119 at military power and altitude.<br />
Thrust (lbs/eng)<br />
35,000<br />
30,000<br />
25,000<br />
20,000<br />
15,000<br />
10,000<br />
Sea Level<br />
Alt 5,000 ft<br />
Alt 10,000 ft<br />
Alt 20,000 ft<br />
Alt 25,000 ft<br />
Alt 30,000 ft<br />
Alt 36,089 ft<br />
Alt 43,000 ft<br />
Alt 50,000 ft<br />
Alt 55,000 ft<br />
Alt 60,000 ft<br />
Alt 70,000 ft<br />
5,000<br />
0<br />
0 0.5 1 1.5 2 2.5<br />
Mach Number<br />
Figure 6.2 - Thrust Curves for Altitudes from Sea Level to 70,000 ft (21,300 m)<br />
39
TSFC<br />
3.0<br />
2.8<br />
2.6<br />
2.4<br />
2.2<br />
2.0<br />
1.8<br />
1.6<br />
1.4<br />
1.2<br />
1.0<br />
0 0.5 1 1.5 2 2.5 3<br />
Mach Number<br />
Sea Level<br />
Alt 5,000 ft<br />
Alt 10,000 ft<br />
Alt 20,000 ft<br />
Alt 25,000 ft<br />
Alt 30,000 ft<br />
Alt 36,089 ft<br />
Alt 43,000 ft<br />
Alt 50,000 ft<br />
Alt 55,000 ft<br />
Alt 60,000 ft<br />
Alt 70,000 ft<br />
Figure 6.3 - Military TSFC Curves for Altitudes from Sea Level to 70,000 ft (21,300 m)<br />
Once the engine deck had been established the engine dimensions were once again considered.<br />
The fan face diameter of the new engine was assumed to be that of the RFP. Low bypass<br />
turbofans typically have smaller fan face diameters however as the bypass ratio increases the fan<br />
face diameter would increase as well. Since future technology is being taken into account it is<br />
likely that the engine that would produce this thrust would have a larger bypass ratio but smaller<br />
core keeping the fan face diameter comparable to that of the RFP. The length of the engine was<br />
estimated based off of previous trends in engines. Engines used to plot this data include the<br />
F100, F101, F110, F404 JT3D, JT8D and TF30. This data can be seen plotted in Figure 6.4<br />
below. Logarithmic trendlines were fitted to the data and then extrapolated out past 30,000 lbs<br />
(133,500 N). For a thrust of 30,000 lbs (133,500 N) the engine would have a maximum diameter<br />
of 60 inches (152 cm) and a maximum length of 220 inches (559 cm).<br />
40
Diameter (in)<br />
70<br />
60<br />
50<br />
40<br />
30<br />
20<br />
10<br />
300<br />
250<br />
200<br />
150<br />
100<br />
50<br />
Length (in)<br />
0<br />
0<br />
12,000 17,000 22,000 27,000 32,000<br />
Thrust (lbF)<br />
Figure 6.4 - Engine Sizing Plot<br />
6.2 Inlets<br />
Sizing the inlet for supercruise flight at 1.6 Mach posed an interesting problem. A pitot inlet is<br />
good up until about 1.6 Mach and it is by far the cheapest inlet possible. However the<br />
performance of the inlet above Mach 1.6 is very poor. The pressure recovery of a two shock inlet<br />
(one oblique and one normal shock) and a three shock inlet were analyzed. The optimum<br />
deflection angle for Mach 1.6 flow was found for a two shock inlet by finding the stagnation<br />
pressure loss across the oblique and normal shock for different deflection angles. The results<br />
were graphed in Figure 6.5 and the resulting deflection angle for the greatest pressure recovery<br />
was found to be 10.75 degrees yielding a pressure recovery of 97.65%. Finding the optimum<br />
deflection angle for a three shock inlet is more involved therefore a rough estimate of a six<br />
degree deflection angle followed by another 6 degree deflection angle was used to compare<br />
against the two shock inlet. The difference in on design pressure recovery is about 1% however<br />
the larger the deflection angles become the better the pressure recovery will become. The<br />
pressure recovery comparison can be seen in Figure 6.6. The military specification for inlets is<br />
given below and is represented in the graph.<br />
Mil Spec MIL-E-5008B<br />
η<br />
rSpec<br />
⎧ 1 M ≤ 1<br />
⎩1<br />
0.075( 1) 1 5<br />
0<br />
= ⎨ −<br />
1.35<br />
M0 − < M0<br />
<<br />
41
Deflection Angle Analysis for Mach 1.6<br />
0.99<br />
0.98<br />
0.97<br />
Pressure Recovery<br />
0.96<br />
0.95<br />
0.94<br />
0.93<br />
0.92<br />
Deflection Angle = 10.75<br />
Pressure Recovery = 0.9765<br />
0.91<br />
0.9<br />
0.89<br />
0 1 2 3 4 5 6 7 8 9 10 11 12 13 14 15<br />
Flow Deflection Angle<br />
Figure 6.5 - Optimum Deflection Angle for Mach 1.6 Flow<br />
Pressure Recovery vs. Inlet Shocks<br />
0.99<br />
Total Pressure Recovery<br />
0.97<br />
0.95<br />
0.93<br />
0.91<br />
0.89<br />
0.87<br />
Design Point<br />
Mil-E-5008B<br />
0.85<br />
1 1.1 1.2 1.3 1.4 1.5 1.6 1.7 1.8 1.9 2<br />
Mach Number<br />
2 Shock 3 Shock angles 6 and 6 Mil Spec Mach 1.6<br />
Figure 6.6 - Pressure Recovery for a Two Shock versus Three Shock Inlet<br />
42
Other traits were looked at before choosing a two shock compression inlet. Figure 6.7 illustrates<br />
the area ratio compared to Mach number for the two and three shock inlets. The jumps in the<br />
curve, illustrate the Mach numbers at which the engine will work the hardest because they are<br />
the locations at which the shocks occur. Both of which will occur before the cruise Mach number<br />
of 1.6 therefore occurring during the climb portion of the mission.<br />
Area Ratio vs. Mach<br />
Area Ratio<br />
1.4<br />
1.35<br />
1.3<br />
1.25<br />
1.2<br />
1.15<br />
1.1<br />
1.05<br />
1<br />
0.95<br />
0.9<br />
0.8 1 1.2 1.4 1.6 1.8 2<br />
Mach Number<br />
2 Shock 3 Shock 6 deg and 6 deg<br />
Figure 6.7 - Inlet Area Ratio<br />
Figure 6.8 shows a rough cost relationship between different type inlets. As can be seen there is a<br />
lower cost associated with a two shock inlet. There are drawbacks to having more shocks, in that<br />
they drive the inlet to be larger, longer, and send multiple radar returns. The above traits do not<br />
show enough of a benefit to go with a three shock inlet therefore a two shock inlet was chosen.<br />
43
Figure 6.8 - Cost Association with Inlet Shocks<br />
Figure 6.9 below shows the off design inlet area ratio that is required for the Vendetta. The<br />
equations used to find the data are shown below. The actual capture inlet area is depicted by A 1 ,<br />
with the area at the shock being A s , and the actual flow area being captured by the inlet as A 0i .<br />
As the Vendetta increases in speed the engine requires a greater amount of inlet area for a<br />
constant mass flow rate.<br />
Mass Flow Ratio:<br />
A A A<br />
=<br />
A A A<br />
0i 0i s<br />
1 s 1<br />
Area Ratio:<br />
A<br />
A<br />
0i s s<br />
s<br />
ρ V<br />
=<br />
ρ V<br />
0 0<br />
44
Mass Flow Performance<br />
Inlet Area Ratio<br />
1.3<br />
1.2<br />
1.1<br />
1<br />
0.9<br />
0.8<br />
0.7<br />
Design Point<br />
0.6<br />
0.5<br />
0.4<br />
0.3<br />
0.2<br />
0.1<br />
0<br />
0 0.5 1 1.5 2 2.5 3<br />
Mach Number<br />
Figure 6.9 - Off Design Area Required for Engine Mass Flow<br />
The inlet capture area was found by first estimating the mass flow rate required by the engine at<br />
the design point. The mass flow of the engine could be estimated using the following equation.<br />
Mass Flow Estimation:<br />
m<br />
e<br />
= 26( FrontFaceDiameter)<br />
2<br />
The front face diameter of 4 ft (122 cm) was used; this yielded a mass flow rate of approximately<br />
405 slugs/sec (5910 kg/sec). Now using the mass flow equation shown below, the area of the<br />
inlet could be found for the design mission.<br />
Mass Flow Equation:<br />
m<br />
= ρ AV<br />
Once this was done the mass flow equation was used to calculate the area at different altitudes<br />
based on conservation of energy. For the desired design point of 1.6 Mach and an altitude of<br />
50,000 ft (15,240 m) this was found to be slightly larger than 5 ft 2 (4645 cm 2 ); however at<br />
55,000 ft (16,764 m)t it was found to be about 6 ft 2 (5.6 m 2 ). Since different parts of the mission<br />
take place at several different altitudes above 50,000 ft (15,240 m), the inlet area was sized to 6.5<br />
ft 2 (6 m 2 ). By sizing the engine to 6 ft 2 (5574 cm 2 ) air could be bypassed from the inlet to cool<br />
the fuel.<br />
45
The inlet has a boundary layer diverter for high speeds and auxiliary doors for low speed flight,<br />
since the required inlet area at take off will be twice what it is at cruise. The final inlet sizing for<br />
Mach 1.6 is:<br />
• Inlet capture area = 6.5 ft 2 (6 m 2 )<br />
• Inlet compression angle 10.75 degrees<br />
• Inlet Pressure Recovery is 97.6%<br />
• Speed after Normal Shock, M=0.82<br />
The inlet is located on a boundary layer diverter on the lower side of the wing. This keeps any<br />
vortices produced off of the wing or side of fuselage from being ingested by the inlet, as well as<br />
aid in inlet capture at high angles of attack.<br />
6.3 S-Duct<br />
S-ducts were used to move<br />
the flow from the inlets to<br />
the engine faces so that the<br />
compressor face of the<br />
engine could not be seen.<br />
Stealth is a requirement for<br />
the mission and the<br />
Figure 6.10 - Vendetta S-Duct<br />
compressor face is a large<br />
contributor to radar return. The s-duct goes from a minimum area just after the inlet to a<br />
maximum area at the compressor face as can be seen in Figure 6.10. The s-duct shape<br />
progressively goes from a square at the inlet to an oval<br />
and then a circle at the engine face.<br />
3 o<br />
4 o<br />
The portion of the s-duct closest to the fan face is used<br />
to straighten and slow the flow before it hits the<br />
compressor. This is done by having that portion of the<br />
duct be fairly long and gradually diffuse up to the<br />
compressor face through an upper deflection angle of 3<br />
degrees and a lower angle of 4 degrees as shown in<br />
Figure 6.11.<br />
Figure 6.11 - Diffuser Angle to the Engine<br />
Face<br />
The s-duct is 28 feet (853 cm) in length with an average<br />
duct height of 2.7 feet (82 cm). The efficiency of the s-<br />
duct is found by calculating the average diameter of the<br />
duct and dividing that by the length of the duct. The<br />
figure presented in Appendix B was used to calculate<br />
the efficiency of the duct. This yielded a length over<br />
diameter of just over 10 and an engine area to inlet area of 2 which yielded a duct efficiency of<br />
91.5%.<br />
46
6.4 Nozzle<br />
The nozzle of the Vendetta will have an afterburner and thrust<br />
reversers incorporated. It is a converging-diverging nozzle which<br />
allows for backpressure control at off design Mach numbers<br />
when the afterburners are on. That leads into a low signature<br />
axisymmetric advanced nozzle similar to that seen in Figure<br />
6.12. The advanced nozzle is being used because it has<br />
comparable signature to that of a 2-D nozzle however it weights<br />
50% less, costs 60% less and requires 300 fewer parts.<br />
Figure 6.13 - Clam Style Thrust Reversers<br />
The nozzle will have<br />
thrust reversing<br />
capabilities to enable<br />
the aircraft to land on<br />
an icy runway and<br />
Figure 6.12 - Low-Signature<br />
Axisymmetric Advanced Nozzle<br />
stop within the required 8,000 ft (2483 m) as<br />
specified by the RFP. Clam style thrust reversers,<br />
similar to those seen in Figure 6.13 will be utilized to<br />
reverse 25% of the thrust. Thrust vectoring is will not<br />
be incorporated as the Vendetta is not required to<br />
maneuver like a fighter.<br />
47
7 Materials and Structure<br />
The overall layout of the Vendetta’s structural layout is shown in Figure 7.1. The wing structure<br />
is similar to that of an F-15 and the material selection is similar an F-22. The main load path is<br />
in the form of a central keel that runs from between the nozzles and engines to the nose gear<br />
attachment point. The weapons bay splits the keel in the center of the aircraft. The load is<br />
shifted from the keel to the aft weapons bay wall and back into the keel at the forward end of the<br />
weapons bay. A close up of the weapons bay is also shown in Figure 7.1.<br />
Main Wing Spars<br />
Weapons Bay<br />
Stiffeners<br />
Figure 7.1 - Structure Buildup for Vendetta<br />
48
The layout of Vendetta’s inlets and landing gear allow for a continuous structural member, in the<br />
form of a bulkhead, to carry the aerodynamic loads from each wing directly to the central keel.<br />
This ideology breaks down as the bulkheads move away from the main wing load paths. The<br />
weapons bay splits the forward wing attachment bulkheads. This occurs only well in front of the<br />
aerodynamic center of the wing. Just forward of the aerodynamic center is the main forward<br />
load path for the wing. The aft load paths are a ring structure around the engines and inlets. The<br />
Important thing to note is that where the primary loads are being distributed, between 25 to 50<br />
percent of the mean aerodynamic chord, the bulkheads are continuous.<br />
It is also important to note that the landing gear attaches to a bulkhead just forward of the aft<br />
closure to the weapons bay. This is important because it locates the airborne and ground laden<br />
load paths on top of each other. This allows for some redundancy in the structure and allows for<br />
a lighter aircraft. Another redundant feature is the aft main load path. This bulkhead acts as the<br />
main forward engine attachment point. Again this allows for a minimum of large structural<br />
bulkheads and thus creates a lighter aircraft. The wing attachment points are shown in Figure<br />
7.2.<br />
The empennage structure follows the same methodology as the wing attachment structure. The<br />
vertical tails attach to the aft primary carry through of the wing. The aft vertical attach point is<br />
the same as the primary load path for the horizontal tails. The horizontal tail is an area of<br />
concern for the Vendetta. The horizontal surfaces are capable of producing tremendous forces on<br />
the aircraft. The horizontal surfaces are full flying and thus must attach at a single point in the<br />
aircrafts structure. This bulkhead is a ring carry through type that distributes the load from the<br />
pivot point to the central keel. Two secondary bulkheads back up this main bulkhead. The<br />
empennage structure is shown in Figure 7.3.<br />
Aft Primary<br />
Bulkhead & Main<br />
Engine Attachment<br />
Forward Secondary<br />
Bulkheads<br />
Forward Primary<br />
Bulkhead<br />
Aft Secondary<br />
Bulkheads<br />
Main Gear<br />
Attachment<br />
Figure 7.2 - Wing Attachment Detail<br />
49
Vertical Attachment<br />
Points<br />
Horizontal Pivot<br />
10” Diameter Shaft<br />
Horizontal Structural Load<br />
Paths<br />
Figure 7.3 - Empennage Structural Layout<br />
The structure of Vendetta was created with the RFP load requirements in mind. A V-N Diagram<br />
shown in Figure 7.4 was created using the required maximum and minimum g’ limits, and<br />
knowing the maximum dynamic pressure the aircraft should withstand. This diagram shows the<br />
load envelope the aircraft can operate in. The diagram also shows the standard gust lines for 1-g’<br />
flight.<br />
8<br />
Max g Limit<br />
6<br />
Max q<br />
4<br />
Max Lift<br />
Gust Lines<br />
60 ft/sec<br />
g's<br />
2<br />
0<br />
0 ft/sec<br />
-2<br />
-4<br />
-60 ft/sec<br />
Min g Limit<br />
0 500 300 1000 600 1500 900 2000<br />
1200<br />
Equivlent Knots Equivalent Velocity (ft/sec) Airspeed<br />
Figure 7.4 - V-n Diagram for Vendetta<br />
50
The materials selection for Vendetta was difficult. Vendetta takes advantage of the benefits of<br />
modern composites while relying on the proven durability of more conventional metals. The<br />
materials selection for different components is shown in Table 7.I.<br />
Table 7.I - Materials Selection<br />
Forward fuselage: • Skins and Chine - composite<br />
• Bulkheads / Frames - resin transfer, molded composite, and<br />
aluminum<br />
• Fuel Tank Frame and Walls - resin transfer, molded composite<br />
• Side Array Doors and Avionics - formed thermoplastic<br />
Mid-fuselage: • Skins - composite and titanium<br />
• Bulkheads and Frames - titanium, aluminum, and composite<br />
• Fuel Doors - composite<br />
• Weapons Bay Doors:<br />
o Skins - thermoplastic<br />
Hat Stiffeners - resin transfer, molded composite<br />
o<br />
Aft fuselage • Forward Boom - welded titanium<br />
• Bulkheads and Frames - titanium<br />
• Keel Web - composite / HC Cocure<br />
• Upper Skins - titanium and composite / HC Cocure<br />
Empennage: • Skin and Closeouts - composite<br />
• Core - aluminum<br />
• Spars and Ribs - resin transfer, molded composite<br />
Wings:<br />
• Pivot Shaft - tow-placed composite<br />
The materials used in the construction of the main portion of the wing<br />
are titanium alloy (42%), composites (35%), aluminum alloy (24%),<br />
steel alloy, and some other materials. The following materials are used<br />
in the construction of the wing:<br />
• Skins - composite<br />
• Side of body fitting - titanium HIP cast<br />
• Spars<br />
o front - titanium<br />
o intermediate - resin transfer, molded composite and<br />
titanium<br />
o rear - composite and titanium<br />
Miscellaneous: • Duct Skins - composite<br />
• Landing Gear – Airmet 100 steel alloy<br />
51
8 Landing Gear<br />
Landing Gear design for the Vendetta has eight significant design drivers.<br />
1) Tire selection due to the high 150 knot takeoff and landing speed (277.8 km/hr)<br />
2) 120,000 lb gross weight (54,300 kg)<br />
3) Ease of loading and reloading weapons<br />
4) Tail Strike Angle<br />
5) Ground Handling Characteristics<br />
6) Structural Location<br />
7) Minimal Internal Volume Usage<br />
8) Low Weight<br />
Suitable structural attachment points dictated the main<br />
gear be positioned near the subsonic center of pressure on<br />
the main wing (near the main spar) shown in Figure 8.1.<br />
This placement, as well as limited internal volume, good<br />
ground handling characteristics, minimal frontal area, and<br />
ease of unloading and loading weapons led to the<br />
adoption of a tricycle landing gear configuration. The<br />
main gear configuration was then approximated as a 737<br />
type main gear, (near our GTOW) for volume purposes.<br />
Initial sizing began with tire selection. Following<br />
methodology outlined in Raymer the main gear of the<br />
Vendetta should carry 88% of the GTOW and the nose gear<br />
should carry 12%. Starting with a database of tires and<br />
wheels developed by the Aerospace and Ocean Engineering<br />
Department at Virginia <strong>Poly</strong>technic Institute and State<br />
Figure 8.1 - Main Gear Structural<br />
Attachment Point<br />
University and a listing of tires in Raymer’s Aircraft Design a Conceptual Approach the initial<br />
listing was narrowed to the choice of 36in x 11in (91.4cm x 27.9cm) tires for the main gear and<br />
24in x 7.7in (61cm x 19.6cm) for the nose gear. The tires selected allowed a 1.5 factor of safety<br />
over the dynamic landing load of the aircraft.<br />
Now knowing the approximate volume of the 737 landing gear configuration with usable tires a<br />
rough solid model of the fuselage and internal components was produced to determine the exact<br />
gear location. The main gear was then designed to fold into the allotted space. The initial design<br />
considered the smallest internal volume as well as smallest frontal area for a given load, as<br />
shown in Figure 8.2. After analyzing both the internal position the gear would have to fold into,<br />
behind and under the main inlet ducts, the tandem configuration was chosen.<br />
The next challenge presented was obtaining the necessary gear height for easy loading and<br />
unloading as well as a tip back angle which did not exceed the tail strike angle, and having that<br />
gear fit into the limited internal volume available. The gear retraction scheme adopted produced<br />
52
a landing gear retraction scheme similar to an<br />
XB-70 Valkarie as shown in Figure 8.3. The<br />
complexity was necessary due to overall<br />
configuration drive of low supersonic maximum<br />
cross sectional area.<br />
Due to the Sears-Haack ideal of supersonic area<br />
distribution the nose gear could be easily placed<br />
in the forward fuselage. No need for complex<br />
folding arrangements led to the selection of a<br />
standard side-by-side tire configuration. The<br />
complete retraction schemes and nose wheel<br />
configuration can be seen in Figure 8.4. The<br />
completed landing gear configuration can be<br />
seen in Figure 8.5.<br />
The braking system for both the nose gear and<br />
main gear configuration would use a standard<br />
rotor disk braking mechanism. The heat-sink<br />
Figure 8.2 - Landing Gear Configuration Trade<br />
Study<br />
Figure 8.3 - Main Gear Retraction Sequence<br />
Figure 8.4 - Nose Gear and Main Gear Retraction Schemes<br />
will be made of carbon rather than steel because of the fact that carbon is superior to steel as it<br />
has a higher thermal conductivity and temperature limit, and the thermal expansion of carbon is<br />
lower. The only drawback to carbon brakes is the lower density of carbon compared to that of<br />
53
steel. This means that more<br />
braking material is required for<br />
a carbon braking system than<br />
what would be required for a<br />
steel system. The superceding<br />
benefit is that carbon offers a<br />
higher service life and has<br />
lower<br />
maintenance<br />
requirements than steel brakes.<br />
The sizing of the shock<br />
absorption system was<br />
designed around a hydraulic<br />
fluid pressure limit of 1,500 psi<br />
(10.3 GPa). The maximum<br />
load acting on each strut was<br />
then calculated and the<br />
corresponding piston area<br />
required to support this load<br />
was then calculated to be<br />
approximately 7 inches<br />
(17.8cm).<br />
Figure 8.5 - Completed Landing Gear<br />
The Vendetta’s landing gear, as seen<br />
in Figure 8.6 allows for drive up<br />
loading utilizing a MJ-1 or MHU-83<br />
lift truck. Landing gear sizing took<br />
account maximum lift truck reach to<br />
place weapons on the MPRL within<br />
the Vendetta’s main weapons bay.<br />
Figure 8.6 - Vendetta with MJ-1 Lift Truck and 2000lb JDAM<br />
54
9 Weight & Balance<br />
Weight and balance is one area often overlooked in aircraft design. The weights engineer<br />
develops a buildup that heavily influences aircraft performance engineer in terms of wing sizing,<br />
propulsion system selection, and in predicting aircraft performance. The stability and control<br />
engineer must rely on the weights engineer in order to size control surfaces, to develop flight<br />
control systems, and to develop stability derivatives. The configurator must work carefully with<br />
the weights engineer in order to develop a feasible inboard layout. In all aspects, the weights<br />
engineer plays a major role coordinating the design of any aircraft.<br />
After having sized the aircraft using the weight fractions technique, and after having developed<br />
an initial configuration, the next step is to develop a more accurate, class II weight buildup of the<br />
aircraft. The class II method used in the design of the Vendetta was developed from those<br />
methods found in the Nicolai, Raymer, and Roskam texts in order to obtain a collaborative and<br />
unbiased perspective. These methods involved defining several physical and geometric<br />
parameters of the aircraft. These parameters were inputs into a series of equations developed<br />
from historical weight trends. The weight estimations for various components as well as the<br />
level of agreement between authors are shown below in Table 9.I.<br />
Table 9.I - Initial Component Weight Buildup<br />
Roskam Nicolai Raymer Average Roskam Nicolai Raymer<br />
Component<br />
Weight<br />
(lbs)<br />
Weight<br />
(lbs)<br />
Weight<br />
(lbs)<br />
Weight<br />
(lbs)<br />
Accuracy<br />
(%)<br />
Accuracy<br />
(%)<br />
Accuracy<br />
(%)<br />
Structures<br />
Wing Group 9,687 11,466 7,870 9,674 0% -31% 26%<br />
Horizontal Tail 1,135 1,694 958 1,262 14% -62% 32%<br />
Vertical Tail 801 1,538 1,497 1,279 47% -34% -28%<br />
Fuselage 10,681 16,031 10,398 12,370 19% -52% 22%<br />
Main Landing Gear 2,742 2,969 1,156 2,289 -33% -52% 60%<br />
Nose Landing Gear 387 405 408 400 5% -2% -3%<br />
Propulsions 10,636 10,878 11,199 11,209 4% 0% -4%<br />
Systems 18,649 14,506 14,350 20,574 -29% 12% 13%<br />
Payload 9,500 9,500 9,500 9,500 0% 0% 0%<br />
Fuel 58,974 58,974 58,974 58,974 0% 0% 0%<br />
TOGW 123,653 128,435 128,435 127,531 4% -2% -2%<br />
The detailed weight buildup of the structures, control surfaces, systems, payload, and fuel groups<br />
has been compacted in order to save space and can be viewed in its entirety in Foldout 1. The<br />
table indicates that all three authors tend to disagree to some extent in their weight estimates of<br />
certain components, and for other components, one author may have no way of estimating that<br />
components weight at all. The most accurate way to develop the most detailed component weight<br />
buildup was to consider all three methods and take the average shared between them. An<br />
author’s estimation was discarded if it did not agree to within ±30% of the average of the other<br />
authors’ estimations. Once the estimations were in agreement to within ±30%, they were<br />
averaged in order to develop a weight buildup for the entire aircraft. The class II weight buildup<br />
for the Vendetta after the downgrading process is shown below in Table 9.II.<br />
55
Table 9.II - Final Component Weight Buildup<br />
Roskam Nicolai Raymer Average<br />
Component<br />
Weight<br />
(lbs)<br />
Weight<br />
(lbs)<br />
Weight<br />
(lbs)<br />
Weight<br />
(lbs)<br />
Structures<br />
Wing Group 9,687 XXXXXX 7,870 8,779<br />
Horizontal Tail 1,135 1,694 958 1,262<br />
Vertical Tail 801 1,538 1,497 1,279<br />
Fuselage 10,681 XXXXXX 10,398 10,540<br />
Main Landing Gear 2,742 2,969 1,156 2,289<br />
Nose Landing Gear 387 405 408 400<br />
Propulsions 10,636 10,878 11,199 11,209<br />
Systems 18,649 14,506 14,350 20,574<br />
Payload 9,500 9,500 9,500 9,500<br />
Fuel 58,974 58,974 58,974 58,974<br />
TOGW 124,800<br />
Inertias were calculated using guidelines outlined by the Society of Allied Weight Engineers<br />
(<strong>SAWE</strong>). Each components mass and location in reference to the aircraft center of gravity was<br />
used to calculate that components inertia. The sums of these inertias were then used in<br />
calculating the total moments of inertia about the<br />
Vendetta’s principal axes shown in Figure 9.1. In order to<br />
determine whether or not these values were accurate, the<br />
moments of inertia were transformed into non-dimensional<br />
radii of gyration coefficients. These coefficients were then<br />
compared to typical values for a jet bomber provided by<br />
<strong>SAWE</strong>. These comparisons are shown below in Table<br />
9.III.<br />
Table 9.III - Inertia Estimation<br />
Figure 9.1- Principle Axes<br />
Inertias (slug*ft 2 )<br />
Ix Iy Iz<br />
Vendetta 35,248 807,819 838,575<br />
Nondimensional Radii of Gyration<br />
Rx Ry Rz<br />
Vendetta 0.11 0.29 0.38<br />
<strong>SAWE</strong> 0.31 0.33 0.47<br />
Accuracy 63% 13% 18%<br />
The table indicates that the inertias are well<br />
within the typical values for a jet bomber<br />
except about the roll axis. This is because the<br />
Vendetta is similar to a typical jet bomber in<br />
length; however, it has a much shorter<br />
wingspan. This would constitute a smaller<br />
moment of inertia about the roll axis.<br />
After having developed an initial configuration and a more detailed class II weight buildup, the<br />
next step was to balance the aircraft. This was done for two types of payload, the first being<br />
fixed equipment and the second being variable payload. The variable payload aboard the<br />
Vendetta consists of both fuel and weapons because the weight and center of gravity of these<br />
56
items varies throughout the mission. The fixed equipment aboard the Vendetta is considered in<br />
this case to be everything other than the variable payload.<br />
Vendetta was first balanced it with the fixed equipment and then with the additional variable<br />
payload. This was done by first allowing the configurator to develop an inboard configuration.<br />
The weights engineer then calculated the center of gravity location resulting from this inboard<br />
arrangement. This process was iterative in that the weights engineer and configurator had to<br />
continuously modify the inboard arrangement until the center of gravity location was at the<br />
desired location.<br />
In order to minimize the trim drag on the aircraft, it was opted that the aircraft’s center of gravity<br />
location stay as close to the aerodynamic center as possible. This was a difficult task because of<br />
the dramatic shift, 12% MAC, in the location of the aerodynamic center when transitioning from<br />
subsonic to supersonic flight conditions. A trim tank was considered in order to allow the center<br />
of gravity to follow the aerodynamic center during this dramatic shift in order to maintain a<br />
neutrally stable condition at both subsonic and supersonic flight conditions; however, this idea<br />
was discarded because the trim tank would only require additional fuel volume in an already<br />
congested aircraft. Without a trim tank, in order to minimize drag by keeping the center of<br />
gravity as close as possible to the aerodynamic center the aircraft would have to fly with an<br />
unstable static margin, subsonically, and with a stable static margin, supersonically.<br />
The current arrangement of the fixed payload is such that it provides for a 5% unstable static<br />
margin at subsonic flight conditions. A center of gravity monitor makes use of fuel burn control<br />
in order to keep the aircraft as close as possible to the neutrally stable flight condition.<br />
Furthermore, with full fuel tanks, full weapons load, and subsonic flight conditions, i.e. takeoff,<br />
the aircraft is balanced such that it provides for a 5% unstable static margin. With the empty<br />
weight and takeoff gross weight balanced to provide a 5% unstable static margin, and with an<br />
aerodynamic shift of 12%, the aircraft immediately goes to a 7% stable static margin upon<br />
transitioning to supersonic flight. The center of gravity monitor then controls the fuel burn in<br />
such a way that the center of gravity follows the aerodynamic center and the Vendetta maintains<br />
neutral stability.<br />
Because the fuel load is constantly changing throughout the mission, balancing the fuel load<br />
throughout the mission can be a challenging task. Furthermore, the deployment of various<br />
weapons at any point during the mission makes this balancing process even more difficult.<br />
Because of the complexity involved in developing a center of gravity monitor, a computer code<br />
was developed in order to simulate the center of gravity monitor. The first step in developing<br />
this code was to obtain the best solution to balance the fuel payload throughout the mission. The<br />
code required four inputs including; the weight and location of the fixed equipment, the location<br />
and weight of the fuel at any given time, the amount of fuel burned at intervals throughout the<br />
mission profile, and the desired center of gravity location at that interval. With these inputs, the<br />
code can then determine which tank to burn fuel from in order to obtain the center of gravity<br />
location closest to that corresponding to the desired static margin. The code then outputs the<br />
center of gravity location and the remaining fuel payload. This is done at 10-second intervals<br />
57
throughout the 5-hour mission. Using this data, the center of gravity path can then be plotted as<br />
it tracks that path corresponding to the desired static margin.<br />
The next step was to balance the weapons payload. Because the weapons payload was placed in<br />
a rotary launcher, the center of gravity of the payload was concentrated in one location. If it had<br />
been placed in a more conventional arrangement spread across the belly of the aircraft, the center<br />
of gravity of the weapons would have also been spread across the belly of the aircraft. By<br />
concentrating the center of gravity of the weapons payload in one location and placing the<br />
weapons payload on top of the aircraft’s empty weight center of gravity location, deployment of<br />
the weapons payload did not generate any problems in balancing the aircraft or in disturbing the<br />
static margin. The center of gravity is shown tracking along the path of the desired static margin<br />
by means of fuel monitoring and pumping in Figure 9.2.<br />
Figure 9.2 - Center of Gravity Excursion<br />
The figure indicates that the center of gravity location at takeoff gross weight is slightly aft of<br />
the neutral point; however, the center of gravity tracks the desired static margin shortly after<br />
the aircraft has transitioned to supercruise. Notice the path of the aerodynamic center as it<br />
shifts during the transition from subsonic to supersonic flight. It is clear that the aircraft flies<br />
supersonically shortly after takeoff, or when the aircraft’s gross weight is just below takeoff<br />
gross weight. Furthermore, near the zero fuel weight, the aircraft flies subsonic for the<br />
remainder of the flight. The figure also indicates that with the current fuel tank arrangement,<br />
the desired static margin cannot be tracked during the final portion of the supercruise because<br />
there is not enough fuel available to properly trim the aircraft. At this point, the center of<br />
58
gravity is influenced by only the fixed weight of the aircraft and again the aircraft remains at<br />
a 5% unstable static margin during landing. This plot indicates that the center of gravity<br />
monitor works together with the control system in order to minimize trim drag while at the<br />
same time maintaining the aircraft’s controllability.<br />
59
10 Stability and Control<br />
To initially size the horizontal tail, tail volume coefficients from historical aircraft were<br />
analyzed. This was done in an attempt to determine the rough size of the horizontal and vertical<br />
tail surfaces prior to addressing stability and control issues. The tail volume coefficients are<br />
unitless parameters defined by geometric values relating the size of the empennage surface to the<br />
aircraft. The horizontal and vertical tail volume coefficients are defined in the following<br />
equations.<br />
V<br />
H<br />
=<br />
SHTL<br />
c S<br />
W<br />
HT<br />
W<br />
V<br />
V<br />
=<br />
SVT<br />
L<br />
b S<br />
W<br />
VT<br />
W<br />
Because the demands for most supersonic cruising aircraft are considered similar to a certain<br />
extent, the historical values of tail volume coefficients are used to back out the planform areas<br />
for the horizontal and vertical surfaces. Similar aircraft and their tail volume coefficients are<br />
presented in Table 10.I.<br />
AIRCRAFT<br />
Table 10.I - Historical Aircraft Tail Volume Coefficients<br />
TAIL VOLUME COEFFICIENTS<br />
V H<br />
V V<br />
Boeing SST (2707-300) 0.36 0.049<br />
Concorde n/a 0.080<br />
GD F-111A 1.28 0.064<br />
Rockwell B1B 0.80 0.039<br />
TU-22M 1.11 0.087<br />
TU-144 n/a 0.081<br />
AVERAGE 0.58 0.067<br />
Using the average tail volume coefficient for these similar aircraft yielded a horizontal stabilizer<br />
area of 386 ft 2 . This is rather large and may be attributed to the fact that these vehicles require<br />
large robustness in CG travel without the use of a flight control augmentation system (CAS).<br />
Likewise, the vertical tail would require 196 ft 2 of area. This number is driven slightly larger due<br />
to the fact that some of the larger historical tail volumes are inflated because these aircraft’s<br />
verticals are mounted on booms which extend aft. These booms allow for greater moment arms<br />
and make the vertical more effective.<br />
The effects of horizontal tail area on longitudinal static stability were looked at in an attempt to<br />
determine what the driving factors for horizontal tail area are. A Roskam class II method was<br />
60
used to see how the increased weight of a bigger horizontal affects the longitudinal static margin.<br />
This “X-plot”, as it is commonly known, is shown as Figure 10.1.<br />
Figure 10.1 - Longitudinal X-Plot at Mach 0.3<br />
It is notable that only about 110 ft 2 of horizontal area is required to keep the Vendetta neutrally<br />
stable at Mach 0.3. It can be seen that as the tail grows, the CG of the entire configuration shifts<br />
aft. This also shifts the effective neutral point (center of pressure) of the aircraft aft at a faster<br />
rate than the CG shifts aft. A horizontal that is bigger than 100 ft 2 yields a stable aircraft but will<br />
pay the price in trim drag if the aircraft is too stable.<br />
A stable static margin is necessary in flight without the use of a digital flight control margin. The<br />
RFP mandates this as well as adherence to MIL-8785C, the military specification for handling<br />
qualities of aircraft. A statically unstable aircraft would have a tendency to pitch up in a static<br />
level condition. The purpose of the horizontal tail is to apply a force which counteracts this<br />
offending moment. This comes at the price of trim drag, however. As the elevator is deflected,<br />
drag is created and this hurts the overall aircraft performance in cruise. It is because of this that a<br />
neutrally stable or marginally stable (1-3%) aircraft is desired in cruise.<br />
To complicate matters, it can be seen from Figure 6.1 that areas above 110 ft 2 are required for a<br />
Mach number of 0.3. The aerodynamic center (center of pressure) on the wing and most surfaces<br />
propagates aft as the Mach number passes the transonic regime. This shift effectively leaves the<br />
61
difference in neutral point and center of gravity greater. This difference means the aircraft is<br />
actually more stable in a supersonic cruise. The fact that the center of gravity is so far forward in<br />
relation to the neutral point causes the aircraft to pitch down. More trim is required which causes<br />
drag. This phenomenon is known as Mach tuck.<br />
It is because of this that the weight and balance of the aircraft must be closely in synch with the<br />
control system. Trim drag will be minimized and controllability will be enhanced with<br />
completely integrated systems.<br />
Canting the horizontals in a v-tail configuration was investigated in an attempt to shape the<br />
empennage in a stealthy manner. The effective area of the vertical and horizontal are functions of<br />
the square of the cosine of the cant angle. These effects are reflected in Figure 10.2.<br />
Figure 10.2 - Horizontal Area Required for Static Stability with Cant Angle<br />
It can be seen from the plot that as the cant angle increases the total planform area of the<br />
horizontal must increase to maintain the nominally desired static stability of 5%. Five percent<br />
was chosen because at this stage in the sizing it was uncertain what the dynamic characteristics<br />
of the aircraft would be. Attempting to maintain a minimally statically stable aircraft would ease<br />
the job of control system design if future needs warrant one. Angles up to 30° were looked at<br />
because it would be unwise from an RCS point of view to approach a 90° angle created by larger<br />
cants near 45°. Beyond 45° the trend would be the same; however the horizontal would drive the<br />
area instead of the vertical.<br />
This plot shows that only 118 ft 2 of horizontal area is required to maintain the desired static<br />
margin. This is far off from the historical class I method and by initial inspection appears small.<br />
62
This leads us to believe that the area required maintaining static stability is not the driving factor<br />
in the size of the horizontal. Control power required to rotate the aircraft, dynamic<br />
considerations, and high angle of attack recovery will most likely drive this size.<br />
A similar study was conducted on the vertical stabilizer to see what area would required for<br />
varying cant angles to maintain 0.001 (1/degree) lateral weathercock stability. This is illustrated<br />
in Figure 10.3.<br />
Figure 10.3 - Vertical Area Required for Static Stability with Cant Angle<br />
From Figure 6.3 it can be seen that at 30°, 165 ft 2 of vertical area is required to maintain 0.001<br />
(1/degree) of lateral weathercock stability. Although the 30° cant angle on the verticals was<br />
initially selected to match the bottom fuselage facets for RCS considerations, lowering that angle<br />
to 20° would allow other advantages. Shallower cant angles are easier to manufacture, require<br />
less structure, weigh less, and have less coupling with pitch modes. For these reasons, the impact<br />
on RCS was investigated for the 20° cant angle as well as the pitch coupling term for rudder<br />
deflection, C<br />
δ<br />
.<br />
m r<br />
The RCS code was run on two aircraft configurations. The same wing, fuselage, and horizontal<br />
were modeled with the vertical planforms mounted at both 20° and 30°. The results of that study<br />
are shown as Figure 10.4.<br />
63
40<br />
30<br />
20<br />
10<br />
0<br />
-10<br />
-20<br />
-30<br />
-40<br />
-50<br />
20° Canted Vertical<br />
30° Canted Vertical<br />
RFP Requirement<br />
Figure 10.4 - Radar Cross Section Impact of 20° vs. 30° Vertical Cant Angle<br />
Figure 69 clearly shows that there is an impact on the RCS for changing the cant angle. The RFP<br />
required -12 dBm 2 return is shown in red. As mentioned in the RCS section, this requirement is<br />
only mandated for the frontal 0° azimuth angle. Going to a 20° cant does not violate this<br />
requirement and yields the aforementioned benefits.<br />
The effective area of a rudder sized to 27% mean aerodynamic chord of the vertical was<br />
calculated in the horizontal plane of the aircraft. In normal non-canted configurations, Cm<br />
δ<br />
is<br />
r<br />
nonexistent. Table 10.II shows the values for this coupling term and various cants.<br />
Table 10.II - Pitching Moment Coupling with Rudder Deflection for Various Vertical Cant Angles<br />
C<br />
δ<br />
Vertical Cant Angle<br />
(165 ft 2 27% m.a.c. Rudder) m r<br />
0° 0.0000<br />
10° 0.0004<br />
20° 0.0009<br />
30° 0.0021<br />
64
The extra 10° cant resulted in a substantially larger pitch coupling term. In addition to the<br />
complications of canting more, a 30° angle would mean that a more complex mixer and control<br />
system would be required. This would add to the cost and is avoided.<br />
It is important to note that the previous static methods do not take into account the dynamic<br />
characteristics or modes of this aircraft. With such a large amount of the fuselage in front of the<br />
center of pressure, the Vendetta may require a complex yaw damper or larger vertical to<br />
compensate.<br />
The size of the vertical could potentially be driven by the one engine inoperative (OEI) control<br />
power requirements. Because the engine nozzle centerlines are mounted considerably offset from<br />
the centerline at 3 feet (0.9144 m), a large yawing moment will be created if the Vendetta loses<br />
an engine during takeoff. The engines produce roughly 45,000 pounds of thrust and would<br />
generate a 135,000 foot-pound moment. Table 10.III shows the results of the rudder control<br />
power analysis for this critical OEI condition.<br />
Table 10.III - Rudder Control Power Results for OEI Condition<br />
PARAMETER NOTATION VALUE<br />
Side Force due to Rudder C yδr 0.0105<br />
Rolling Moment due to Rudder C lδr 0.0072<br />
Rudder Effectiveness C nδr -0.0070<br />
OEI Critical Yawing Moment<br />
135,000 ft-lbs<br />
Rudder Deflection Required in OEI Condition at Takeoff 13.6°<br />
With a rudder effectiveness of -0.0070 (1/deg), a 13.6° rudder deflection is required to keep the<br />
aircraft flying straight in the OEI condition on takeoff. This is not too large, and would suffice by<br />
allowing approximately another 10° of rudder deflection for the pilot to yaw the aircraft beyond<br />
the straight condition for controllability. In this condition, the aircraft would be susceptible to<br />
large amounts of sideslip, β.<br />
This rudder deflection would be substantially higher if a higher cant angle were used. In these<br />
critical situations where the aircraft is in danger, the added drag created by the mixing is desired<br />
to be as little as possible.<br />
A separate 4 surface empennage was now made necessary because going to a purely V-tail was<br />
shown to be ill-advised at this stage because of the aforementioned studies. If a pure v-tail was<br />
chosen, it would have to be full-flying due to the demand placed on the surface and hinge lines in<br />
supersonic flight. This would require a large actuator and large structural members in the aft<br />
portion of the aircraft. This would considerably drive the configuration away from initial RCSfriendly<br />
layouts as well as increasing complexity and cost.<br />
65
The Vendetta configuration utilizes a 20° cant on the<br />
verticals and a separate full-flying horizontal as seen<br />
in Figure 10.5. It was mentioned earlier that one of<br />
the reasons the horizontal tail volume coefficient<br />
was larger in the historical aircraft was because<br />
those aircraft did not utilize control augmentation<br />
systems or digital fly-by-wire control systems. Not<br />
only did they have to account for wide shifts in CG,<br />
they also had to combat the muck tuck problem<br />
associated with breaking the sound barrier.<br />
Figure 10.5 - Vendetta Empennage Configuration<br />
Figure 10.6 shows that as the aircraft<br />
Mach trim<br />
exceeds the critical Mach number,<br />
the center of pressure of the wing<br />
and other control surfaces travels aft.<br />
In the case of the Vendetta, this<br />
leaves the CG an extra 12% m.a.c. in<br />
front of the neutral point; this makes<br />
it 12% more stable. This 12% shift<br />
was calculated with the Air Force’s<br />
Data Compendium (DATCOM)<br />
mg<br />
12% m.a.c.<br />
methods.<br />
Figure 10.6 - Mach Tuck Illustrated<br />
The shift in the neutral point of the<br />
wing means that the horizontal<br />
would have to deflect to keep the Vendetta from “tucking” under. The trim drag created could be<br />
avoided by shifting the CG, by altering the neutral point, or designing the aircraft to be unstable<br />
subsonic and stable supersonic.<br />
The use of a trim tank was investigated to pump fuel aft and shift the CG closer to the neutral<br />
point in supersonic cruise. This notion was dismissed because the tank would be a vacant waste<br />
of space and would complicate ground procedures where refueling would have to leave the tank<br />
vacant.<br />
The use of an extra flying surface such as a canard could be used as well. The canard would<br />
destabilize the aircraft by moving the neutral point forward and closer to the CG but it would<br />
make the Vendetta even more uncontrollable in the subsonic landing and takeoff conditions. This<br />
extra control surface would add to the cost and complexity.<br />
A fuel management system could be used to burn fuel from certain tanks to keep the CG travel in<br />
check. After analyzing the abrupt shift in the neutral point when the Vendetta climbs to its cruise<br />
condition, it was decided that the fuel management system could not pump fuel fast enough to<br />
66
trim the aircraft. The likewise was true when decelerating. The aircraft would suddenly go<br />
unstable. Because of this, use of a digital flight control system (DFCS) which is provided as GFE<br />
would allow the aircraft to fly unstable subsonic. The DFCS could easily allow a 0% - 7%<br />
unstable aircraft takeoff and land.<br />
The wing was placed and the empennage sized for the Vendetta to be 5% unstable in the<br />
subsonic regime and 7% stable in the supersonic regime without CG modification due to the<br />
12% shift. The fuel management system could then be used to enhance cruise performance by<br />
pumping fuel in a way which results in neutral or marginal static stability.<br />
A DFCS will not impact the design too much because complex navigation and autopilot systems<br />
will already have to be incorporated into the design. In addition to this, the DCFS will be used to<br />
enhance the dynamic modes of the aircraft. These may require it due to the large fore body and<br />
unstable pitch break exhibited by the Vendetta. Also, the 2010 delivery date will mean that next<br />
generation control laws and hardware could be implemented. All modern fighters being designed<br />
today utilize such systems already. The DFCS along with the fuel management system would<br />
maintain the static and dynamic stability.<br />
DATCOM and the compiled Digital DATCOM Fortran code proved to be useful tools in<br />
calculating many of the aerodynamic stability and control derivatives for the Vendetta. This was<br />
done in an attempt to identify problematic behaviors and to adhere to MIL-8785C.<br />
It was calculated that the Vendetta’s fuselage fore body will destabilize the aircraft an additional<br />
3.1% in subsonic cruise and 5.0% in supersonic cruise. The wing was placed to account for this.<br />
This is much improved over previous configurations where the fuselage destabilized the aircraft<br />
up to 16%. This is due to the fact that so fuselage with a large mean width was in front of the CG<br />
and NP.<br />
Figure 10.7 shows the Vendetta’s pitch break characteristics in the subsonic low speed and<br />
supercruise regimes given a CG location that would yield a statically stable aircraft.<br />
67
-0.6<br />
-0.4<br />
UNSTABLE<br />
NEUTRAL<br />
-0.2<br />
Lift Coefficient (C L )<br />
-0.25 -0.2 -0.15 -0.1 -0.05 0 0.05 0.1 0.15 0.2 0.25<br />
0<br />
0.2<br />
0.4<br />
M = 0.2<br />
M = 1.6<br />
0.6<br />
0.8<br />
Moment Coefficient (C m )<br />
Figure 10.7 - Pitch Break Characteristics<br />
This figure shows that as the Vendetta rotates and has some angle of attack in the low speed<br />
subsonic (M=0.2) regime, it will want to continue to rotate and break away. In the supercruise,<br />
the aircraft behaves mush more linearly. The subsonic characteristics are of some concern, but<br />
even simple feedback schemes in the DFCS could solve this problem. The supersonic<br />
characteristics are actually more desirable because the maneuvering required is very light and the<br />
control system will not be oscillating the control surfaces, which creates unnecessary drag, to<br />
keep the aircraft flying straight.<br />
A full state-space based model for the aircraft driven by a Taylor expansion and fit into equations<br />
of motion was developed for flight simulator validation. These forms are too complex for simple<br />
dynamic analysis, so the literal factor forms of the dynamics modes were used to determine<br />
flying qualities and conformity with MIL-8785C.<br />
The literal factors are nothing more than simplifications of the transfer function forms for<br />
longitudinal and lateral modes of interest. These forms omit insensitive stability derivatives. The<br />
literal factor forms for the modes of interest are provided in the Appendix. The conformity with<br />
the military specifications for handling quality is shown in Table 10.IV.<br />
68
Mode<br />
Table 10.IV - Longitudinal and Lateral Dynamic Mode Conformity with MIL-8785C<br />
Damping ratio (ζ) Natural Frequency (ω n )<br />
Vendetta MIL-8785C Vendetta MIL-8785C<br />
MIL-8785C<br />
Level<br />
Phugoid 0.094 > 0.04 0.091 - I<br />
Short Period 0.921 0.35 – 1.3 4.721 - I<br />
Dutch Roll 0.103 > 0.08 1.960 > 0.4 I<br />
Table 10.IV shows that the Vendetta satisfies all of the military specifications for these three<br />
important modes while in a subsonic cruise with the CG monitor. The only thing of concern<br />
regarding these results is high value for undamped natural frequency in the Dutch Roll mode. It<br />
is not uncommon for aircraft of this size and type to incorporate fairly simple yaw dampers<br />
operating on the yaw rate. With the use of the DFCS, the Vendetta would have no problem<br />
keeping that mode in control. Because there is a large amount of robustness available with CG<br />
excursion and the DFCS, the longitudinal modes are well within the Type I military<br />
specifications and would remain there in the supercruise.<br />
69
Validation of an aircraft design such as this is fairly hard to accomplish with traditional models.<br />
Traditional wind tunnel testing is limited to the availability of supersonic wind tunnels. Because<br />
of this, the <strong>Cal</strong> <strong>Poly</strong> Pheagle Flight Simulator was used to evaluate handling qualities, ground<br />
handling due to landing gear placement, up-and-away tasks, and low speed performance.<br />
A non-linear table lookup scheme was incorporated in the computer simulation to lookup the<br />
DATCOM derived stability and control derivatives. These derivatives were used to develop<br />
tables for the major derivatives as functions of Mach number and angle of attack. The simulator<br />
and flight cab are shown as Figure 10.8 and Figure 10.9, respectively.<br />
Figure 10.8 - Pheagle Simulator<br />
Figure 10.9 - Flight Cab and Instruments<br />
The static flight cab allows the pilot to see the a full panel of operational instruments as well as<br />
feel up to 50 pounds of force on the stick. The stick used was that from an F-15 Eagle. Graphics<br />
models were incorporated for pilot cues and situational awareness as seen in Figure 10.10. A full<br />
HUD was also incorporated and used as illustrated in Figure 10.11. Stick forces and dynamics<br />
were approximated based on existing information from current fighter aircraft.<br />
Figure 10.10 - Graphics and Environment<br />
Figure 10.11 - Heads up Display<br />
Results of validation proved that the DFCS control laws would need to be developed for the<br />
aircraft to be flyable in all flight regimes.<br />
70
11 Performance<br />
11.1 Performance Requirements<br />
The performance requirements listed in the RFP, shown in Table 11.I, consist of specific excess<br />
power requirements, a turn rate requirement, mission requirements, and takeoff and landing<br />
requirements. The specific excess power and turn rate requirements are measured at maneuver<br />
weight, which is defined as 50% internal fuel, and a payload of 2 × AIM-120 AMRAAM’s and 4<br />
× 2,000 lb (907 kg) JDAM’s. The mission requirements are defined as the ability to perform the<br />
design mission listed in Table 11.II.<br />
Table 11.I - RFP Performance Requirements<br />
Supercruise Mission Radius<br />
1,750 nm (3,240 nm)<br />
Supercruise Mach Number 1.6<br />
1g Military Specific Excess Power at 50,000 ft & Mach 1.6 0 ft/s (0 m/s)<br />
1g Maximum Specific Excess Power at 50,000 ft & Mach 1.6 200 ft/s (61.0 m/s)<br />
2g Maximum Specific Excess Power at 50,000 ft & Mach 1.6 0 ft/s (0 m/s)<br />
Maximum Instantaneous Turn Rate at 15,000 ft & Mach 0.9 8.0 deg/s<br />
Takeoff Field Length 8,000 ft (2,438 m)<br />
Landing Field Length (Icy) 8,000 ft (2,438 m)<br />
Table 11.II - RFP Design Mission<br />
1. Takeoff and acceleration allowance<br />
a. Fuel allowance for warm-up<br />
b. Fuel to accelerate to climb speed at maximum thrust (no distance credit)<br />
2. Climb from sea-level to optimum supercruise altitude<br />
3. Supercruise 1,000 nm (1,852 km) at Mach 1.6 and optimum altitude<br />
4. Climb above 50,000 ft (15,240 m)<br />
5. Dash 750 nm (1,389 km) at Mach 1.6 above 50,000 ft (15,240 m)<br />
6. Weapons delivery<br />
a. 180º turn at 50,000 ft (15,240 m) and Mach 1.6<br />
b. Drop air-to-surface weapons<br />
7. Dash 750 nm (1,389 km) at Mach 1.6 above 50,000 ft (15,240 m)<br />
8. Supercruise 1,000 nm (1,852 km) at Mach 1.6 and optimum altitude<br />
9. Descend to sea-level (no distance credit or fuel used)<br />
10. Reserve for 30 min at sea-level and speed for maximum endurance<br />
The RFP design mission explicitly defines some aspects of the required mission, while other<br />
aspects of the mission such as cruise altitudes and loiter speed are arbitrary. Within the<br />
constraints of the design mission, a detailed mission was created and optimized to minimize fuel<br />
71
consumption. The main aspects of the mission that were optimized were the initial climb<br />
sequence, the cruise and dash altitudes (dash altitude must be greater than 50,000 ft (15,240 m)),<br />
and the loiter speed. The optimum climb sequence was found by creating a flight envelope with<br />
lines of constant climb rate to fuel flow ratio (dh/dW F ) at the average climb weight of the<br />
aircraft. The climb profile that minimizes the fuel required to climb the aircraft to a given cruise<br />
condition is then found by drawing a flight path between the initial and cruise conditions that<br />
follow the maximum climb rate to fuel flow ratio. The resulting flight path and fuel<br />
consumption envelope are shown in Figure 11.1.<br />
50,000<br />
dh /dW F = 0 ft/lb<br />
100 ft/lb<br />
40,000<br />
Stall Limit<br />
50 ft/lb<br />
Altitude (ft)<br />
30,000<br />
20,000<br />
100 ft/lb<br />
150 ft/lb<br />
200 ft/lb<br />
250 ft/lb<br />
10,000<br />
300 ft/lb<br />
q Limit<br />
0<br />
0 0.5 1 1.5 2<br />
Mach<br />
Figure 11.1 - Fuel Consumption Envelope at Average Climb Weight<br />
The optimum cruise and dash altitudes were found by running a series of missions at different<br />
altitudes and finding the mission with the lowest fuel consumption. Because the aircraft’s<br />
weight decreases as fuel is burned, the optimum cruise altitude increases over the mission<br />
profile. It was found that the optimum sequence of cruise altitudes began at 52,000 ft (15,850 m)<br />
for the initial cruise and increased by 2,000 ft (610 m) for each successive cruise or dash segment<br />
resulting in a final cruise altitude of 58,000 ft (17,678 m). The optimum loiter speed was found<br />
as the speed at which the minimum drag occurred under loiter conditions (sea level and 61,000 lb<br />
(27,669 kg) weight). The drag on the aircraft under these conditions is plotted as a function of<br />
Mach number in Figure 11.2 showing that the minimum drag occurs at Mach 0.35 or 391 ft/s<br />
(119.2 m/s). The resulting detailed mission is listed in Table 11.III.<br />
72
30,000<br />
25,000<br />
Wave Drag<br />
Drag (lb)<br />
20,000<br />
15,000<br />
Sea-Level<br />
Loiter Weight<br />
10,000<br />
5,000<br />
Induced Drag<br />
Parasite Drag<br />
0<br />
0 0.2 0.350.4 0.6 0.8 1 1.2<br />
Mach<br />
Figure 11.2 - Drag on Aircraft in Loiter Conditions<br />
Table 11.III - Detailed Design Mission<br />
1. Warm-up 2 min at idle thrust<br />
2. Takeoff – Accelerate to takeoff speed 266 ft/s (81.1 m/s)<br />
3. Accelerate to Mach 0.86 at maximum military thrust<br />
4. Climb to 15,000 ft (4,572 m) and accelerate to Mach 0.9<br />
5. Climb to 17,500 ft (5,334 m) and accelerate to Mach 1.25<br />
6. Climb to 33,000 ft (10,058 m) and accelerate to Mach 1.72<br />
7. Climb to 45,000 ft (13,716 m) at Mach 1.72<br />
8. Climb to 52,000 ft (15,850 m) and decelerate to Mach 1.6<br />
9. Cruise 1,000 nm (1,852 km) at 52,000 ft (15,850 m) and Mach 1.6<br />
10. Climb to 54,000 ft (16,459 m) at Mach 1.6<br />
11. Dash 750 nm (1,389 km) at 54,000 ft (16,459 m) and Mach 1.6<br />
12. Descend to 50,000 ft (15,240 m) at Mach 1.6<br />
13. Turn 180º at n = 1.55<br />
14. Drop 4 × 2,000 lb (907 kg) JDAM’s<br />
15. Climb to 56,000 ft (17,069 m) at Mach 1.6<br />
16. Dash 750 nm (1,389 km) at 56,000 ft (17,069 m) and Mach 1.6<br />
17. Climb to 58,000 ft (17,678 m) at Mach 1.6<br />
18. Cruise 1,000 nm (1,852 km) at 58,000 ft (17,678 m) and Mach 1.6<br />
19. Descend to Sea-Level and decelerate to loiter speed 391 ft/s (119.2 m/s)<br />
20. Loiter 30 min at Sea-level and 397 ft/s (121.0 m/s)<br />
21. Decelerate to landing speed 266 ft/s (81.1 m/s)<br />
22. Land – decelerate to zero speed<br />
23. Unload non-fixed equipment (2 × AMRAAM’s and crew 1,280lb (5,806 kg))<br />
73
In addition to the performance requirements, the RFP includes performance measures of merit<br />
listed in Table 11.IV. The measures of merit are not specific requirements, but are measures by<br />
which competing aircraft will be judged.<br />
Table 11.IV - Performance Measures of Merit<br />
Mission duration, radius, and fuel burn by mission segment for design mission<br />
Takeoff and landing distance for design mission on dry and icy runways at sea-level<br />
Maximum Mach number at 36,000 ft (10,973 m)<br />
1g Maximum thrust specific excess power envelope<br />
2g Maximum thrust specific excess power envelope<br />
5g Maximum thrust specific excess power envelope<br />
Maximum thrust sustained load factor envelope<br />
Maximum thrust maneuvering performance diagrams at sea-level and 15,000 ft (4,572 km)<br />
11.2 Specific Excess Power Requirements<br />
Compliance with the specific excess power requirements is best shown using specific excess<br />
power envelopes. Figure 11.3 shows the 1g military specific excess power envelope. The RFP<br />
requirement of 0 ft/s (0 m/s) at Mach 1.6 and 50,000 ft (15,240 m) is met with 95.7 ft/s (29.2<br />
m/s) specific excess power. The 1g maximum (afterburner) specific excess power envelope,<br />
shown in Figure 11.4, shows that the RFP requirement of 200 ft/s (61.0 m/s) at Mach 1.6 and<br />
50,000 ft (15,240 m) is met with a value of 316 ft/s (96.3 m/s). This envelope also shows that<br />
the maximum Mach number at 36,000 ft (10,973 m) is 2.1. The 2g maximum specific excess<br />
power envelope, shown in Figure 11.5, shows that the RFP requirement of 0 ft/s (0 m/s) at Mach<br />
1.6 and 50,000 ft (15,240 m) is met with a value of 108 ft/s (32.9 m/s).<br />
74
70,000<br />
60,000<br />
50,000<br />
Stall Limit<br />
P s = 0 ft/s<br />
RFP Requirement 0 ft/s<br />
P s = 200 ft/s<br />
Altitude (ft)<br />
40,000<br />
30,000<br />
P s = 100 ft/s<br />
Flaps<br />
P s = 200 ft/s<br />
20,000<br />
P s = 300 ft/s<br />
q Limit<br />
10,000<br />
P s = 400 ft/s<br />
0<br />
0 0.5 1 1.5 2 2.5<br />
Mach<br />
Figure 11.3 - 1g Military Specific Excess Power Envelope at Maneuver Weight<br />
70,000<br />
P s = 0 ft/s<br />
60,000<br />
Stall Limit<br />
50,000<br />
RFP Requirement 200 ft/s<br />
Altitude (ft)<br />
40,000<br />
30,000<br />
20,000<br />
Flap<br />
P s = 200 ft/s<br />
P s = 400 ft/s<br />
P s = 600 ft/s<br />
P s = 600 ft/s<br />
q Limit<br />
10,000<br />
P s = 800 ft/s<br />
0<br />
0 0.5 1 1.5 2 2.5<br />
Mach<br />
Figure 11.4 - 1g Maximum Specific Excess Power Envelope at Maneuver Weight<br />
75
70,000<br />
Altitude (ft)<br />
60,000<br />
50,000<br />
40,000<br />
30,000<br />
20,000<br />
10,000<br />
Stall Limit<br />
P s = 200 ft/s<br />
P s = 400 ft/s<br />
P s = 600 ft/s<br />
P s = 0 ft/s<br />
RFP Requirement 0 ft/s<br />
P s = 600 ft/s<br />
q Limit<br />
0<br />
0 0.5 1 1.5 2 2.5<br />
Mach<br />
Figure 11.5 - 2g Maximum Specific Excess Power Envelope at Maneuver Weight<br />
11.3 Turn Rate Requirement<br />
The maximum instantaneous turn rate requirement of 8.0 deg/s at 15,000 ft (4,572 m) and Mach<br />
0.9 is shown in the maneuverability diagram at 15,000 ft (4,572 m) in Figure 11.6. The<br />
maneuverability diagram shows that the required turn can be sustained with military power. The<br />
maximum sustainable turn rate under maximum power is 13.1 deg/s.<br />
76
30<br />
n<br />
2<br />
3<br />
4 5 6 7<br />
r = 2,000 ft<br />
25<br />
r = 4,000 ft<br />
Turn Rate (deg/s)<br />
20<br />
15<br />
10<br />
5<br />
Stall Limit<br />
Max. P s = 0<br />
Mil. P s = 0<br />
RFP Requirement<br />
8 deg/s<br />
r = 6,000 ft<br />
r = 8,000 ft<br />
r = 10,000 ft<br />
q Limit<br />
0<br />
0 0.2 0.4 0.6 0.8 1 1.2 1.4 1.6 1.8 2<br />
Mach<br />
Figure 11.6 - Maneuverability Diagram at 15,000 ft (4,572 m) and Maneuver Weight<br />
77
11.4 Mission Requirements<br />
By completing the design mission, the requirements for a supercruise Mach number of 1.6 and<br />
mission radius of 1,750 nm (3,240 km) are met. To determine the fuel capacity required to<br />
perform the design mission, the mission was simulated by numerically integrating the fuel burn<br />
rates over the mission profile. The mission simulation also allowed certain aspects of the<br />
mission such as cruise altitudes to be optimized. Table 11.V lists the results of the mission<br />
simulation, Figure 11.7 shows a breakdown of fuel consumption by mission segment, and Table<br />
11.VI lists the fuel consumption by mission segment.<br />
Reserve<br />
4%<br />
Misc.<br />
5%<br />
Accelerate &<br />
Climb<br />
12%<br />
Cruise Back<br />
18%<br />
Cruise Out<br />
28%<br />
Dash Back<br />
15%<br />
Dash Out<br />
18%<br />
Figure 11.7 - Fuel Consumption over Mission<br />
Table 11.V - Mission Results<br />
Total fuel consumption<br />
57,940 lb (26,280 kg)<br />
Mission radius<br />
1,750 nm (3,240 km)<br />
Total distance traveled over mission 3,980 nm (7,370 km)<br />
Total mission duration<br />
4 hr. 57 min.<br />
Takeoff weight<br />
124,800 lb (56,610 kg)<br />
Empty weight<br />
56,270 lb (25,520 kg)<br />
Fuel weight (total fuel onboard) 59,250 lb (26,880 kg)<br />
Maneuver weight<br />
95,830 lb (43,470 kg)<br />
Landing weight<br />
57,550 lb (26,100 kg)<br />
Average cruise lift to drag ratio 6.6<br />
78
Table 11.VI - Fuel Consumption by Mission Segment<br />
1. Warm-up 2 min at idle thrust 83 lb (37.6 kg)<br />
2. Takeoff (Accelerate to takeoff speed 266 ft/s) 174 lb (78.9 kg)<br />
3. Accelerate to Mach 0.86 at maximum military thrust 741 lb (336.1 kg)<br />
4. Climb to 15,000 ft and accelerate to Mach 0.9 724 lb (328.4 kg)<br />
5. Climb to 17,500 ft and accelerate to Mach 1.25 935 lb (424.1 kg)<br />
6. Climb to 33,000 ft and accelerate to Mach 1.72 3,528 lb (1,600.2 kg)<br />
7. Climb to 45,000 ft at Mach 1.72 805 lb (365.1 kg)<br />
8. Climb to 52,000 ft and decelerate to Mach 1.6 214 lb (97.1 kg)<br />
9. Cruise 1,000 nm at 52,000 ft and Mach 1.6 15,893 lb (7,208.9 kg)<br />
10. Climb to 54,000 ft at Mach 1.6 262 lb (118.8 kg)<br />
11. Dash 750 nm at 54,000 ft and Mach 1.6 10,589 lb (4,803.1 kg)<br />
12. Descend to 50,000 ft at Mach 1.6 53 lb (24.0 kg)<br />
13. Turn 180º at n = 1.55 658 lb (298.5 kg)<br />
14. Drop 4 × 2,000 lb JDAM’s 0 lb (0 kg)<br />
15. Climb to 56,000 ft at Mach 1.6 381 lb (172.8 kg)<br />
16. Dash 750 nm at 55,000 ft and Mach 1.6 8,879 lb (4,027 kg)<br />
17. Climb to 58,000 ft at Mach 1.6 139 lb (63.0 kg)<br />
18. Cruise 1,000 nm at 58,000 ft and Mach 1.6 10,532 lb (4,777.2 kg)<br />
19. Descend to Sea-Level and decelerate to loiter speed (391 737 lb (334.3 kg)<br />
ft/s)<br />
20. Loiter 30 min at Sea-level and 397 ft/s 2,453 lb (1112.6 kg)<br />
21. Decelerate to landing speed 266 ft/s 132 lb (59.9 kg)<br />
22. Land (decelerate to zero speed) 25 lb (11.3 kg)<br />
23. Unload non-fixed equipment (2 × AMRAAM’s and crew<br />
1,280lb)<br />
0 lb (0 kg)<br />
11.5 Takeoff & Landing<br />
The RFP requires that the aircraft be able to takeoff and land on an icy standard NATO runway<br />
8,000 ft (2,438 m) long. Takeoff and landing calculations were done according to MIL-C5011A.<br />
Takeoff and landing were simulated by numerically integrating velocity and rate of climb to<br />
determine distances and altitudes over a standard flight profile. Additional drag due to flaps and<br />
landing gear was taken into account for takeoff and landing as well as -25% military thrust from<br />
a thrust reverser during landing. The takeoff and landing profiles used in the simulation are<br />
listed in Table 11.VII and Table 11.VIII.<br />
Table 11.VII - Takeoff Flight Profile<br />
1. Ground roll under max. power up to 1.2 V stall<br />
2. Rotate for 3 s<br />
3. 1.15g pull-up to transition to climb<br />
4. Climb out at a 10º climb angle over 50 ft obstacle<br />
79
Table 11.VIII - Landing Flight Profile<br />
1. Approach from 50 ft obstacle on 3º glide slope<br />
2. 1.15g pull-up for flare – touchdown at 1.2 V stall<br />
3. Roll for 3 s<br />
4. Brake and apply thrust reversers until stopped<br />
MIL-C5011A defines field length to be the distance required to takeoff and clear a 50 ft (15.2 m)<br />
obstacle or the distance to land from a 50 ft (15.2 m) obstacle. Takeoff and touchdown speed are<br />
defined as 1.2 times the aircraft’s stall speed, and the speed over the 50 ft (15.2 m) obstacle must<br />
be greater or equal to 1.3 times the stall speed for both takeoff and landing. The takeoff gross<br />
weight for the design mission of 124,800 lb (56,610 kg) was used for the aircraft weight for both<br />
takeoff and landing calculations. This allows the aircraft to land immediately after takeoff<br />
without the need to jettison fuel or weapons. Takeoff and touchdown speeds were always greater<br />
than the required 1.2 stall speed because of the acceleration during the 3 second rotation and roll<br />
periods. During takeoff, due to the high speeds of the aircraft, the 50 ft (15.2 m) obstacle was<br />
cleared before the climb angle was reached, so the climb segment of the profile was ignored.<br />
Also, to simplify the calculations, the landing simulation was run backward so that the<br />
touchdown point could be found without having to calculate the altitude and speed at the<br />
beginning of the flare necessary to have the touchdown occur at the correct altitude and speed.<br />
The results of the takeoff and landing simulations that are listed in Table 11.IX and Table 11.X<br />
show that the RFP requirements for takeoff and landing on an icy 8,000 ft (2,438 m) runway are<br />
met.<br />
Table 11.IX - Takeoff Results<br />
Weight<br />
124,800 lb (56,610 kg)<br />
Maximum lift coefficient 1.2<br />
Stall speed 242 ft/s (73.7 m/s)<br />
Takeoff speed 266 ft/s (81.1 m/s)<br />
50 ft obstacle speed ≥ 290 ft/s (88.4 m/s) 326 ft/s (99.4 m/s)<br />
Rolling friction coefficient 0.025<br />
Runway length 3,842 ft (1,171 m)<br />
Field length over 50 ft obstacle 5,280 ft (1,609 m)<br />
80
Table 11.X - Landing Results<br />
Weight<br />
124,800 lb (56,610 kg)<br />
Maximum lift coefficient 1.2<br />
Stall speed 242 ft/s (73.7 m/s)<br />
Takeoff speed 266 ft/s (81.1 m/s)<br />
50 ft obstacle speed ≥ 290 ft/s (88.4 m/s) 294 ft/s (89.6 m/s)<br />
Dry braking friction coefficient 0.3<br />
Icy braking friction coefficient 0.1<br />
Thrust reverser effectiveness<br />
25% Mil.<br />
Dry runway length 3,857 ft (1,176 m)<br />
Dry field length over 50 ft obstacle 5,256 ft (1,602 m)<br />
Icy runway length 5,707 ft (1,739 m)<br />
Icy field length over 50 ft obstacle 7,107 ft (2,166 m)<br />
11.6 Performance Summary<br />
As shown above, the Vendetta meets all performance requirements in the RFP. A summary of<br />
the performance requirements is shown in Table 11.XI.<br />
Table 11.XI - Performance Summary<br />
Requirement<br />
Value<br />
Supercruise Mach Number 1.6 1.6<br />
Supercruise Mission Radius 1,750 nm (3,240 km) 1,750 nm (3,240 km)<br />
Dash Altitude > 50,000 ft (15,240 km) > 54,000 ft (16,460 km)<br />
1g Mil. Ps M = 1.6, 50,000 ft 0 ft/s (0 m/s) 95.7 ft/s (29.2 m/s)<br />
1g Max. Ps M = 1.6, 50,000 ft 200 ft/s (61.0 m/s) 316 ft/s (96.3 m/s)<br />
2g Max. Ps M = 1.6, 50,000 ft 0 ft/s (0 m/s) 108 ft/s (32.9 m/s)<br />
Max. Turn Rate M = 0.9, 15,000 ft 8 deg/s 13.1 deg/s<br />
Takeoff Field Length 8,000 ft (2,438 m) 5,280 ft (1,609 m)<br />
Landing Field Length 8,000 ft (2,438 m) 7,107 ft (2,166 m)<br />
Fuel Burn Over Mission ─ 57,940 lb (26,280 kg)<br />
Maximum Mach Number at 36,000 ft ─ 2.1<br />
81
11.7 Alternate Missions<br />
In addition to the design mission, the Vendetta shows great performance on alternate missions.<br />
The multi purpose rotary launcher (MPRL), shown in Figure 11.8, carried by the Vendetta allows<br />
it to carry a total of 8 × 2,000 lb (907 kg) bombs compared to the 4 required for the design<br />
mission (no AMRAAM’s can be carried in this configuration.) Compared to an earlier custom<br />
designed rotary launcher, the MPRL has only a 4 in (10 cm) greater diameter. The extra cross<br />
sectional area due to the MPRL only adds approximately 1,300 lb (590 kg) of fuel consumption<br />
for the design mission. The performance of the Vendetta over three alternate missions was<br />
calculated. Fully loaded missions and subsonic missions flown at Mach 0.8 and an altitude of<br />
approximately 30,000 ft (9,144 m) were considered. The results shown in Table 11.XII indicate<br />
that only a small loss of range occurs due to the additional weight of 8 × 2,000 lb (907 kg)<br />
bombs, and the range of the aircraft can be greatly extended by flying subsonic (although it<br />
extends the mission to 11 hours long.)<br />
Figure 11.8 - MPRL with 8 × 2,000 lb (907 kg) JDAM’s<br />
82
Table 11.XII - Alternate Mission Results<br />
Design Mission<br />
Mission Radius 1,750 nm (3,240 km)<br />
Takeoff Weight<br />
124,800 lb (56,610 kg)<br />
Mission Time<br />
4 hr. 57 min.<br />
8 × 2,000 lb (907 kg) bombs – Supersonic<br />
Mission Radius 1,690 nm (3,130 km)<br />
Takeoff Weight<br />
132,800 lb (60,240 kg)<br />
Mission Time<br />
4 hr. 51 min.<br />
4 × 2,000 lb (907 kg) bombs – Subsonic<br />
Mission Radius 2,380 nm (4,410 km)<br />
Takeoff Weight<br />
124,800 lb (56,610 kg)<br />
Mission Time<br />
11 hr. 16 min.<br />
8 × 2,000 lb (907 kg) bombs – Subsonic<br />
Mission Radius 2,300 nm (4,260 km)<br />
Takeoff Weight<br />
132,800 lb (60,240 kg)<br />
Mission Time<br />
10 hr. 56 min.<br />
83
12 Payload<br />
Weapon internal layout drove the Vendetta’s size and layout. For small C.G. excursion due to<br />
weapons deployment all stores<br />
were initially positioned as close to<br />
the C.G as possible. As shown in<br />
Figure 12.1, three configurations<br />
were produced. Configuration one<br />
utilizes a standard weapons bay<br />
configuration. The large weapons<br />
bay drove the configuration to over<br />
120 ft (36.576m) in length when<br />
room for landing gear and<br />
weapons targeting systems were<br />
integrated. In an effort to decrease<br />
overall size a small rotary launcher<br />
was designed and integrated into a<br />
second configuration. This step<br />
increased the maximum cross<br />
sectional area by 5ft 2 (0.464m 2 Figure 12.1 - L to R configurations 1, 2, 3<br />
)<br />
and shortened the length of the<br />
aircraft to 95ft (28.9m).<br />
Figure 12.2 - 180 inch MPRL<br />
The next iteration of the design utilized the<br />
existing 180in (4.57m) MPRL out of the B-1B<br />
and shown in Figure 12.2. This caused the final<br />
configuration to grow to 105ft (32m) in length<br />
and maximum cross sectional area of 55 ft 2<br />
(5.11m 2 ). Utilizing the MPRL allowed for a wide<br />
selection of alternate missions and configurations<br />
to be discussed later.<br />
In an effort to ascertain the feasibility of RFP delineated weapons as supersonic deployment<br />
candidates research was done for each proposed system. As can be seen<br />
in the foldout only one of all of the weapons has even been wind tunnel<br />
tested for supersonic deployment. This led to the proposed systems for<br />
possible supersonic deployment.<br />
Retrofitting many of the weapon systems with a ballute and sabot,<br />
shown in Figure 12.3, would aide in supersonic stability. The use of a<br />
bomb bay supersonic flow deflector and acoustical resonance damping<br />
system as well as flow modification system would aide in deployment.<br />
Figure 12.3 - Ballute<br />
and Sabot<br />
84
Standard ten degree fall clearance is maintained for all weapons<br />
stowed and weapons bay doors were designed to rotate into the<br />
bomb bay, shown in Figure 12.4, and not into the free stream.<br />
Rotating the bomb bay doors into the fuselage has no detrimental<br />
effects on lateral stability, allows for the usage of lighter bomb bay<br />
doors, and lowers the radar cross section of the aircraft when the<br />
bomb bay is open versus a door which opens into the free stream<br />
such as those found on the F-117.<br />
Figure 12.5 - 30in (76.2cm)<br />
Ejector rack<br />
Alternative<br />
uses for the Vendetta is the main<br />
reasoning behind the choice of the<br />
MPRL. According to MIL-A-8861B a<br />
fighter/attack aircraft must be capable of<br />
withstanding, under “basic flight design<br />
gross weight” +7.5, -3 g’s. under<br />
“maximum design gross weight” +5.5,<br />
-2 g’s. According to the RFP we must<br />
Figure 12.4 - Bomb Bay<br />
Door Retraction Scheme<br />
In an effort to minimize undesirable underbody flow the entire<br />
underside of the aircraft was kept as flat as possible. The MPRL<br />
chosen allows the use of 30in (76.2cm) ejector racks shown in Figure<br />
12.5. The rack has electrically fired impulse cartridges, a gas operated<br />
mechanism, and is designed to forcibly eject conventional or nuclear<br />
stores up to 4000 lb (1810 kg) weight class. The LAU-142A ejector<br />
was used with the AIM-120C shown in Figure 12.6.<br />
be able, with the design load, and 50% of fuel volume structurally be able to withstand +7 -3 g’s.<br />
Thus it is conceivable to design the aircraft to structurally withstand the RFP’s mandated +7 -3 g<br />
loading with the RFP design load of (4) 2000lb (905 kg) JDAMs and (2) AIM-120’s.<br />
Alternatively the aircraft could then be loaded with (8) 2000 lb (905 kg) JDAM’s shown in<br />
Figure 12.7, and still meet the military specification of +5.5 -2 g’s at “maximum design gross<br />
weight”. This fully satisfies the RFP and military specifications.<br />
This doubling of weapons load shortens mission radius by<br />
150 miles (241 km) (see performance section). Alternative<br />
mission configurations might also include eight 2000lb (905<br />
kg) fuel tanks for increased ferry range or 8 JASSM next<br />
generation cruise missiles specifically designed for the B-1’s<br />
MPRL.<br />
Weapons guidance is accomplished with the on board<br />
INS/GPS system (all weapons), a AN/APG-77 radar system<br />
(AIM-120 guidance) as well as an on-board second<br />
generation tessa LANTIRN system (laser designated<br />
weapons). More detailed information on weapons can be found in Foldout 2 of the Appendix.<br />
Figure 12.7 - (8) 2000lb JDAM + MPRL<br />
Figure 12.6 - LAU-142A Ejection Sequence<br />
85
13 Cockpit<br />
Cockpit Design began with the RFP requirement of a crew of two. Comparison trades of tandem<br />
versus side-by-side seating configurations were performed as shown in Figure 13.1. Analysis of<br />
the two configurations was based upon a cockpit solid model where instrumentation, controls,<br />
circuit breakers and military aft pilot vision requirements (MIL-STD-850B) were used to<br />
construct the tandem and side by side arrangements.<br />
Figure 13.1 - Cockpit Width Trade Study<br />
Tandem vs. side by side configuration has very little effect on frontal area of the cockpit<br />
configuration in military aircraft. It was found due to instrumentation and control placement,<br />
which were the major cockpit width contributors, that other factors must be taken into account<br />
before a final decision could be made on pilot placements. Weapons configuration, the use of the<br />
180 in (457 cm) MPRL, favored side by side seating placement. The rational was the width of<br />
the rotary launching system allowed for the use of a side-by-side seating arrangement. This<br />
arrangement allowed greater pilot communication as well as<br />
the elimination of many redundant circuit breakers as well as<br />
instrumentation. However preliminary stability and control<br />
analysis revealed a need to narrow the forward fuselage, as<br />
shown in Figure 13.2, due to adverse C mα characteristics of a<br />
wide nose section (see stability and control section).<br />
Figure 13.2 - Forward fuselage<br />
Comparisons<br />
Therefore the decision was made to utilize a tandem seating<br />
configuration. This configuration offered a smaller frontal<br />
area, a much more ideal supersonic (M=1.6) area plot, and a<br />
better field of vision for the primary pilot.<br />
86
Table 13.I - Military Vision Specifications<br />
Forward Pilot<br />
5.1.1 Vision<br />
azimuth<br />
(°)<br />
up<br />
(°)<br />
down<br />
(°)<br />
0 10 11<br />
20 20<br />
30 25<br />
90 40<br />
135 20<br />
11°<br />
5°<br />
5.1.2 Aft Pilot Position<br />
0 5<br />
Figure 13.3 - Virtual Cockpit Model<br />
Utilizing this information the virtual cockpit model shown in Figure 13.3 was generated. The<br />
solid model also took into account the use of an ejection seat, room for instrumentation, controls,<br />
switch placement as well as the above military vision specifications.<br />
Further vision refinement produced rectilinear vision plots as shown in Figure 13.4.<br />
Canopy reinforcing structure was removed from the areas between 25° and 40° up to aide in inflight<br />
refueling vision. Runway vision areas are defined and every effort was made to increase<br />
downward vision to aide in ground handling as well as takeoff and landing.<br />
Takeoff and Landing vision is inherently limited in supersonic aircraft. In an effort to reduce<br />
pilot workload and increase flight ability, multifunction displays (MFD) in modern aircraft can<br />
double as vision aid tools. MFD 1 incorporated into the glare shield and upper instrument panel<br />
Figure 13.4 – Rectilinear Vision Plot of Forward Cockpit Position<br />
87
that could be used in landing and takeoff to increase downward<br />
vision, meshing seamlessly with the actual cockpit over nose<br />
view shown in Figure 13.5.<br />
MFD’s 2, 3, and 4 display moving map imagery, flight critical<br />
data, and mission critical information. The moving map<br />
display could also double in landings as another artifical vision<br />
aide. Perhaps utilizing infra-red or other electromagnetic<br />
spectrums for poor weather penetration and increased all<br />
weather capabilities. The standard dash mounted HUD was<br />
dropped in favor of a current helmet mounted HUD systems<br />
under development shown in Figure 13.6. The HUD allows far<br />
superior situational awareness as well as more aerodynamic<br />
canopy configuration.<br />
Figure 13.5 - Cockpit Display<br />
Arrangement<br />
Figure 13.6 - Helmet<br />
Mounted HUD<br />
Aircrew safety was a primary concern in the design of Vendetta. Due to<br />
RFP requirements the majority of the Vendetta’s mission will occur<br />
above the military specified ceiling for flight without a full pressure suit<br />
(50,000ft). Further research revealed the reasoning behind the<br />
specification. The NASA Bioastronautics study SP-3006 shows that<br />
animal and human life functions become critically affected by the lower<br />
oxygen content and lower pressure of the upper atmosphere. The study<br />
outlines how physiological effects such as the bends and hypoxia as<br />
well as the extremely low temperatures of high altitude within seconds<br />
render a human unconscious and dead in a mater of minutes. Also<br />
outlined is the Armstrong Line (63,000 ft), or the altitude at which<br />
water, at room temperature, will freely boil. In the study it shows how<br />
animals survived momentary exposure to altitudes higher than 63,000ft<br />
due to intravenous pressure keeping the blood within their veins liquid.<br />
Balancing this information against the economics and long prep and turn around time associated<br />
with full pressure suits the decision was made to opt for a partial pressure suit configuration. The<br />
advanced fighter crew protection system is shown in Figure 13.8. A partial pressure suit system<br />
was developed specifically for this altitude mission. It represents the next step beyond current<br />
systems and offers low unit cost in comparison to full pressure suits as well as low turn around<br />
time due to no necessity for a suiting procedure which involves lowering of blood nitrogen levels<br />
such as those used in the U-2.<br />
88
Ejection seat trade<br />
studies will need to be<br />
performed for the<br />
final configuration.<br />
The ACES II ejection<br />
seat shown in Figure<br />
13.7 was initially<br />
chosen as the premier<br />
American seat<br />
available. However<br />
due to global politics<br />
the availability of<br />
many superior<br />
Russian seats would<br />
produce a necessary<br />
Figure 13.7 - ACES II<br />
Ejection Seat<br />
trade between increased cost of bi-lingual<br />
design teams, language retrofit on new<br />
equipment, product per system cost and the<br />
unknown safety superiority of the Russian<br />
seat(s).<br />
Figure 13.8 - AFCPS<br />
Further pilot safety issues were found in the<br />
canopy design. The use of an ejectable canopy<br />
was thrown out over the choice of a shape<br />
charge cutting system due to the possibility of<br />
aircrew and canopy striking each other after<br />
ejection.<br />
89
14 Systems<br />
The systems of the Vendetta will closely follow the design architecture of the F-22. Technology<br />
advances by 2020 will render most of the electronics aboard the F-22 antequated, thus the next<br />
generation of this system should be implemented. Design trades on communications, processor<br />
I/O (such as unified vs. federated), system redundancy, and actuation will have to be performed<br />
on the new system.<br />
14.1 Auxiliary Power Generation System<br />
The auxiliary power generation<br />
system consists of two components:<br />
an auxiliary power unit (APU) aand<br />
a self-contained energy storage<br />
system (SES). APU selection<br />
involved examining a number of<br />
mid-sized, gas turbine, generators<br />
with output exceeding the minimum<br />
350 Hp (261.1 kW) estimated as<br />
needed for the Vendetta. A<br />
shortened list appears in Table 14.I.<br />
The RFP lists an APU but research<br />
Company<br />
Table 14.I - APU Selection Table<br />
points to the cost, volume and weight of the APU specified as being a Ram Air Turbine. A Ram<br />
Air Turbine (RAT) was eliminated due to the need for ground power and previous service<br />
experience. Modern designs utilize a SES for power backup due to its higher reliability,<br />
invulnerability to aircraft maneuver position, and airspeed.<br />
Model<br />
Honeywell 131-9A<br />
Honeywell 36-300<br />
Honeywell 331-200<br />
Pratt and<br />
Whitney PW901<br />
Sundstrand<br />
Sundstrand<br />
APS2100<br />
APS3200<br />
Startup<br />
Ceiling<br />
Dry<br />
Weight Rating Power/Weight<br />
ft (m) lb (kg) kW Hp Hp/lb (kW/kg)<br />
41000 350<br />
(12497) (158) 343 460 1.31 (2.17)<br />
35000 300<br />
(10668) (136) 291 390 1.3 (2.14)<br />
43000 500<br />
(13106) (226) 432 579 1.16 (1.91)<br />
25000 835<br />
(7620) (378) 1145 1535 1.84 (3.03)<br />
37000 270<br />
(11278) (122) 376 504 1.87 (3.08)<br />
39000 305<br />
(11887) (138) 450 603 1.98 (3.26)<br />
Due to common unreliability of in-flight APU startup, startup ceiling<br />
was not seen as a major driver in APU selection. Overall high power<br />
to weight ratio as well as a rating above 350 Hp (261.1 kW) and small<br />
size was seen as the main APU selection criteria. With this in mind the<br />
Sundstrand APS 3200 was selected. Placement of the APU can be<br />
seen in Figure 14.1.<br />
Figure 14.1 - Sundstrand<br />
APS 3200 Location<br />
The SES is a design point to be focused on in the next level of design.<br />
Current hypergolically fuelled systems offer high power to weigh ratio<br />
but fuels are hazardous and expensive. Next generation fuel cell<br />
systems offer reasonably high power to weight ratios with standard<br />
JP-8. Trade studies considering cost of development, service life cost<br />
savings, and internal volume usage will have to be performed.<br />
90
14.2 Vehicle Management System<br />
The vehicle management system (VMS) of the aircraft provides flight and propulsion control and<br />
includes the following systems: Control stick, Throttle controls, Rudder pedals, and actuators,<br />
Air data probes, Accelerometers Leading-edge, flap drive actuators, Primary flight control<br />
actuators .<br />
The choice of primary actuator type was the first trade examined. Four choices are commonly<br />
available for these systems:<br />
1) Electrohydrostatic<br />
2) Electric<br />
3) Pneumatic<br />
4) Hydraulic<br />
Pneumatic systems were eliminated due to low power to weight, large comparative size, and low<br />
power transmission efficiencies. Electrohydrostatic actuators, although offering many benefits<br />
such as a “line replaceable unit”, optimized per service dynamic impedance shaping, and<br />
optimized K factor suffered from low observability and weight problems as a consequence of<br />
electric power transmission throughout the aircraft( EM emissions in the IR (actuator heating)<br />
and Radio (cables) spectra). This low observability problem to an even greater degree affected<br />
the all electric system which utilizes a comparatively large and heavy actuator.<br />
Thus the decision was made to utilize an all hydraulic system with digital fly-by-wire control.<br />
The F-119 utilized in the F-22 has a PTO driving two 72 gpm (273 lpm) pumps (main line), four<br />
pumps total to supply two independent 4000 psi (27.6 GPa) systems. The choice of the high<br />
pressure systems was due to weight and volume considerations. Peak hydraulic system demand<br />
will be satisfied via an air pressurized hydraulic reservoir allowing for a constant energy bleed<br />
from the engines.<br />
Further detail was then examined into the electric system of the aircraft. Borrowing the electrical<br />
system from the F-22, a Smiths Industries 270 volt, direct current (DC) electrical system was<br />
chosen. It uses two PTO driven 65 kilowatt generators.<br />
Next level design trade studies need to be completed on the redundancy level of the electrical<br />
and flight control systems. Flight control system design should be aimed at Operation-<br />
Operational-Operational Fail (OOOF) or better, safety design. INS/GPS and other navigational<br />
systems should be examined and a proper redundancy level chosen.<br />
91
14.3 Fuel System<br />
Initial fuel system design began with<br />
configuration placement of fuel tanks<br />
symmetrically about the CG laterally and<br />
longitudinally. The two fuselage tanks (Figure<br />
14.2) serve to trim the aircraft in flight,<br />
necessary for the shift in neutral point location<br />
due to supersonic flight.<br />
Aircraft sizing began with fuel load<br />
internal volume necessary to complete the<br />
mission. The final configuration provides for<br />
Figure 14.2 - Fuel Tank Locations in Vendetta 68,000 lb (30,770 kg) of fuel to be carried<br />
within 80 %(fuselage) and 75 %(wings) volume<br />
usage tanks. All tanks in the aircraft are<br />
pressurized with nitrogen gas from the on-board inert gas generating system (OBIGGS).<br />
Pressurizing is minimal due to structural constraints and JP-8’s low vapor pressure of 0.029 psia<br />
@ 100 °F (200 Pa @ 42.3 °C). Nitrogen reduces fuel fumes and thus the chance of an accidental<br />
explosion. All tanks on the aircraft are self sealing and feature flame resistant overflow and<br />
exhaust venting.<br />
Single point fueling and de-fueling can be<br />
performed from the starboard side of the<br />
forward fuselage Figure 14.3. This fueling<br />
point shares common lines with the Air Force<br />
retractable fueling boom port (Figure 14.4)<br />
located on the upper portion of the same<br />
segment of forward fuselage. Both ports offer<br />
fueling rates as high as 1100 gpm (4164 lpm),<br />
the maximum KC-10 Fuel Probe refueling rate<br />
(Table 10.II).<br />
Fuel is then power transferred to tank three<br />
and four. From tank four it is distributed to<br />
wing tanks one and two.<br />
Figure 14.3 - Fuel System Architecture<br />
Figure 14.4 - Retractable in-flight<br />
refueling boom ports, F22, F-117, B-2<br />
92
Gravity ground refueling is provided via ports on the upper surface of the wing into tanks one<br />
and two. From there fuel can gravity feed into tanks three and four. This same gravity feed<br />
system can be utilized in flight given power feed system loss.<br />
All major thermal transfer within the aircraft is performed by the fuel system. The air cooled fuel<br />
cooler utilizing inlet duct boundary layer and flow control diversion air, placed ahead of the main<br />
gear bays dissipates all kinetic heating experienced by the airframe as well as systems heat<br />
generated. Dual heat exchangers are utilized for combat survivability. Fuel flow rate system<br />
requirements (Table 14.II) will be used to size fuel lines and pumps. All fuel lines are redundant<br />
to provide for fuel circulation and system combat survivability. The Vendetta is fitted with an<br />
onboard fire suppression system, utilizing a halon suppressant in the engine bay and fuel cutoff<br />
valves at all fuel tanks. The system is designed so it can be retrofitted with a more<br />
environmentally friendly suppression chemical in the future.<br />
Table 14.II - Fuel System Sizing Requirements<br />
Fuel System Sizing Requirement<br />
Fuel Flow Rate<br />
GPM (LPM)<br />
CG Shift Requirement Between #3 and #4 Fuel Tanks 100 (379)<br />
KC-10 Probe Maximum Refueling Rate 1100 (4164)<br />
(2) F-119 Turbofan @ Max Thrust With Reheat 294 (1113)<br />
Air Cooled Fuel Cooler (ACFC) 400 (1514)<br />
93
15 Manufacturing<br />
Several manufacturing considerations have been considered and planned for in the design of the<br />
Vendetta. One of these considerations is part commonality, which reduces the total number of<br />
separate parts that must be manufactured; thereby lowering manufacturing costs. The Vendetta<br />
is symmetrical in that both left and right wings,<br />
landing gear, horizontal and vertical stabilizers,<br />
etc. will be manufactured almost exactly the<br />
same. Furthermore, all flying surfaces are<br />
symmetrical and would provide an additional<br />
improvement in manufacturing costs.<br />
The design has also taken into consideration the<br />
routing of electrical lines, hydraulic lines, etc.<br />
These systems would be interconnected through a<br />
routing tunnel through the fuselage of the aircraft.<br />
This would reduce installation complexity and<br />
therefore reduce the amount of labor involved in<br />
the installation process. The routing tunnel as it<br />
passes beside the forward fuel tank, and aft past<br />
the weapons bay is shown below in Figure 15.1.<br />
Figure 15.1 - Routing Tunnel<br />
Manufacturing breaks include the wings, empennage, forward, center, and aft portions of the<br />
fuselage, as well as the landing gear itself. These breaks are shown in Figure 15.2.<br />
Figure 15.2 - Manufacturing Breaks<br />
94
The entire propulsion system will be capable of being dropped out the bottom of the aircraft<br />
which will provide for an easy installation during the manufacturing process as well as allowing<br />
for easy access during routine maintenance. Computer-aided manufacturing will enable more<br />
complex parts to be machined by computer-numerically-controlled (CNC) machining tools.<br />
Large items such as bulkheads can be easily machined from a single piece of metal. This would<br />
be required in order to meet the stringent structural load limits mandated by the AIAA RFP.<br />
Inspection and maintenance panels will be placed wherever possible throughout the aircraft<br />
without compromising the low-observability requirements. Furthermore, access panels will be<br />
built as “structural doors” able to carry through the skin loads that will also be required to meet<br />
the stringent structural load limits. These access panels will ease maintenance and reduce<br />
maintenance hours required per flight hour.<br />
The assembly line would allow for major components, such as the wing, fuselage, and<br />
empennage to be pre-fabricated at possibly other site locations and brought in to a central<br />
assembly line as shown below in Figure 15.3.<br />
Figure 15.3 - Assembly Line<br />
95
16 Cost Analysis<br />
The final and perhaps most important issue in the purposed development of the Vendetta is the<br />
cost analysis. The methodologies used in developing this analysis were found in the Raymer and<br />
Nicolai texts. Despite the fact that the Nicolai text was written in 1974, when adjusted for<br />
inflation, the method was accurate to within 5% of that method found in the 1999 Raymer text.<br />
Both of these analyses are adjusted for inflation to 2000 dollars. The methods used in the cost<br />
analysis were based on the DAPCA IV model developed by the RAND Corporation. This model<br />
provided a means of calculating the operating cost, life cycle cost, flyaway cost, and the cost<br />
required for research, development, test, and evaluation, or RDT&E.<br />
The RDT&E cost was predicted to be approximately $6.5 billion; whereas, the flyaway cost for a<br />
200 unit buy was calculated to be $128.5 million. This cost approximately 15% under that cost<br />
required by the AIAA RFP set at $150 million dollars per 200 unit buy. The cost per aircraft<br />
based on the number of aircraft purchased is shown below in Figure 16.1.<br />
Figure 16.1 - Cost Analysis<br />
The figure indicates that the cost per aircraft at a 600 unit buy is significantly less at $80.5<br />
million. Note the cost of engineering, development, manufacturing, and materials in the cost<br />
breakdown per unit at a 600 unit buy in comparison to the cost breakdown per unit at a 200 unit<br />
buy; the percentages associated with development and engineering decreases while the<br />
manufacturing and materials percentages increase. This is due to the fact that at a 600 unit buy,<br />
96
there are more aircraft available to help pay the $6.5 billion cost associated with RDT&E.<br />
Furthermore, there is a learning curve associated with the development of a large quantity of<br />
aircraft and the airplane become even less costly to produce.<br />
Four factors were considered when determining the operating cost of the Vendetta. These factors<br />
included the cost of the fuel and pilots, as well as the cost of parts and maintenance personal.<br />
Raymer estimates that a bomber flies approximately 400 hours per year and requires 40<br />
maintenance man hours per flight hour. In addition, because the Vendetta is designed to fly very<br />
fast at high altitudes, the fuel cost is a large percentage of the total operating cost. The operating<br />
cost of the Vendetta is calculated to be $13,000 per flight hour. This cost breakdown is shown<br />
below in Figure 16.2.<br />
Figure 16.2 - Operating Cost<br />
One final cost that must be considered beyond the cost of RDT&E, flyaway, and operations is<br />
the lifecycle cost. This cost considers the cost of RDT&E, flyaway, and operations over a 30<br />
year period at 400 flight hours per year, as well as the cost of disposal. This cost is totaled at<br />
$293 million per aircraft at a 200 unit buy. A breakdown of the lifecycle cost is shown below in<br />
Figure 16.3.<br />
Figure 16.3 - Lifecycle Cost<br />
97
Appendix<br />
Threats Chart<br />
Common Surface to Air Missiles and Threats to Airborne Aircraft<br />
98
Diffuser Efficiency<br />
Literal Factor Forms<br />
Mode Damping ratio (ζ) Natural Frequency (ω n )<br />
Phugoid<br />
ζ<br />
P<br />
−X<br />
u<br />
=<br />
2ω<br />
Zα<br />
Mq<br />
+ M α<br />
+<br />
Short Period u<br />
0<br />
ζ =<br />
SP<br />
2ω<br />
Dutch Roll<br />
ζ<br />
DR<br />
1<br />
β 0 r<br />
=− ⎜ ⎟<br />
2ωn<br />
u0<br />
DR<br />
n<br />
n<br />
⎛Y<br />
⎝<br />
p<br />
SP<br />
+ u N<br />
⎞<br />
⎠<br />
ω<br />
n<br />
DR<br />
ω<br />
n<br />
P<br />
=<br />
Z M<br />
−Zg<br />
u<br />
u<br />
α q<br />
ω<br />
n<br />
= −<br />
SP<br />
u0<br />
=<br />
0<br />
M<br />
α<br />
YN − NY+<br />
uN<br />
β β β r 0 β<br />
u<br />
0<br />
99
Wing Break Point<br />
Fuel<br />
Aft Fuselage<br />
Break Point<br />
56°<br />
14°<br />
13°<br />
Forward Fuselage<br />
Break Point<br />
54.7' [16669.5]<br />
20.7'<br />
[6294.8]<br />
5.3'<br />
[1621.3]<br />
Fuel<br />
Fuel<br />
102.8' [31337.8]<br />
5°<br />
11°
(4) Mk-84 LDGP + (2) AIM-120<br />
Weapon Weight<br />
1,967 lb (890 kg)<br />
Configuration Weight 10,222 lb (4,625 kg)<br />
Weapon Length<br />
12.6 ft (3.84m)<br />
Weapon Diameter<br />
18 in (45.7cm)<br />
Tail Span 2 ft (0.61 m)<br />
Max Drop Height<br />
Unlimited<br />
Max Tested Drop Velocity M=1.3<br />
Guidance<br />
Ballistic<br />
Weapon Information:<br />
Development of the Mk 84 Low Drag General<br />
Purpose Bomb for use by the United States armed<br />
forces began in the 1950’s. The Mk 84 bomb, which is<br />
fitted with 30 in (0.762m) spaced suspension lugs, is<br />
packed with 942 lb (426 kg) of Tritonal or H-6. The<br />
known inventory of Mk 81, 82, and 84 bombs is 1.13<br />
million.<br />
(4) GBU-27 + (2) AIM-120<br />
Weapon Weight<br />
2,165 lb (980 kg)<br />
Configuration Weight 11,014 lb (4,984 kg)<br />
Weapon Length 13.9 ft (4.24 m)<br />
Weapon Diameter<br />
14.6 in (37 cm)<br />
Tail Span 2 ft (0.61 m)<br />
Max Drop Height<br />
Unlimited<br />
Max Tested Drop Velocity Unknown<br />
Guidance<br />
Semi-Active Laser<br />
Weapon Information:<br />
The GBU-27 is a modified GBU-24 Paveway III<br />
designed for internal carriage in the F-117A. This LGB<br />
carries the designation GBU-27 /B and uses a BLU-<br />
109 /B penetrator bomb for its warhead. The main<br />
modifications made to the GBU-24 were to have<br />
shorter adaptor rings and to use the GBU-10’s rear<br />
wing unit to decrease the bomb’s length, and to clip the<br />
canards in order to make the weapon fit into the small<br />
F-117A Bomb Bay. The other major difference was the<br />
use of radar absorbing materials in order to prevent the<br />
bombs from being picked up by enemy radar once the<br />
aircraft’s bomb doors were opened. As a result of these<br />
modifications, the GBU-27 has a shorter range than the<br />
GBU-24, which can also be launched at lower<br />
altitudes.<br />
Guidance is by semi-active laser, the scanning<br />
detector assembly and laser energy receiver being<br />
mounted in the front of the canister behind the glass<br />
dome. After the bomb is released the laser error<br />
detector measures the angle between the bomb’s<br />
velocity vector and the line between the bomb and<br />
target. Steering corrections are made by moving the<br />
nose mounted canard control fins to adjust the bomb’s<br />
trajectory to line up with the target. The tail fins/wings<br />
are for stabilization purposes only. Target illumination<br />
for the system may be either by an aircraft-mounted<br />
laser marker (not necessarily the parent aircraft) or a<br />
ground-based laser transmitter.<br />
(4) 2000lb JDAM +(2) AIM-120<br />
Weapon Weight 2,100 lb (950 kg)<br />
Configuration Weight 10,754 lb (4,866 kg)<br />
Weapon Length 13.2 ft (4.02 m)<br />
Weapon Diameter 18 in (46 cm)<br />
Tail Span 2 ft (0.61 m)<br />
Max Drop Height Unlimited<br />
Max Drop Velocity M=1.3 tested<br />
Guidance<br />
GPS / INS<br />
Weapon Information:<br />
A parallel program to the AGM-154 JSOW the<br />
GBU-31 JDAM program began in the late 1980’s. The<br />
goal of the program was to produce a low cost guided<br />
munition. Interesting to note is the GBU-31 is soon to<br />
be replaced by the GBU-32/35. This new weapon, will<br />
utilize an I-1000 1000 lb (452.5 kg) penetrator warhead<br />
and is intended for future use in the F-22 raptor. This<br />
weapon, the GBU-32/35 is being used to size the<br />
raptor’s weapon bays.<br />
The GBU-31 utilizes both the Mk 84 and BLU-109<br />
warheads. Due to the Mk 84’s low cost, and<br />
commonality, it was chosen for the solid model seen<br />
above. The GBU-31 consists of three major<br />
subassemblies. The warhead (Mk 84), Saddleback stub<br />
wing assembly (attaches at hardpoints, three<br />
components), and a bolt on tail cone guidance kit.<br />
The guidance kit, contained within the replacement<br />
bolt-on tail cone consists of the following key<br />
elements: combined inertial measuring unit and GPS<br />
receiver; flight control computer; battery and power<br />
distribution unit; tail actuators and four movable<br />
clipped delta fins in a cruciform configuration. In<br />
keeping with other GPS guided weapons, the unit is<br />
believed to be fitted with two GPS antennas, one on<br />
top of the unit for initial flight and one in the tail for<br />
good reception during terminal maneuvering.<br />
Prior to bomb release the guidance unit will be fed<br />
with aircraft position, velocity and target coordinates<br />
through the aircraft to bomb interface. After release the<br />
bomb will guide itself to the target by means of rear fin<br />
deflection, which are driven by commands from an<br />
onboard computer that is constantly being updated by<br />
the GPS. The combination of the INS/GPS is expected<br />
to allow the bombs to hit within 32.8 ft (10 m) to 49.2<br />
ft ( 15 m) of their targets. Wind tunnel tests in 1996 are<br />
reported to have cleared JDAM for release at up to<br />
Mach 1.3.<br />
(4) AGM-154 JSOW + (2) AIM-120<br />
Weapon Weight 1,064 lb (481 kg)<br />
Configuration Weight 6,610 lb (2,991 kg)<br />
Weapon Length 14 ft (4.26 m)<br />
Weapon Diameter 21 in (53 cm)<br />
Tail Span 24 in (0.61 m)<br />
Max Drop Height Unlimited<br />
Max Drop Velocity Subsonic<br />
Guidance<br />
GPS / INS<br />
Weapon Information:<br />
In the late 1980’s the US Navy began a review of<br />
conventional weapons with the intention of reducing<br />
the number of weapon types. New systems were<br />
selected for future development: JDAM, TSSAM,<br />
JASSM, and the advanced interdiction weapon system<br />
to be later named Joint Standoff Weapon (JSOW).<br />
The JSOW program is intended to replace six<br />
existing weapons: the AGM-65 Maverick, AGM-123<br />
Skipper, AGM-62A Walleye, Rockeye and APAM<br />
(Anti-Personnel/Anti-Material) submunition<br />
dispensers, and laser- and TV- guided bombs.<br />
Of particular attention on the previous list is:<br />
1) All weapons are air to ground.<br />
2) This weapon is designed to replace the<br />
GBU-27, one of the weapons on the RFP<br />
attachment 3 list.<br />
The JSOW is an aerodynamically shaped,<br />
unpowered glide dispenser with a rectangular crosssection<br />
body shape. It is made up of three major<br />
sections: a streamlined nose fairing that houses the<br />
guidance and control system, a rectangular center<br />
section payload container for holding the bomblets<br />
(this is fitted with two folding high aspect ratio wings<br />
on its upper surface, and two standard 30 in (0.762 m)<br />
spaced suspension lugs); and the tail section which has<br />
six fixed, sweptback rectangular fins positioned<br />
radially on the boat tail and contains the flight control<br />
system.<br />
(16) 250 lb Small Smart Bomb<br />
Weapon Weight 250 lb (113 kg)<br />
Configuration Weight 5,500 lb (2,489 kg)<br />
Weapon Length 8.2 ft (2.5 m)<br />
Weapon Diameter 6 in (0.15 m)<br />
Max Drop Height Unlimited<br />
Max Drop Velocity Unknown<br />
Guidance<br />
GPS / INS<br />
Weapon Information:<br />
The Small Smart Bomb is a 250 lb (113 kg) weapon<br />
that has the same penetration capabilities as a 2000lb<br />
(905 kg) BLU-109, but with only 50 lbs (22.6 kg) of<br />
explosive. With the INS/GPS guidance in conjunction<br />
with differential GPS (using all 12 channel receivers,<br />
instead of only 5) corrections provided by GPS SPO<br />
Accuracy Improvement Initiative (AII) and improved<br />
Target Location Error (TLE), it can achieve a 5-8m<br />
(16.4 to 26.3 ft) CEP. The submunition, with a smart<br />
fuze, has been extensively tested against multi-layered<br />
targets by Wright Laboratory under the Hard Target<br />
Ordnance Program and Miniature Munitions<br />
Technology Program. The length to diameter ratio and<br />
nose shape are designed to optimize penetration for a<br />
50lb (22.6 kg) charge. This weapon is also a potential<br />
payload for standoff carrier vehicles such as<br />
Tomahawk, JSOW, JASSM, Conventional ICBM, etc.<br />
The Swing Wing Adapter Kit (SWAK) is added to give<br />
the SSB standoff of greater than 25 nm (48.6 km) from<br />
high altitude release. The wing kit is jettisoned at a<br />
midcourse way point if penetration is required so that<br />
velocity can be increased after wing release. For soft<br />
targets the wing kit continues to extend the glide range<br />
until small arms threat altitude is reached. At this point<br />
the wings are released. With INS/GPS guidance,<br />
coupled with AII, a 6-8 m (19.7 to 26.3 ft) CEP can be<br />
achieved. This wing kit allows the SSB to be directly<br />
attached to the aircraft at any 300 lb (135.75 kg) store<br />
station. The major advantage to the 250 lb (113.125<br />
kg) small smart bomb is an improved number of targets<br />
per pass capability.<br />
AIM-120 C AMRAAM<br />
Weapon Weight 327 lb (148 kg)<br />
Configuration Weight 5,500 lb (2,489 kg)<br />
Weapon Length 12 ft (3.657 m)<br />
Weapon Diameter 7 in (0.1778 m)<br />
Fin Span 1 ft 6 in (0.457 m)<br />
Max Drop Height Unlimited<br />
Max Drop Velocity Supersonic<br />
Guidance<br />
Command from<br />
Launch Aircraft<br />
INS<br />
Monopulse Radar<br />
Seeker<br />
Weapon Information:<br />
The Advanced Medium-Range Air to Air Missile<br />
(AMRAAM) AIM-120 development program was<br />
started in 1975. It was designed to follow on and better<br />
the performance of the Aim-7 Sparrow and be carried<br />
on the F-14, F-15, F-16 and F/A-18 aircraft. In the late<br />
90’s a modified(smaller) version of the missile, the<br />
AIM-120C was developed to be fitted to the F-22<br />
Raptor. This newer version also incorporates a dual<br />
mode active and passive radar seeker. The AIM-120C<br />
is deigned to be rail, ejector or trapeze launched. On<br />
the F-22 the AIM-120C is launched using an EDO<br />
corp. LAU-142/A hydraulic / pneumatic ejector.<br />
In a typical engagement the missile is launched and<br />
first guided by on-missile inertial navigation, with<br />
command guidance updates from the launch aircraft.<br />
The missile then goes into the mid-course autonomous<br />
mode and continues to guide by inertial navigation<br />
only. Finally, the terminal mode is automatically<br />
initiated by the missile itself when the target is within<br />
rage of the missile’s active monopulse radar seeker,<br />
which then guides the missile onto the target aircraft.<br />
Foldout 2 – Weapons Information
The Vendetta Design Team<br />
Chris Atkinson is a bachelor’s candidate in aerospace engineering<br />
with a computer science minor. His responsibilities for the Vendetta<br />
included aerodynamic and performance analysis as well as validation<br />
modeling. He participates in the <strong>Cal</strong> <strong>Poly</strong> Flight Simulation Group and<br />
enjoys fencing and hiking.<br />
Chris Droney is a blended program master’s candidate in aerospace<br />
engineering. Chris was the team leader and lead configurator for the<br />
Vendetta. He designs, builds, and flies R/C planes and gliders. Chris also<br />
has his private pilot’s license and enjoys flying when he gets the chance.<br />
Kolby Keiser is a 23 year old master’s candidate in aerospace<br />
engineering. Her responsibility in the Vendetta design group was aircraft<br />
propulsion. In her spare time, Kolby enjoys hiking, exercising, and other<br />
outdoor activities, in addition to swing dancing. She also participates in<br />
diabetes education in the community.<br />
105
Chris Maglio is a bachelor’s candidate in aerospace engineering. His<br />
responsibilities in the Vendetta design group encompassed configuration,<br />
weapons, and systems. Chris is an active member of Central Coast Polo<br />
and the USPA. Besides pursuing the hobby of mountain biking<br />
throughout the academic year, Chris, working as a consultant, has<br />
designed and manufactured numerous nautical, aerospace, civil, and<br />
automotive products.<br />
Dan Salluce is a 23 year old blended program master’s candidate in<br />
aerospace engineering. His responsibilities in the Vendetta design<br />
included stability and control analysis, radar cross section determination,<br />
and flight simulator validation. Dan is interested in control system<br />
design. He participates in the <strong>Cal</strong> <strong>Poly</strong> Flight Simulation Group, teaches<br />
Aerospace classes at <strong>Cal</strong> <strong>Poly</strong>, and enjoys R/C gliders and the <strong>San</strong> <strong>Luis</strong><br />
<strong>Obispo</strong> nightlife and nearby beaches.<br />
Nathan Schnaible is a 5 th year aerospace engineering student who<br />
will graduate with a bachelor’s degree in June of 2002. Nathan worked<br />
on the weights & balances, manufacturing, and cost analysis areas of the<br />
Vendetta. His background in the aerospace industry includes<br />
maintenance duties on refurbished Albatross’, ground service on both<br />
corporate and commercial aircraft, as well as piloting experience.<br />
Nathan will be attending the United States Navy Flight School in the<br />
spring of 2003.<br />
106
References<br />
1. “Ejection Systems,” www.bfg-aerospace.com, BF Goodrich Corporation, 2001.<br />
2. “Military Standard – Aircrew Station Controls and Dispalys: Location, Arrangement, and<br />
Actuaion of, for Fixed Wing Aircraft,” United States Department of Defense, 1991.<br />
3. “Military Standard – Aircrew Station Geometry for Military Aircraft,” United States<br />
Department of Defense, 1976.<br />
4. Abbott, I. H., Von Doenhoff, A. E. Theory of Wing Sections, Dover Publications, INC.<br />
New York 1959.<br />
5. Cummings D. Boeing Long Beach, Advanced Aircraft Design<br />
6. Currey, N. S. Aircraft Landing Gear Design: Principles and Practices, AIAA,<br />
Washington DC, 1988.<br />
7. Dillenius, M. F. E. Perkins, S. C., Nixon, D., “Pylon Carriage and Separation of Stores,”<br />
Tactical Missile Aerodynamics: General Topics, Edited by Michael J. Hemsch, Vol. 141,<br />
Progress in Aeronautics and Astronautics, AIAA, New York, 1992, pp. 575-666.<br />
8. Goodall, J. C. Americas Stealth Fighters and Bombers, Motorbooks International<br />
Publishers and Wholesalers, Osceola, WI, 1992<br />
9. Jane’s All The World’s Aircraft 2000-2001, Janes Information Group Inc. Alexandria,<br />
Virginia, 2000<br />
10. Jane’s Avionics 2001-2002. Janes Information Group Inc. Alexandria, Virginia, 2001<br />
11. Lennox D. Jane’s Air-Launched Weapons Issue 35. Janes Information Group Inc.<br />
Alexandria, Virginia, 2000<br />
12. Mattingly, Jack D., Elements of Gas Turbine Propulsion, McGraw-Hill, Inc. New York,<br />
NY, 1996.<br />
13. MIL-A-8860B<br />
14. MIL-A-8861B<br />
15. MIL-STD-850B<br />
16. MIL-E-5008B<br />
107
17. NACA-TN-3182, “Manual of the ICAO Standard Atmosphere <strong>Cal</strong>culations by the<br />
NACA”, NASA, 1976<br />
18. Nicolai, L. M. Fundamentals of Aircraft Design, METS Inc., <strong>Cal</strong>ifornia, 1984.<br />
19. Oates, G. C. Aircraft Propulsion Systems Technology and Design, AIAA, Washington<br />
DC, 1989.<br />
20. Raymer, D. P. Aircraft Design: A Conceptual Approach – Third Edition, AIAA,<br />
Washington DC, 1999.<br />
21. Roskam, J. Airplane Design, Part I: Preliminary Sizing of Airplanes, DARcorporation,<br />
Kansas, 1997.<br />
22. Roskam, J. Airplane Design, Part II: Preliminary Preliminary Configuration Design and<br />
Integration of the Propulsion System, DARcorporation, Kansas, 1997.<br />
23. Roskam, J. Airplane Design: Part III, Roskam Aviation And Engineering Corporation,<br />
Ottawa, KS, 1989, pp 1-34.<br />
24. Roskam, J. Airplane Flight Dynamics and Automatic Flight Controls, DARcorporation,<br />
Kansas, 1979.<br />
25. Wilcox, F. J., Baysal, O., Stallings, R. L., “Tangential, Semisubmerged, and Internal<br />
Store Carriage and Separation,” Tactical Missile Aerodynamics: General Topics, Edited<br />
by Michael J. Hemsch, Vol. 141, Progress in Aeronautics and Astronautics, AIAA, New<br />
York, 1992, pp. 667-721.<br />
26. www.aeronautics.ru/nws002/f22/diagram05.jpg<br />
27. www.aeronautics.ru/nws002/f22/diagram06.jpg<br />
28. www.aeronautics.ru/nws002/f22/systems.htm<br />
29. www.af.mil/news/efreedom/bombs.html<br />
30. www.af.mil/news/factsheets/KC_10A_Extender.html<br />
31. www.af.mil/news/factsheets/KC_135_stratotanker.html<br />
32. www.arfl.afr.mil<br />
33. www.aoe.vt.edu/aoe/faculty/Mason_f/M96SC.html<br />
34. www.batnet.com/mfwright/spacesuit.html<br />
108
35. www.dfrc.nasa.gov/PAO/PAIS/HTML/FS-061-DFRC.html<br />
36. www.eureka.findlay.co.uk/archive_features/Arch_Automotive/n-push/n-push.html<br />
37. www.fas.org/man/dod-101/sys/ac/equip/lau-142.htm<br />
38. www.fas.org/man/dod-101/sys/ac/equip/lau-142.htm<br />
39. www.fas.org/man/dod-101/sys/missle/amraam-5.jpg<br />
40. www.fas.org/man/dod-101/sys/smart/agm-154.htm<br />
41. www.fas.org/man/dod-101/usaf/docs/mast/annex_f/part06.htm<br />
42. www.globalsecurity.org/military/systems/aircraft/f-22-fcas.htm<br />
43. www.sff.net/people/geoffrey.landis/vacuum.html<br />
44. www.skf-linear.co.il<br />
109