SAWE Report - Cal Poly San Luis Obispo
SAWE Report - Cal Poly San Luis Obispo
SAWE Report - Cal Poly San Luis Obispo

You also want an ePaper? Increase the reach of your titles
YUMPU automatically turns print PDFs into web optimized ePapers that Google loves.
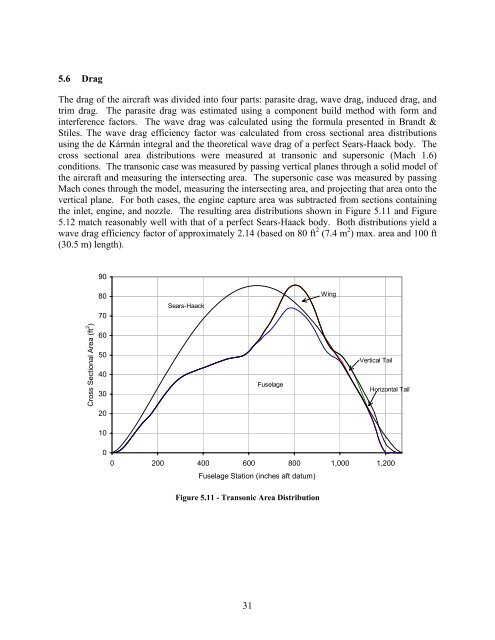
5.6 Drag<br />
The drag of the aircraft was divided into four parts: parasite drag, wave drag, induced drag, and<br />
trim drag. The parasite drag was estimated using a component build method with form and<br />
interference factors. The wave drag was calculated using the formula presented in Brandt &<br />
Stiles. The wave drag efficiency factor was calculated from cross sectional area distributions<br />
using the de Kármán integral and the theoretical wave drag of a perfect Sears-Haack body. The<br />
cross sectional area distributions were measured at transonic and supersonic (Mach 1.6)<br />
conditions. The transonic case was measured by passing vertical planes through a solid model of<br />
the aircraft and measuring the intersecting area. The supersonic case was measured by passing<br />
Mach cones through the model, measuring the intersecting area, and projecting that area onto the<br />
vertical plane. For both cases, the engine capture area was subtracted from sections containing<br />
the inlet, engine, and nozzle. The resulting area distributions shown in Figure 5.11 and Figure<br />
5.12 match reasonably well with that of a perfect Sears-Haack body. Both distributions yield a<br />
wave drag efficiency factor of approximately 2.14 (based on 80 ft 2 (7.4 m 2 ) max. area and 100 ft<br />
(30.5 m) length).<br />
90<br />
80<br />
70<br />
Sears-Haack<br />
Wing<br />
Cross Sectional Area (ft 2 )<br />
60<br />
50<br />
40<br />
30<br />
Fuselage<br />
Vertical Tail<br />
Horizontal Tail<br />
20<br />
10<br />
0<br />
0 200 400 600 800 1,000 1,200<br />
Fuselage Station (inches aft datum)<br />
Figure 5.11 - Transonic Area Distribution<br />
31